The European livestock resistome
- PMID: 38501800
- PMCID: PMC11019871
- DOI: 10.1128/msystems.01328-23
The European livestock resistome
Abstract
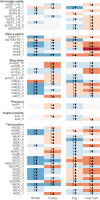
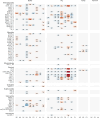
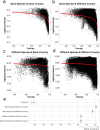
Metagenomic sequencing has proven to be a powerful tool in the monitoring of antimicrobial resistance (AMR). Here, we provide a comparative analysis of the resistome from pigs, poultry, veal calves, turkey, and rainbow trout, for a total of 538 herds across nine European countries. We calculated the effects of per-farm management practices and antimicrobial usage (AMU) on the resistome in pigs, broilers, and veal calves. We also provide an in-depth study of the associations between bacterial diversity, resistome diversity, and AMR abundances as well as co-occurrence analysis of bacterial taxa and antimicrobial resistance genes (ARGs) and the universality of the latter. The resistomes of veal calves and pigs clustered together, as did those of avian origin, while the rainbow trout resistome was different. Moreover, we identified clear core resistomes for each specific food-producing animal species. We identified positive associations between bacterial alpha diversity and both resistome alpha diversity and abundance. Network analyses revealed very few taxa-ARG associations in pigs but a large number for the avian species. Using updated reference databases and optimized bioinformatics, previously reported significant associations between AMU, biosecurity, and AMR in pig and poultry farms were validated. AMU is an important driver for AMR; however, our integrated analyses suggest that factors contributing to increased bacterial diversity might also be associated with higher AMR load. We also found that dispersal limitations of ARGs are shaping livestock resistomes, and future efforts to fight AMR should continue to emphasize biosecurity measures.IMPORTANCEUnderstanding the occurrence, diversity, and drivers for antimicrobial resistance (AMR) is important to focus future control efforts. So far, almost all attempts to limit AMR in livestock have addressed antimicrobial consumption. We here performed an integrated analysis of the resistomes of five important farmed animal populations across Europe finding that the resistome and AMR levels are also shaped by factors related to bacterial diversity, as well as dispersal limitations. Thus, future studies and interventions aimed at reducing AMR should not only address antimicrobial usage but also consider other epidemiological and ecological factors.
Keywords: antimicrobial resistance; diversity; livestock; metagenomics; resistome.
Conflict of interest statement
The authors declare no conflict of interest.
Figures


References
-
- WHO . Antimicrobial resistance global report on surveillance 2014. World Health Organization; (2014).
-
- World Bank Group . 2019. Pulling together to beat superbugs; knowledge and implementation gaps in addressing antimicrobial resistance. Available from: http://documents.worldbank.org/curated/en/430051570735014540/pdf/Pulling...
-
- EFSA Panel on Animal Health and Welfare (AHAW), Nielsen SS, Bicout DJ, Calistri P, Canali E, Drewe JA, Garin-Bastuji B, Gonzales Rojas JL, Gortazar Schmidt C, Herskin M, Michel V, Miranda Chueca MA, Padalino B, Pasquali P, Roberts HC, Spoolder H, et al. 2021a. Assessment of animal diseases caused by bacteria resistant to antimicrobials: poultry. EFSA J 19:e07114. doi: 10.2903/j.efsa.2021.7114 - DOI - PMC - PubMed
-
- EFSA Panel on Animal Health and Welfare (AHAW), Nielsen SS, Bicout DJ, Calistri P, Canali E, Drewe JA, Garin-Bastuji B, Gonzales Rojas JL, Gortazar Schmidt C, Herskin M, Michel V, Miranda Chueca MA, Padalino B, Pasquali P, Roberts HC, Sihvonen LH, et al. 2021. Assessment of animal diseases caused by bacteria resistant to antimicrobials: swine. EFSA J 19:e07113. doi: 10.2903/j.efsa.2021.7113 - DOI - PMC - PubMed
-
- EFSA Panel on Animal Health and Welfare (AHAW), Nielsen SS, Bicout DJ, Calistri P, Canali E, Drewe JA, Garin-Bastuji B, Gonzales Rojas JL, Gortazar Schmidt C, Herskin M, Michel V, Miranda Chueca MA, Padalino B, Pasquali P, Roberts HC, Spoolder H, et al. 2021b. Assessment of animal diseases caused by bacteria resistant to antimicrobials: cattle. EFSA J 19:e06955. doi: 10.2903/j.efsa.2021.6955 - DOI - PMC - PubMed
MeSH terms
Substances
Grants and funding
LinkOut - more resources
Full Text Sources
