

Alterations in the gut microbiota and its metabolites contribute to metabolic maladaptation in dairy cows during the development of hyperketonemia
- PMID: 38501812
- PMCID: PMC11019918
- DOI: 10.1128/msystems.00023-24
Alterations in the gut microbiota and its metabolites contribute to metabolic maladaptation in dairy cows during the development of hyperketonemia
Abstract
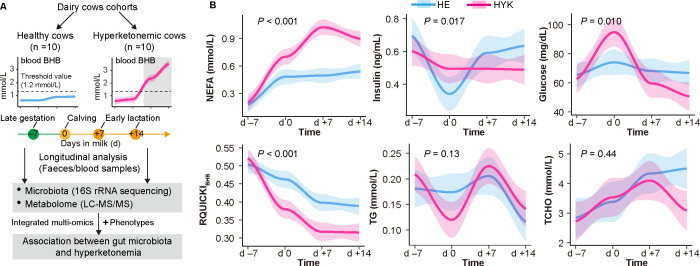
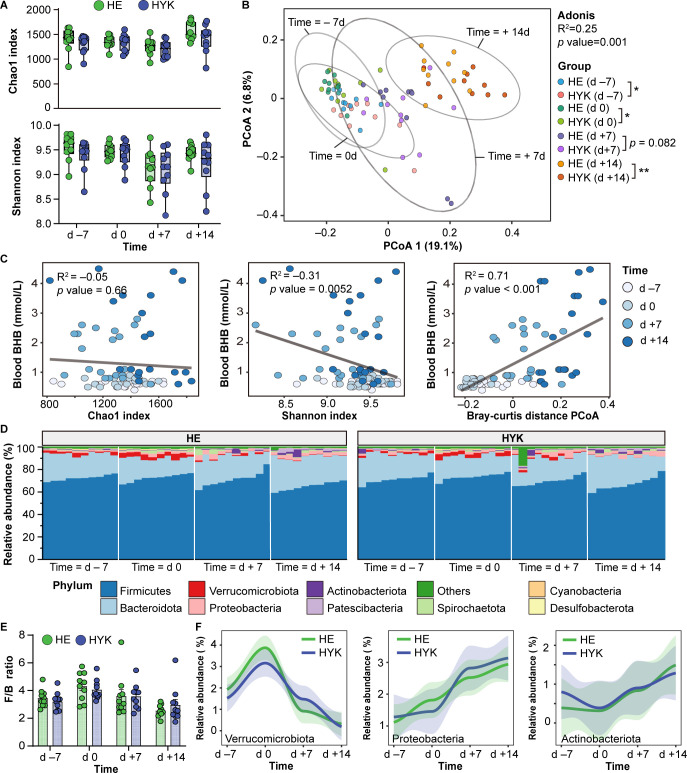
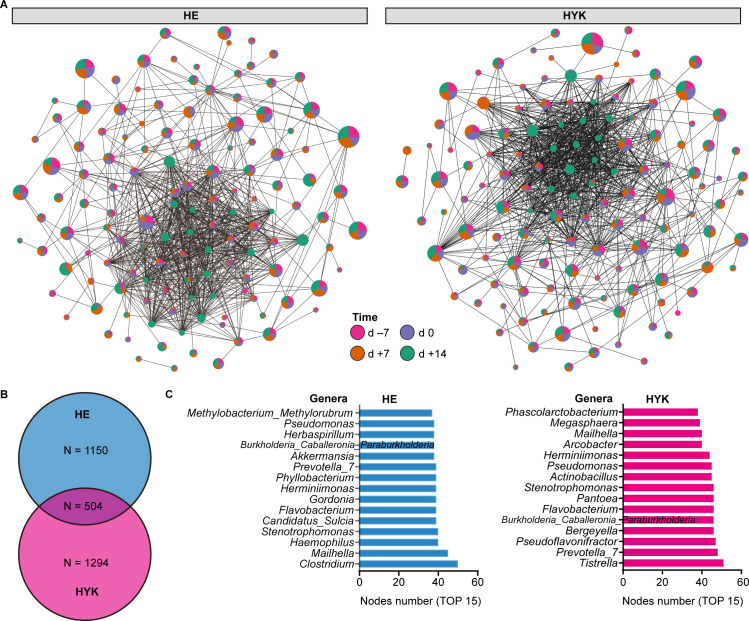
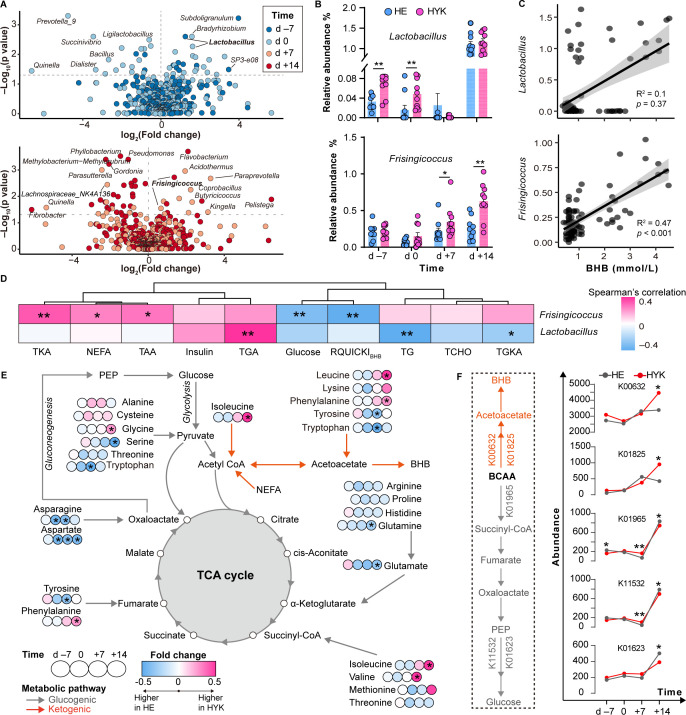
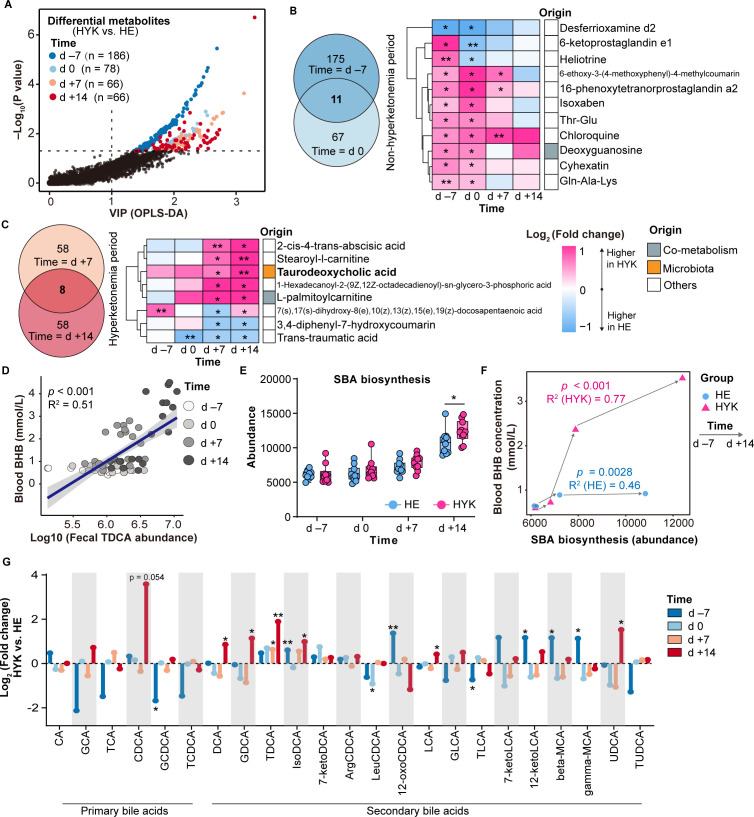
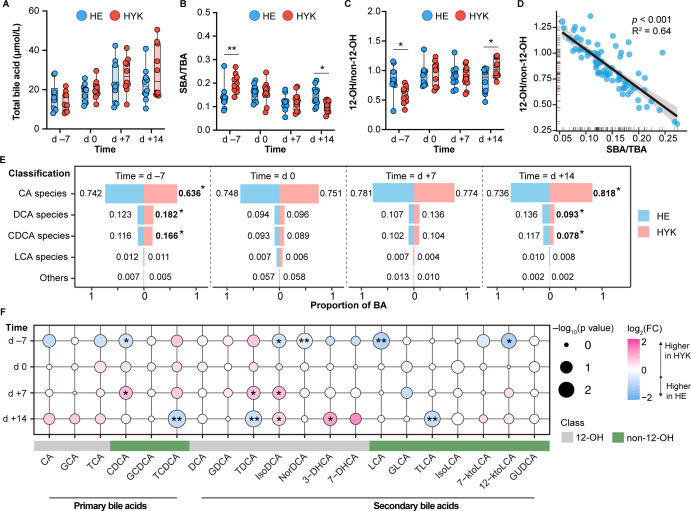
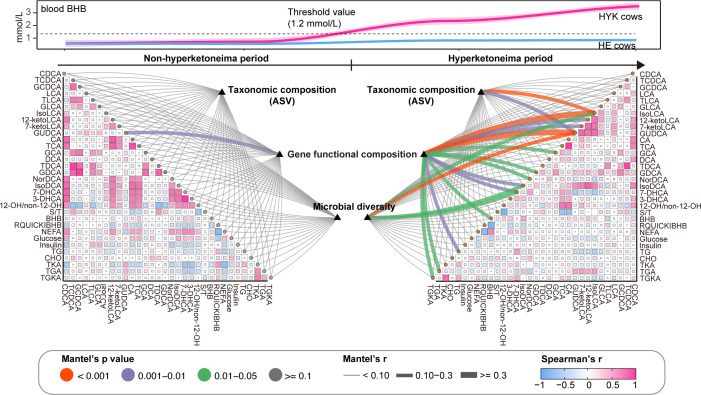
Metabolic maladaptation in dairy cows after calving can lead to long-term elevation of ketones, such as β-hydroxybutyrate (BHB), representing the condition known as hyperketonemia, which greatly influences the health and production performance of cows during the lactation period. Although the gut microbiota is known to alter in dairy cows with hyperketonemia, the association of microbial metabolites with development of hyperketonemia remains unknown. In this study, we performed a multi-omics analysis to investigate the associations between fecal microbial community, fecal/plasma metabolites, and serum markers in hyperketonemic dairy cows during the transition period. Dynamic changes in the abundance of the phyla Verrucomicrobiota and Proteobacteria were detected in the gut microbiota of dairy cows, representing an adaptation to enhanced lipolysis and abnormal glucose metabolism after calving. Random forest and univariate analyses indicated that Frisingicoccus is a key bacterial genus in the gut of cows during the development of hyperketonemia, and its abundance was positively correlated with circulating branched-chain amino acid levels and the ketogenesis pathway. Taurodeoxycholic acid, belonging to the microbial metabolite, was strongly correlated with an increase in blood BHB level, and the levels of other secondary bile acid in the feces and plasma were altered in dairy cows prior to the diagnosis of hyperketonemia, which link the gut microbiota and hyperketonemia. Our results suggest that alterations in the gut microbiota and its metabolites contribute to excessive lipolysis and insulin insensitivity during the development of hyperketonemia, providing fundamental knowledge about manipulation of gut microbiome to improve metabolic adaptability in transition dairy cows.IMPORTANCEAccumulating evidence is pointing to an important association between gut microbiota-derived metabolites and metabolic disorders in humans and animals; however, this association in dairy cows from late gestation to early lactation is poorly understood. To address this gap, we integrated longitudinal gut microbial (feces) and metabolic (feces and plasma) profiles to characterize the phenotypic differences between healthy and hyperketonemic dairy cows from late gestation to early lactation. Our results demonstrate that cows underwent excessive lipid mobilization and insulin insensitivity before hyperketonemia was evident. The bile acids are functional readouts that link gut microbiota and host phenotypes in the development of hyperketonemia. Thus, this work provides new insight into the mechanisms involved in metabolic adaptation during the transition period to adjust to the high energy and metabolic demands after calving and during lactation, which can offer new strategies for livestock management involving intervention of the gut microbiome to facilitate metabolic adaptation.
Keywords: dairy cows; gut microbiota; hyperketonemia; metabolic maladaptation; microbial metabolites; multi-omics.
Conflict of interest statement
The authors declare no conflict of interest.
Figures
Similar articles
-
The association of hyperketonemia with fecal and rumen microbiota at time of diagnosis in a case-control cohort of early lactation cows.BMC Vet Res. 2022 Nov 21;18(1):411. doi: 10.1186/s12917-022-03500-4. BMC Vet Res. 2022. PMID: 36411435 Free PMC article.
-
Altered bile acid and correlations with gut microbiome in transition dairy cows with different glucose and lipid metabolism status.J Dairy Sci. 2024 Nov;107(11):9915-9933. doi: 10.3168/jds.2024-24658. Epub 2024 Jun 20. J Dairy Sci. 2024. PMID: 38908707
-
Altered Fecal Microbiome and Correlations of the Metabolome with Plasma Metabolites in Dairy Cows with Left Displaced Abomasum.Microbiol Spectr. 2022 Dec 21;10(6):e0197222. doi: 10.1128/spectrum.01972-22. Epub 2022 Oct 12. Microbiol Spectr. 2022. PMID: 36222683 Free PMC article.
-
Monitoring and Improving the Metabolic Health of Dairy Cows during the Transition Period.Animals (Basel). 2021 Jan 31;11(2):352. doi: 10.3390/ani11020352. Animals (Basel). 2021. PMID: 33572498 Free PMC article. Review.
-
The Most Important Metabolic Diseases in Dairy Cattle during the Transition Period.Animals (Basel). 2024 Mar 6;14(5):816. doi: 10.3390/ani14050816. Animals (Basel). 2024. PMID: 38473200 Free PMC article. Review.
Cited by
-
Deterministic succession patterns in the rumen and fecal microbiome associate with host metabolic shifts in peripartum dairy cattle.Gigascience. 2025 Jan 6;14:giaf042. doi: 10.1093/gigascience/giaf042. Gigascience. 2025. PMID: 40388308 Free PMC article.
-
Metabolic pathways associated with Firmicutes prevalence in the gut of multiple livestock animals and humans.Anim Microbiome. 2025 Mar 3;7(1):20. doi: 10.1186/s42523-025-00379-y. Anim Microbiome. 2025. PMID: 40033444 Free PMC article.
-
Disruption of hindgut microbiome homeostasis promotes postpartum energy metabolism disorders in dairy ruminants by inhibiting acetate-mediated hepatic AMPK-PPARA axis.Microbiome. 2025 Jul 16;13(1):167. doi: 10.1186/s40168-025-02150-6. Microbiome. 2025. PMID: 40671160 Free PMC article.
-
Social Microbial Transmission in a Solitary Mammal.Ecol Lett. 2025 Aug;28(8):e70186. doi: 10.1111/ele.70186. Ecol Lett. 2025. PMID: 40760940 Free PMC article.
-
Gut microbiota regulates hepatic ketogenesis and lipid accumulation in ketogenic diet-induced hyperketonemia by disrupting bile acid metabolism.Gut Microbes. 2025 Dec;17(1):2496437. doi: 10.1080/19490976.2025.2496437. Epub 2025 Apr 23. Gut Microbes. 2025. PMID: 40268803 Free PMC article.
References
MeSH terms
Substances
Grants and funding
- 2023NSFSC0234/Natural Science Foundation of Sichuan Province
- CSTB2022NSCQ- MSX1602/Natural Science Foundation of Chongqing Municipality
- KJZD-M202303501/Science and Technology Research Program of Chongqing Municipal Education Commission
- XZ202201ZY0009N/Key R and D Program Supported by the Department of Science &Technology of Xizang Autonomous Region
LinkOut - more resources
Full Text Sources
Medical
Miscellaneous
