. 2024 May 15;84(10):1680-1698.
doi: 10.1158/0008-5472.CAN-23-2701.

ATG-101 Is a Tetravalent PD-L1×4-1BB Bispecific Antibody That Stimulates Antitumor Immunity through PD-L1 Blockade and PD-L1-Directed 4-1BB Activation

Affiliations

ATG-101 Is a Tetravalent PD-L1×4-1BB Bispecific Antibody That Stimulates Antitumor Immunity through PD-L1 Blockade and PD-L1-Directed 4-1BB Activation

Hui Yuwen et al. Cancer Res. .

Abstract

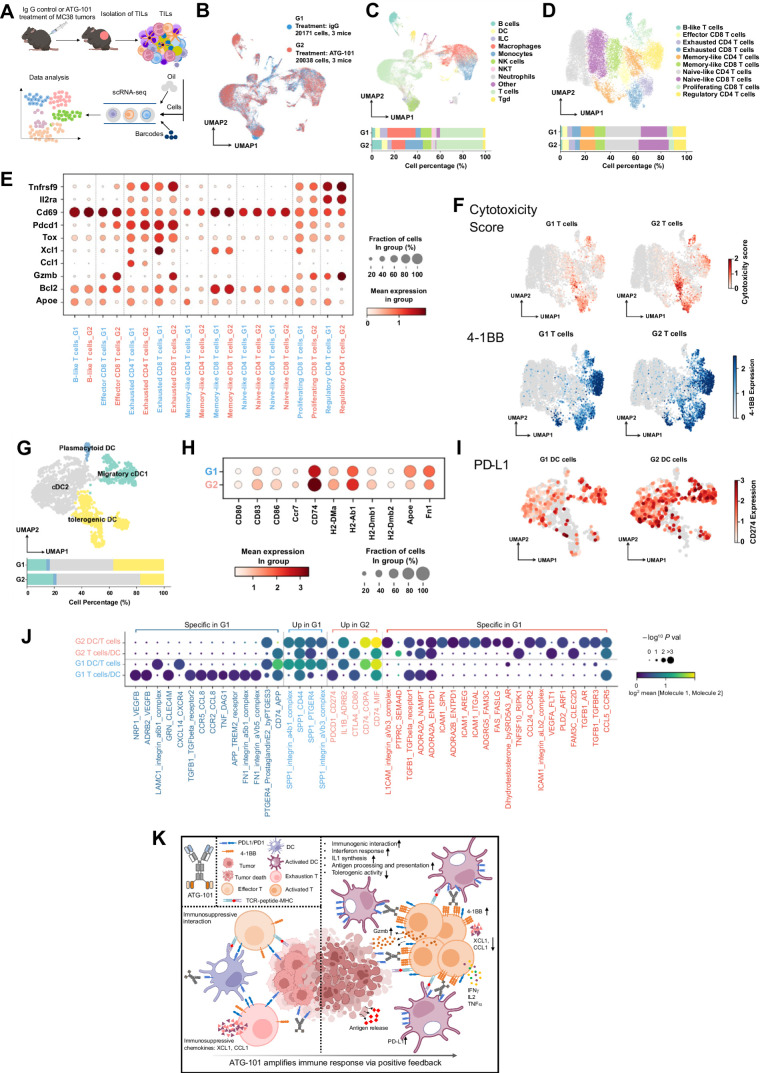
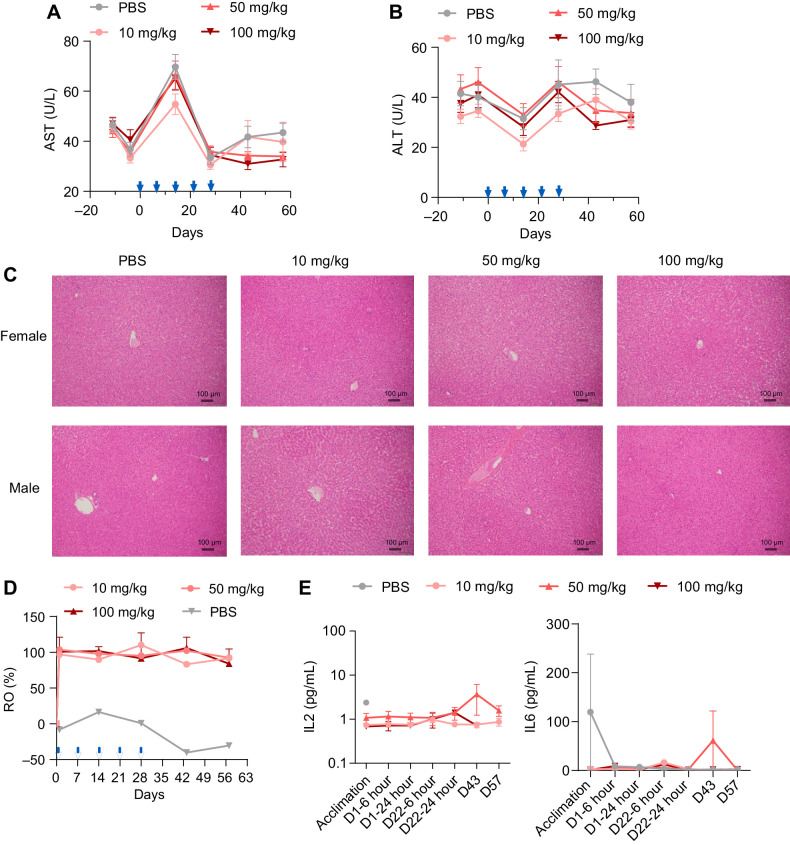
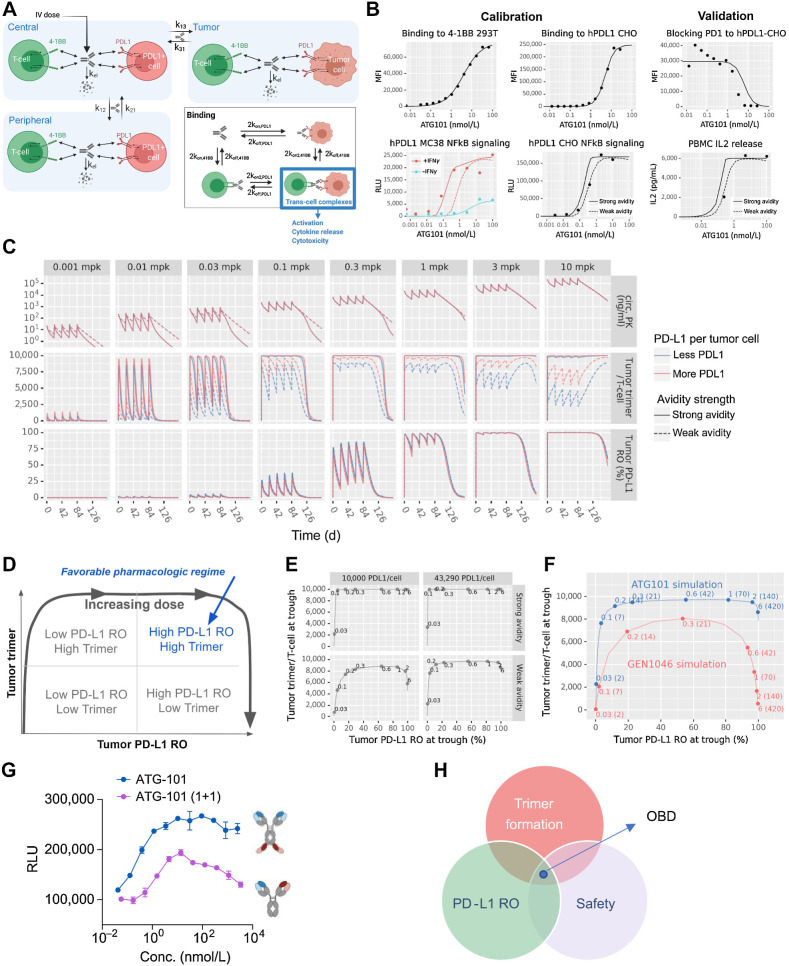
Immune checkpoint inhibitors (ICI) have transformed cancer treatment. However, only a minority of patients achieve a profound response. Many patients are innately resistant while others acquire resistance to ICIs. Furthermore, hepatotoxicity and suboptimal efficacy have hampered the clinical development of agonists of 4-1BB, a promising immune-stimulating target. To effectively target 4-1BB and treat diseases resistant to ICIs, we engineered ATG-101, a tetravalent "2+2″ PD-L1×4-1BB bispecific antibody. ATG-101 bound PD-L1 and 4-1BB concurrently, with a greater affinity for PD-L1, and potently activated 4-1BB+ T cells when cross-linked with PD-L1-positive cells. ATG-101 activated exhausted T cells upon PD-L1 binding, indicating a possible role in reversing T-cell dysfunction. ATG-101 displayed potent antitumor activity in numerous in vivo tumor models, including those resistant or refractory to ICIs. ATG-101 greatly increased the proliferation of CD8+ T cells, the infiltration of effector memory T cells, and the ratio of CD8+ T/regulatory T cells in the tumor microenvironment (TME), rendering an immunologically "cold" tumor "hot." Comprehensive characterization of the TME after ATG-101 treatment using single-cell RNA sequencing further revealed an altered immune landscape that reflected increased antitumor immunity. ATG-101 was well tolerated and did not induce hepatotoxicity in non-human primates. According to computational semimechanistic pharmacology modeling, 4-1BB/ATG-101/PD-L1 trimer formation and PD-L1 receptor occupancy were both maximized at around 2 mg/kg of ATG-101, providing guidance regarding the optimal biological dose for clinical trials. In summary, by localizing to PD-L1-rich microenvironments and activating 4-1BB+ immune cells in a PD-L1 cross-linking-dependent manner, ATG-101 safely inhibits growth of ICI resistant and refractory tumors.

Significance: The tetravalent PD-L1×4-1BB bispecific antibody ATG-101 activates 4-1BB+ T cells in a PD-L1 cross-linking-dependent manner, minimizing the hepatotoxicity of existing 4-1BB agonists and suppressing growth of ICI-resistant tumors. See related commentary by Ha et al., p. 1546.


Figures

Figure 1. ATG-101 binds to hPD‐L1 and h4-1BB simultaneously. A, Structure of ATG-101 BsAb. ATG-101 employs the IgG(H)-scFv structure, with the Fab arm targeting PD-L1 and the scFv targeting 4-1BB linked to the C-terminus of the FC domain. DS, disulphide bond. B, Binding capability of ATG-101 to hPD-L1/h4-1BB as determined by ForteBio. ATG-101 was immobilized on the biosensor, and the h4-1BB Fc (left) or hPD-L1 Fc (right) protein was injected first to bind ATG-101, whereafter hPD-L1 Fc (left) or h4-1BB Fc (right) protein was injected to bind. IgG-Fc was used as negative control. C, Kinetics parameter of binding affinity of ATG-101 to hPD-L1/h4-1BB. Kon, association rate constant; Koff, dissociation rate constant; Kd, dissociation constant, Kd = Koff/Kon. D, Binding of ATG-101 to 293T-hPDL1 (left) or 293T-h41BB (right). E, Blockade of the binding of biotinylated PD-1 protein to PD-L1 over expressed HEK293T cells by ATG-101 or parental PDL1 Ab. In D and E, n = 3, data representative of three independent experiments. F, Summary of binding affinity of ATG-101 to Fcγ receptor and FcRn as determined by ForteBio. ND, not detected. G, Binding of ATG-101 and human IgG1 control antibody to human monocytes and NK92MI-FcγRIIIA cells detected by flow cytometry. Representative of n = 3.
Figure 1.
ATG-101 binds to hPD‐L1 and h4-1BB simultaneously. A, Structure of ATG-101 BsAb. ATG-101 employs the IgG(H)-scFv structure, with the Fab arm targeting PD-L1 and the scFv targeting 4-1BB linked to the C-terminus of the FC domain. DS, disulphide bond. B, Binding capability of ATG-101 to hPD-L1/h4-1BB as determined by ForteBio. ATG-101 was immobilized on the biosensor, and the h4-1BB Fc (left) or hPD-L1 Fc (right) protein was injected first to bind ATG-101, whereafter hPD-L1 Fc (left) or h4-1BB Fc (right) protein was injected to bind. IgG-Fc was used as negative control. C, Kinetics parameter of binding affinity of ATG-101 to hPD-L1/h4-1BB. Kon, association rate constant; Koff, dissociation rate constant; Kd, dissociation constant, Kd = Koff/Kon. D, Binding of ATG-101 to 293T-hPDL1 (left) or 293T-h41BB (right). E, Blockade of the binding of biotinylated PD-1 protein to PD-L1 over expressed HEK293T cells by ATG-101 or parental PDL1 Ab. In D and E, n = 3, data representative of three independent experiments. F, Summary of binding affinity of ATG-101 to Fcγ receptor and FcRn as determined by ForteBio. ND, not detected. G, Binding of ATG-101 and human IgG1 control antibody to human monocytes and NK92MI-FcγRIIIA cells detected by flow cytometry. Representative of n = 3.
Figure 2. ATG-101 activates 4-1BB signaling upon PD-L1 cross-linking. A and B, The 4-1BB agonistic activity of ATG-101 in NFκB luciferase assay. A, 293T-h41BB-NFκB-Luc cells were incubated with ATG-101 and CHO-hPDL1 (left) or CHO-mPDL1 (right) for 24 hours. Wild-type CHO cells as negative control. B, 4-1BB activation by ATG-101, bivalent PD-L1×4-1BB bsAb [ATG-101(1+1)], or isotype control antibodies in 293T-h41BB-NFκB-Luc cells with the presence of 293T-hPDL1. Tetravalent and bivalent ATG-101 activated 4-1BB signal pathway with EC50 of 5.25 nmol/L and 15.44 nmol/L, respectively. C, Effect of ATG-101 on IL2 release by CD8+ T cells with the presence of PD-L1+ cell lines. PD-L1 densities (total antibody binding sites) on MCF7, RKO, NCI-H358, and 293T-hPDL1 cell surfaces were determined using QIFIKIT (left). All the indicated cells cocultured with CD8+ T cells and ATG-101 for 3 days, and supernatants were harvested for IL2 ELISA to assess T-cell activation (right). D, ATG-101–induced IFNγ release by human primary CD8+ T cells coculturing with varying proportions of PD-L1+ cells. HEK293-PDL1 cells were mixed with parental HEK293 at different proportions. The IFNγ release was detected by ELISA. E, The individual and mean expression pattern of surface markers and cytokine release of CD3+ T cells from three healthy donors through six rounds of CD3/CD28 activation. F, Individual and mean IL2, IFNγ, and TNFα production by T cells after six rounds of activation (from E), in response to ATG-101, parental PD-L1 antibody, parental 4-1BB antibody, or isotype control. In A, C, and D, data representative of three independent experiments. In A, B, C, and F, data are presented as means ± SEM. Statistical analysis used two-way ANOVA in C and one-way ANOVA in F. *, P < 0.05; **, P < 0.01; ***, P < 0.001; ****, P < 0.0001.
Figure 2.
ATG-101 activates 4-1BB signaling upon PD-L1 cross-linking. A and B, The 4-1BB agonistic activity of ATG-101 in NFκB luciferase assay. A, 293T-h41BB-NFκB-Luc cells were incubated with ATG-101 and CHO-hPDL1 (left) or CHO-mPDL1 (right) for 24 hours. Wild-type CHO cells as negative control. B, 4-1BB activation by ATG-101, bivalent PD-L1×4-1BB bsAb [ATG-101(1+1)], or isotype control antibodies in 293T-h41BB-NFκB-Luc cells with the presence of 293T-hPDL1. Tetravalent and bivalent ATG-101 activated 4-1BB signal pathway with EC50 of 5.25 nmol/L and 15.44 nmol/L, respectively. C, Effect of ATG-101 on IL2 release by CD8+ T cells with the presence of PD-L1+ cell lines. PD-L1 densities (total antibody binding sites) on MCF7, RKO, NCI-H358, and 293T-hPDL1 cell surfaces were determined using QIFIKIT (left). All the indicated cells cocultured with CD8+ T cells and ATG-101 for 3 days, and supernatants were harvested for IL2 ELISA to assess T-cell activation (right). D, ATG-101–induced IFNγ release by human primary CD8+ T cells coculturing with varying proportions of PD-L1+ cells. HEK293-PDL1 cells were mixed with parental HEK293 at different proportions. The IFNγ release was detected by ELISA. E, The individual and mean expression pattern of surface markers and cytokine release of CD3+ T cells from three healthy donors through six rounds of CD3/CD28 activation. F, Individual and mean IL2, IFNγ, and TNFα production by T cells after six rounds of activation (from E), in response to ATG-101, parental PD-L1 antibody, parental 4-1BB antibody, or isotype control. In A, C, and D, data representative of three independent experiments. In A, B, C, and F, data are presented as means ± SEM. Statistical analysis used two-way ANOVA in C and one-way ANOVA in F. *, P < 0.05; **, P < 0.01; ***, P < 0.001; ****, P < 0.0001.
Figure 3. ATG-101 shows antitumor efficacy in vivo. A–D, MC38 colon cancer xenograft model on h4-1BB KI mice (C57BL/6). A, When the TV reached about 60 mm3 (day 0), the mice were treated with indicated antibody twice a week for 2 weeks (n = 5 for PBS; n = 6 for the others). B and C, In another MC38 xenograft model, when the TV reached about 239 mm3, the mice were grouped and treated with indicated antibody twice a week for 2 weeks (n = 5 for PBS; n = 6 for the other groups). Growth curves of MC38 tumor (B) and Kaplan–Meier survival plot of mice (C). D, Tumor-free mice from B were rechallenged with MC38. ATG-101 cured (n = 2) or naïve mice (n = 3). E, and F, B16F10 melanoma model or Pan02 pancreatic tumor model on h4-1BB KI mice. The mice were intraperitoneally injected with tested articles once every 3 days (n = 8). In A, B, D, E, and F, means ± SEM are shown. Statistical analysis used two-way ANOVA for tumor growth comparison and log-rank test (Mantel–Cox) for survival analysis. *, P < 0.05; **, P < 0.01; ***, P < 0.001; ****, P < 0.0001. In the tumor growth curves, only P values on the last day were shown except for B16F10 whose P value on day 10 is shown.
Figure 3.
ATG-101 shows antitumor efficacy in vivo. A–D, MC38 colon cancer xenograft model on h4-1BB KI mice (C57BL/6). A, When the TV reached about 60 mm3 (day 0), the mice were treated with indicated antibody twice a week for 2 weeks (n = 5 for PBS; n = 6 for the others). B and C, In another MC38 xenograft model, when the TV reached about 239 mm3, the mice were grouped and treated with indicated antibody twice a week for 2 weeks (n = 5 for PBS; n = 6 for the other groups). Growth curves of MC38 tumor (B) and Kaplan–Meier survival plot of mice (C). D, Tumor-free mice from B were rechallenged with MC38. ATG-101 cured (n = 2) or naïve mice (n = 3). E, and F, B16F10 melanoma model or Pan02 pancreatic tumor model on h4-1BB KI mice. The mice were intraperitoneally injected with tested articles once every 3 days (n = 8). In A, B, D, E, and F, means ± SEM are shown. Statistical analysis used two-way ANOVA for tumor growth comparison and log-rank test (Mantel–Cox) for survival analysis. *, P < 0.05; **, P < 0.01; ***, P < 0.001; ****, P < 0.0001. In the tumor growth curves, only P values on the last day were shown except for B16F10 whose P value on day 10 is shown.
Figure 4. ATG-101 enhances the antitumor immunity in the TME. A, Growth curves of MC38-hPD-L1 colon tumors treated with IgG or ATG-101 on day 0 and day 4, as indicated by arrow. B, Normalized CD8+ T-cell and Treg number in tumor, liver, blood, and spleen from A. Forty-eight hours after the last administration, the samples were collected. Fold change indicates ATG-101 treatment group versus mean value of IgG control group. C, Growth curves of EL4 T-cell lymphoma. When the tumor size reached about 71 mm3, the mice (n = 8) were grouped and treated with PBS, IgG, or ATG-101. D, Normalized TIL analysis results from tumors from C. The makers used to classify the cell subsets in flow cytometry analysis are summarized in Supplementary Table S2. Fold change indicates IgG or ATG-101 treatment group versus mean valve of PBS group. Means ± SEM are shown. *, P < 0.05; **, P < 0.01; ***, P < 0.001; ****, P < 0.0001 by two-way ANOVA. In the tumor growth curves, only P values on the last day are shown.
Figure 4.
ATG-101 enhances the antitumor immunity in the TME. A, Growth curves of MC38-hPD-L1 colon tumors treated with IgG or ATG-101 on day 0 and day 4, as indicated by arrow. B, Normalized CD8+ T-cell and Treg number in tumor, liver, blood, and spleen from A. Forty-eight hours after the last administration, the samples were collected. Fold change indicates ATG-101 treatment group versus mean value of IgG control group. C, Growth curves of EL4 T-cell lymphoma. When the tumor size reached about 71 mm3, the mice (n = 8) were grouped and treated with PBS, IgG, or ATG-101. D, Normalized TIL analysis results from tumors from C. The makers used to classify the cell subsets in flow cytometry analysis are summarized in Supplementary Table S2. Fold change indicates IgG or ATG-101 treatment group versus mean valve of PBS group. Means ± SEM are shown. *, P < 0.05; **, P < 0.01; ***, P < 0.001; ****, P < 0.0001 by two-way ANOVA. In the tumor growth curves, only P values on the last day are shown.
Figure 5. ATG-101 demonstrates in vivo efficacy in MC38 tumor model progressing on anti-PD-L1 treatment, enhancing the antitumor immunity in the TME. A, Representative individual MC38 tumor growth curve. The mice were treated with PBS (black), 10 mg/kg atezolizumab only (red), or mice initially treated with 10 mg/kg atezolizumab and switched to 13 mg/kg ATG-101 upon disease progression (red to blue). Arrow, the day switching atezolizumab to ATG-101. B, Individual tumor growth spaghetti plots of mice treated with PBS (black; n = 6), atezolizumab only (red; n = 14), and atezolizumab to ATG-101 (red-blue; n = 14). C, Survival data of mouse shown in B. ****, P < 0.0001 by log-rank (Mantel–Cox) test. D, Representative images of multiplex IHC staining of tumor samples collected from mouse from B. The tumor slices were stained for CD4 (Th cell; red), CD8 (effector T cell; purple), Foxp3 (Treg; green), and PD-L1 (cancer cells; dark orange). Nucleus was labeled with DAPI (blue). Insets in the merged images are enlarged. Scale bars, 50 μm. E, Quantitative analysis of cell density of infiltrated immune cell in D. Statistical analysis used one-way ANOVA. *, P < 0.05. Means ± SEM are shown. n = 3 in PBS and atezolizumab group; n = 6 in ATG-101 group.
Figure 5.
ATG-101 demonstrates in vivo efficacy in MC38 tumor model progressing on anti-PD-L1 treatment, enhancing the antitumor immunity in the TME. A, Representative individual MC38 tumor growth curve. The mice were treated with PBS (black), 10 mg/kg atezolizumab only (red), or mice initially treated with 10 mg/kg atezolizumab and switched to 13 mg/kg ATG-101 upon disease progression (red to blue). Arrow, the day switching atezolizumab to ATG-101. B, Individual tumor growth spaghetti plots of mice treated with PBS (black; n = 6), atezolizumab only (red; n = 14), and atezolizumab to ATG-101 (red-blue; n = 14). C, Survival data of mouse shown in B. ****, P < 0.0001 by log-rank (Mantel–Cox) test. D, Representative images of multiplex IHC staining of tumor samples collected from mouse from B. The tumor slices were stained for CD4 (Th cell; red), CD8 (effector T cell; purple), Foxp3 (Treg; green), and PD-L1 (cancer cells; dark orange). Nucleus was labeled with DAPI (blue). Insets in the merged images are enlarged. Scale bars, 50 μm. E, Quantitative analysis of cell density of infiltrated immune cell in D. Statistical analysis used one-way ANOVA. *, P < 0.05. Means ± SEM are shown. n = 3 in PBS and atezolizumab group; n = 6 in ATG-101 group.
Figure 6. Single-cell transcriptomic analysis of TILs of IgG or ATG-101–treated MC38 tumors. A, Scheme of the study. B, The two-dimensional UMAP embedding plot of all TILs labeled by treatment groups. C, The two-dimensional UMAP embedding plot of 11 identified main cell types in TILs. The relative proportions of each cell type across two different treatment groups are calculated and shown below. D, The two-dimensional UMAP embedding plot of T cells colored by T-cell subtypes. The relative proportions of each subtype across two different treatment groups are calculated and shown below. E, Dot plot of key genes in T-cell subtypes across two treatment groups. F, Scatter plots showing cytotoxicity score and 4-1BB expression of T cells, projecting on the UMAP plot. Cytotoxicity score was calculated on the basis of the expression of Gzma, Gzmb, Gzmk, Prf1, Nkg7, Ifng, and Il2. G, The two-dimensional UMAP embedding plot of DCs colored by DC subtypes. The relative proportions of each subtype across two different treatment groups are calculated and shown below. H, Dot plot of key genes in DC across two treatment groups. I, Scatter plots showing expression of PD-L1 in DCs, projecting on the UMAP plot. J, Dot plots of significant interactions between DC and T cells detected by Cellphone DB. Dark blue, significant interactions specifically detected in G1; light blue, significant interactions detected in both G1 and G2, while expression of interaction pairs decreased in G2; light red, significant interactions detected in both G1 and G2, while expression of interaction pairs increased in G2; dark red, significant interactions specifically detected in G2. K, Predicted mechanism of ATG-101.
Figure 6.
Single-cell transcriptomic analysis of TILs of IgG or ATG-101–treated MC38 tumors. A, Scheme of the study. B, The two-dimensional UMAP embedding plot of all TILs labeled by treatment groups. C, The two-dimensional UMAP embedding plot of 11 identified main cell types in TILs. The relative proportions of each cell type across two different treatment groups are calculated and shown below. D, The two-dimensional UMAP embedding plot of T cells colored by T-cell subtypes. The relative proportions of each subtype across two different treatment groups are calculated and shown below. E, Dot plot of key genes in T-cell subtypes across two treatment groups. F, Scatter plots showing cytotoxicity score and 4-1BB expression of T cells, projecting on the UMAP plot. Cytotoxicity score was calculated on the basis of the expression of Gzma, Gzmb, Gzmk, Prf1, Nkg7, Ifng, and Il2. G, The two-dimensional UMAP embedding plot of DCs colored by DC subtypes. The relative proportions of each subtype across two different treatment groups are calculated and shown below. H, Dot plot of key genes in DC across two treatment groups. I, Scatter plots showing expression of PD-L1 in DCs, projecting on the UMAP plot. J, Dot plots of significant interactions between DC and T cells detected by Cellphone DB. Dark blue, significant interactions specifically detected in G1; light blue, significant interactions detected in both G1 and G2, while expression of interaction pairs decreased in G2; light red, significant interactions detected in both G1 and G2, while expression of interaction pairs increased in G2; dark red, significant interactions specifically detected in G2. K, Predicted mechanism of ATG-101.
Figure 7. ATG-101 demonstrated good safety profile. A and B, Mean serum concentrations of AST (A) and ALT (B) of cynomolgus monkeys over the study period at the indicated doses. C, Representative images of hematoxylin and eosin staining of liver tissue collected from the animals in the study. D, PD-L1 RO on CD3+ T cells over the study period at the indicated doses. AF647-labeled parental anti-PD-L1 antibody was employed to assist in the measurement of the ratio of free receptor. Median is shown in the figure (n = 10 per group, 5 female mice and 5 male mice.). E, Concentrations of IL2 and IL6 of cynomolgus monkeys in the study over the study period at the indicated doses. Means ± SEM are shown.
Figure 7.
ATG-101 demonstrated good safety profile. A and B, Mean serum concentrations of AST (A) and ALT (B) of cynomolgus monkeys over the study period at the indicated doses. C, Representative images of hematoxylin and eosin staining of liver tissue collected from the animals in the study. D, PD-L1 RO on CD3+ T cells over the study period at the indicated doses. AF647-labeled parental anti-PD-L1 antibody was employed to assist in the measurement of the ratio of free receptor. Median is shown in the figure (n = 10 per group, 5 female mice and 5 male mice.). E, Concentrations of IL2 and IL6 of cynomolgus monkeys in the study over the study period at the indicated doses. Means ± SEM are shown.
Figure 8. Semimechanistic pharmacology model of ATG-101. A, In vitro model diagram. The model has three compartments: a central compartment, representing the circulation; a tumor compartment; and a peripheral compartment, representing other tissues into which the drug distributes. Drug binds to either receptor initially, then cross-link to the other. Trans-cell complexes (i.e., trimers) are assumed to drive the pharmacologic activity of ATG-101. B, In vitro model calibration and validation. Two cross-linking rates (“strong avidity” and “weak avidity” lines) were calibrated to capture the uncertainty in the parameter (calibration; left). The model was validated with PD-1/PD-L1 blocking assays (validation; right). Lines show model predictions and points show data values for CHO cells expressing hPD-L1 and mPD-L1. C, In vivo human solid tumor model predictions. The in vivo human solid tumor patient model was used to simulate five doses administered every 3 weeks at levels from 0.001 to 10 mg/kg and predict circulating free drug levels, tumor trimer formation, and tumor PD-L1 RO over time. The cross-linking rate and PD-L1 per tumor cell were varied to include the effects of parameter uncertainty and variability in the predictions. D–F, Human model simulated trimer versus PD-L1 RO. D, Schematic representing the pharmacologic regimes between trimer formation and RO of PD-L1. E, Simulations of trimer formation versus PD-L1 RO in high versus low PD-L1 density and high versus low cross-linking avidity for ATG-101 at once every 3 weeks. F, As in the previous panel, the x-axis indicates the tumor cell PD-L1 RO at trough. The y-axis indicates the number of trimers per tumor-infiltrating T cell at trough. Points indicate select doses, with text indicating the dose level in mg/kg outside the parentheses and mg inside the parentheses. Panels indicate the dosing frequency. G, NFκB signaling assays of tetravalent ATG-101 and bivalent ATG-101 in 4-1BB activation. H, Schematic outlining the features of the optimal dose of ATG-101. There is a “sweet spot” between trimer formulation, PD-L1 RO, and BsAb safety. OBD, optimal biological dose.
Figure 8.
Semimechanistic pharmacology model of ATG-101. A,In vitro model diagram. The model has three compartments: a central compartment, representing the circulation; a tumor compartment; and a peripheral compartment, representing other tissues into which the drug distributes. Drug binds to either receptor initially, then cross-link to the other. Trans-cell complexes (i.e., trimers) are assumed to drive the pharmacologic activity of ATG-101. B,In vitro model calibration and validation. Two cross-linking rates (“strong avidity” and “weak avidity” lines) were calibrated to capture the uncertainty in the parameter (calibration; left). The model was validated with PD-1/PD-L1 blocking assays (validation; right). Lines show model predictions and points show data values for CHO cells expressing hPD-L1 and mPD-L1. C,In vivo human solid tumor model predictions. The in vivo human solid tumor patient model was used to simulate five doses administered every 3 weeks at levels from 0.001 to 10 mg/kg and predict circulating free drug levels, tumor trimer formation, and tumor PD-L1 RO over time. The cross-linking rate and PD-L1 per tumor cell were varied to include the effects of parameter uncertainty and variability in the predictions. D–F, Human model simulated trimer versus PD-L1 RO. D, Schematic representing the pharmacologic regimes between trimer formation and RO of PD-L1. E, Simulations of trimer formation versus PD-L1 RO in high versus low PD-L1 density and high versus low cross-linking avidity for ATG-101 at once every 3 weeks. F, As in the previous panel, the x-axis indicates the tumor cell PD-L1 RO at trough. The y-axis indicates the number of trimers per tumor-infiltrating T cell at trough. Points indicate select doses, with text indicating the dose level in mg/kg outside the parentheses and mg inside the parentheses. Panels indicate the dosing frequency. G, NFκB signaling assays of tetravalent ATG-101 and bivalent ATG-101 in 4-1BB activation. H, Schematic outlining the features of the optimal dose of ATG-101. There is a “sweet spot” between trimer formulation, PD-L1 RO, and BsAb safety. OBD, optimal biological dose.

References

    1. Chen DS, Mellman I. Elements of cancer immunity and the cancer-immune set point. Nature 2017;541:321–30. - PubMed
    1. Pauken KE, Sammons MA, Odorizzi PM, Manne S, Godec J, Khan O, et al. . Epigenetic stability of exhausted T cells limits durability of reinvigoration by PD-1 blockade. Science 2016;354:1160–5. - PMC - PubMed
    1. Sarmento-Ribeiro AB, Scorilas A, Goncalves AC, Efferth T, Trougakos IP. The emergence of drug resistance to targeted cancer therapies: clinical evidence. Drug Resist Updat 2019;47:100646. - PubMed
    1. Sen DR, Kaminski J, Barnitz RA, Kurachi M, Gerdemann U, Yates KB, et al. . The epigenetic landscape of T cell exhaustion. Science 2016;354:1165–9. - PMC - PubMed
    1. Kim HD, Park S, Jeong S, Lee YJ, Lee H, Kim CG, et al. . 4–1BB delineates distinct activation status of exhausted tumor-infiltrating CD8(+) T cells in hepatocellular carcinoma. Hepatology 2020;71:955–71. - PMC - PubMed

MeSH terms