. 2024 Jun 1;35(6):696-718.
doi: 10.1681/ASN.0000000000000328. Epub 2024 Mar 19.

WWP2 Regulates Renal Fibrosis and the Metabolic Reprogramming of Profibrotic Myofibroblasts

Affiliations

WWP2 Regulates Renal Fibrosis and the Metabolic Reprogramming of Profibrotic Myofibroblasts

Huimei Chen et al. J Am Soc Nephrol. .

Abstract

Key Points:

  1. WWP2 expression is elevated in the tubulointerstitium of fibrotic kidneys and contributes to CKD pathogenesis and progression.

  2. WWP2 uncouples the profibrotic activation and cell proliferation in renal myofibroblasts.

  3. WWP2 controls mitochondrial respiration in renal myofibroblasts through the metabolic regulator peroxisome proliferator-activated receptor gamma coactivator 1-alpha.

Background: Renal fibrosis is a common pathologic end point in CKD that is challenging to reverse, and myofibroblasts are responsible for the accumulation of a fibrillar collagen–rich extracellular matrix. Recent studies have unveiled myofibroblasts' diversity in proliferative and fibrotic characteristics, which are linked to different metabolic states. We previously demonstrated the regulation of extracellular matrix genes and tissue fibrosis by WWP2, a multifunctional E3 ubiquitin–protein ligase. Here, we investigate WWP2 in renal fibrosis and in the metabolic reprograming of myofibroblasts in CKD.

Methods: We used kidney samples from patients with CKD and WWP2-null kidney disease mice models and leveraged single-cell RNA sequencing analysis to detail the cell-specific regulation of WWP2 in fibrotic kidneys. Experiments in primary cultured myofibroblasts by bulk-RNA sequencing, chromatin immunoprecipitation sequencing, metabolomics, and cellular metabolism assays were used to study the metabolic regulation of WWP2 and its downstream signaling.

Results: The tubulointerstitial expression of WWP2 was associated with fibrotic progression in patients with CKD and in murine kidney disease models. WWP2 deficiency promoted myofibroblast proliferation and halted profibrotic activation, reducing the severity of renal fibrosis in vivo. In renal myofibroblasts, WWP2 deficiency increased fatty acid oxidation and activated the pentose phosphate pathway, boosting mitochondrial respiration at the expense of glycolysis. WWP2 suppressed the transcription of peroxisome proliferator-activated receptor gamma coactivator 1-alpha (PGC-1α), a metabolic mediator of fibrotic response, and pharmacologic inhibition of PGC-1α partially abrogated the protective effects of WWP2 deficiency on myofibroblasts.

Conclusions: WWP2 regulates the metabolic reprogramming of profibrotic myofibroblasts by a WWP2-PGC-1α axis, and WWP2 deficiency protects against renal fibrosis in CKD.


Conflict of interest statement

J. Behmoaras and E. Petretto report employment with Duke-NUS Medical School. G. Chew reports employment with Ministry of Health Holdings, Singapore. L. Gesualdo reports consultancy for AstraZeneca, Chinook, GSK, Novartis, Roche, and Travere and research funding from Abionyx, AstraZeneca, and Sanofi. F. Pesce reports honoraria from AstraZeneca and GSK. P. Pontrelli reports employment with University of Bari Aldo Moro, patents or royalties from University of Bari Aldo Moro, and other interests or relationships with ERA and SIN. All remaining authors have nothing to disclose.

Figures

None
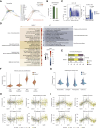
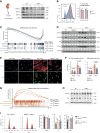
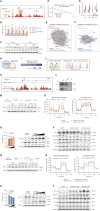
Graphical abstract
Figure 1
Figure 1
The tubulointerstitial WWP2 expression is positively associated with renal fibrosis in CKD patients and UUO mice. (A) Representative immunostaining images of WWP2 in tubulointerstitial area from human kidney biopsy samples, illustrating mild, moderate, and severe interstitial fibrosis, respectively (n=133 patients with CKD recorded, see Supplemental Table 1). Scale bars, 30 μm. (B) Representative fluorescence images of WWP2 in CKD kidney. Upper panels: double-immunofluorescence staining of WWP2 (green) and lotus tetragonolobus lectin (LTL) (red). Lower panels: double-immunofluorescence staining of WWP2 (green) and α-SMA (red). Nuclei were stained with DAPI. Scale bars, 50 μm. (C) Positive correlation between tubulointerstitial WWP2-positive area and fibrosis-positive area, as determined by immunostaining and Sirius red staining (see Supplemental Figure 1A) with ImageScope. Each data point represents a measurement of an individual section obtained from each patient with CKD (n=133). (D) The WWP2-positive tubulointerstitial area (%) in kidney biopsy samples increases as CKD progresses from stage 1–2 to stage 3–4, including kidney biopsy samples from patients with membranous nephropathy (n=11, P = 0.02), FSGS (n=12, P = 0.009), and IgA nephropathy (n=16, P = 0.02). P values calculated by the two-tailed Mann–Whitney U test. (E) Representative immunostaining images of WWP2 in tubulointerstitial kidneys from UUO and control mice (n=5–10 images recorded for each mouse kidney). Scale bars, 100 μm. (F) Representative fluorescence images of WWP2 in UUO kidney. Left panels: double-immunofluorescence staining of WWP2 (green) and LTL (red). Right panels: double-immunofluorescence staining of WWP2 (green) and α-SMA (red). Nuclei were stained with DAPI. Scale bars, 50 μm. (G) The expression of WWP2 in kidney tissue from UUO and control mice. Left: representative Western blotting for protein levels; right: mRNA expression changes were determined by RT-qPCR. n=6, each group, and values are reported and mean±SD. α-SMA, alpha-smooth-muscle actin; DAPI, 4′,6-diamidino-2-phenylindole; GAPDH, glyceraldehyde 3-phosphate dehydrogenase; RT, reverse transcription; UUO, unilateral ureteral obstruction.
Figure 2
Figure 2
WWP2 deficiency protects from renal fibrosis in vivo. (A) Representative images of WT and WWP2−/− mouse kidneys following UUO model for 14 days (n=8 images recorded for each condition). Top and middle panels: Sirius red staining for whole section and representative fibrotic area. Scale bars, 50 μm. Bottom panels: representative images of Masson's trichrome staining for representative fibrotic area. Scale bars, 20 μm. (B) Quantitative analysis of cortical fibrosis–positive area (left, %) and HPA collagen levels (right, μg/mg) WT and WWP2−/− mouse kidneys following UUO model for 14 days (n=6–10, in each experimental group). (C) Representative Western blot for ECM proteins in UUO kidney tissue from WT and WWP2−/− mouse kidneys following UUO model for 14 days. (D) Expression of ECM genes, determined by RT-qPCR, in kidney from WT and WWP2−/− mouse following UUO model for 14 days (n=6, in each group). (E) Representative images of folic acid–induced fibrotic kidneys at day 21 in WT and WWP2−/− mice (n=6 images recorded for each condition). Top panel: Sirius red staining for representative fibrotic area. Scale bars, 50 μm. Bottom panel: representative images of Masson's trichrome staining for representative fibrotic area. Scale bars, 20 μm. The folic acid-induced fibrotic kidney model is abbreviated as FA. (F) Quantitative analysis of cortical fibrosis-positive area (%) and HPA collagen levels (μg/mg) in folic acid–induced fibrotic kidneys in WT and WWP2−/− mice (n=5–12, in each experimental group). (G) Representative Western blot for ECM proteins in folic acid–induced fibrotic kidneys from WT and WWP2−/− mice. (H) Kidney function in the folic acid model as assessed by the level of plasma creatinine (mg/dl) and BUN (mg/dl) in both WT and WWP2−/− mice (n=8 per experimental group). In each case, data values are reported as mean±SD, and P values were calculated by the two-tailed Mann–Whitney U test. NS, P > 0.1; *P < 0.05; **P < 0.01. ECM, extracellular matrix; FA, fatty acid; HPA, hydroxyproline assay; NS, not significant; WT, wild type.
Figure 3
Figure 3
WWP2 mediates myofibroblasts phenotypes in fibrotic kidneys. (A) Diffusion map embedding of single cells data from UUO kidneys (left), and relative expression of ECM genes over imposed on the same embedding (right). Compared with other cell types, two myofibroblasts clusters (C7 and C8) presented high expression scores of ECM genes, quantified by a composite “ECM score” (see Methods). (B) Bar plots showing the percentage of myofibroblasts derived from UUO kidneys in WT and WWP2−/− mice. Myofibroblasts percentage was calculated with respect to all renal cells, and P value was calculated by the chi-squared test (df=1) for cell proportions. (C) Left: representative graph of ACTA2+ cells in WT mouse using flow cytometry in renal living cells from UUO kidney (14 days). Right: quantification of ACTA2+ cells in kidney cells from WT and WWP2−/− mice (n=5, from three independent experiments). Values are reported as mean±SD, and P values were calculated by the two-tailed Mann–Whitney U test. (D) Classification of reactome pathways enriched in ECM-expressing myofibroblasts and significantly different between WT and WWP2−/− UUO kidneys by GSEA (FDR <0.05). NES, where a positive NES indicates upregulation in WWP2−/− compared with WT myofibroblasts. (E) Proportions of ECM-expressing myofibroblasts at different phases of the cell cycle, grouped as G0/G1, S, and G2/M phases. ECM-expressing myofibroblasts from UUO kidneys are grouped according to WT and WWP2−/− genotypes. P value was calculated by the chi-squared test for cell number in G0/G1, S, and G2/M phases, yielding χ2=11.89, df=2, P value = 0.003. (F and G) Expression score for hallmark gene sets for proliferation (F) and ECM production genes (G) in ECM-expressing myofibroblasts from UUO fibrotic kidneys. See Methods for definition of gene sets and score calculation. For each gene set, difference in expression score between WT and WWP2−/− groups was tested using the nonparametric Wilcoxon rank-sum test; for each given gene set, the P value for the difference was < 0.001. (H and I) Using the Revelio algorithm (see Methods), myofibroblast cells derived from five human CKD kidneys are arranged along a pseudotime trajectory based on to their cell cycle phases and grouped as G0/G1, S, and G2/M. The distribution of hallmark gene set scores for proliferation (H) and ECM production (I) is shown for each myofibroblast arranged accordingly to its cell cycle phase, and the main trend is approximated by smooth line interpolation (bold black line). For each gene set, P values for significance of change in the linear trend (bold black line) were calculated by local regression-based WAVK test (see Methods for additional details). FDR, false discovery rate; GSEA, gene set enrichment analysis, NES, normalized enrichment score.
Figure 4
Figure 4
WWP2 deficiency promotes cellular proliferation and supresses profibrotic activation in renal myofibroblasts in vitro. (A) Representative Western blot showing the levels of WWP2 in primary cultured renal myofibroblasts (P2) derived from WT and WWP2−/− kidneys. WWP2−/− cells lack WWP2 full-length and -N isoforms expression. (B) Left: representative graph of ACTA2+ cells in cultured renal myofibroblasts (P2) derived from WT and WWP2−/− mice using flow cytometry. Right: quantification of ACTA2+ cells in cultured myofibroblasts derived from WT and WWP2−/− kidneys (n=6, from three independent experiments). Values are reported as mean±SD. TGFβ1 (5 ng/μl) for 72 hours. (C) GSEA of ECM pathways in cultured renal myofibroblasts, treated with TGFβ1 (5 ng/μl) for 72 hours, showing the enrichment score for ECM gene sets in WWP2−/− (x axis, left) and WT kidneys (x axis, right). NES, where negative values indicate downregulation of the gene set in WWP2−/− myofibroblasts with respect to WT myofibroblasts. (D) Representative Western blotting for ECM proteins in cultured TGFβ1-treated myofibroblasts (P2) derived from WT and WWP2−/− kidneys. TGFβ1 (5 ng/μl) for 72 hours. (E and F) Representative microscopy images (E) and quantification analysis (F) with immunostaining for ACTA2 and VIM in cultured renal TGFβ1-treated myofibroblasts derived from WT and WWP2−/− kidneys (n=5 independent experiments). One single dot indicates the average of 25–40 myofibroblasts taken from each slide. Values are reported as mean±SD. TGFβ1 (5 ng/μl) for 72 hours. (G) Similar to the data in (C), GSEA of proliferation pathways in cultured renal myofibroblasts (P2) treated with TGFβ1 (5 ng/μl) for 72 hours. Enrichment score comparing WWP2−/− and WT myofibroblasts. Positive NES values indicate upregulation in WWP2−/− myofibroblasts with respect to WT myofibroblasts. (H) Representative Western blotting for cyclin A and P21 in cultured TGFβ1-treated renal myofibroblasts (P2) derived from WT and WWP2−/− kidneys. TGFβ1 (5 ng/μl) for 24 hours. (I) Left: representative graph of cell cycle in cultured TGFβ1-treated renal myofibroblasts (P2) derived from WT and WWP2−/− mice using flow cytometry. Right: quantification of cell cycle at G0/G1, S, and G2/M phases in cultured myofibroblasts derived from WT and WWP2−/− kidneys (n=6, from three independent experiments). TGFβ1 (5 ng/μl) for 24 hours. Values are reported as mean±SD. *P < 0.05; **P < 0.01.
Figure 5
Figure 5
Differential energy metabolism of WT and WWP2−/− myofibroblasts. (A) Compass score differential activity test in ECM-expressing myofibroblasts derived from WT and WWP2−/− UUO kidneys, for reactions in the glycolysis, TCA cycle, fatty acid oxidation, and amino acid metabolism pathways. Statistical significance (y axis) for the difference in the activities scores of metabolic resections between WWP2−/− and WT group was assessed by the nonparametric Wilcoxon rank-sum test, while the effect size was estimated by Cohen's D (x axis). The whole set of metabolic reactions changes in myofibroblasts are in Supplemental Figure 6A. (B) WWP2 mRNA expression is negatively associated with activity of metabolic resections in renal myofibroblasts from five human CKD patients' kidneys. Upper panel: significant Spearman correlations (P < 0.05) between compass scores of metabolic resections and the expression level of WWP2 in renal myofibroblasts. The color coding represents different metabolic pathways of the metabolic reactions. Lower panels: detail on the correlation between WWP2 expression and activity of four key metabolic reactions. The data for whole set of metabolic reactions is showed in Supplemental Figure 6B. (C) Metabolomics analysis shows the profile of metabolites exhibiting significant differences (P < 0.05, FDR <17%, two-tailed nonparametric Mann–Whitney U test) between cultured TGFβ1-treated (5 ng/μl for 72 hours) renal myofibroblasts (P2) derived from WT and WWP2−/− kidneys. Each metabolite level was normalized and represented as Z-score. (D) Simplified overview of central metabolic fluxes in glycolysis, TCA cycle, fatty acid oxidation, and amino acid metabolism in cultured renal myofibroblasts derived from WT and WWP2−/− kidneys. Color indicates the relative metabolite or enzyme rates in WWP2−/− myofibroblasts compared with WT cells, where red indicates higher flux in WWP2−/− myofibroblasts and blue indicates higher flux in WT cells. (E) Coordinated regulation of metabolites associated with WWP2 deficiency. Metabolite–metabolite correlation analysis of differential metabolites (reported in C). Positive correlations are depicted in orange, while negative correlations are represented in green. Metabolites that exhibit a high degree of correlation are highlighted (blue rectangles). (F) Upper panel: representative Seahorse Mito stress assays for the OCR in cultured TGFβ1-treated (5 ng/μl for 72 hours) renal myofibroblasts derived from WT and WWP2−/− kidneys. Lower panel: barplots summarizing the phenotypes derived from OCR analysis. n=3 independent experiments, each containing readouts from 3 to 4 microplate wells (technical replicates). (G) Upper panel: representative Seahorse Glycolysis assays for the ECAR in cultured renal myofibroblasts derived from WT and WWP2−/− kidneys. Lower panel: barplots summarizing the phenotypes derived from ECAR analysis. n=3 independent experiments, each containing readouts from 3 to 4 microplate wells (technical replicates). (H) Visualization (upper panels) and quantification (lower panels) of neutral lipids by oil red O analysis in cultured TGFβ1-treated (5 ng/μl for 72 hours) renal myofibroblasts derived from WT and WWP2−/− kidneys. Scale bars, 50 μm. (n=5 independent experiments.) Data values are reported as mean±SD. P values were calculated by two-tailed Mann–Whitney U test. *P < 0.05; **P < 0.01. α-KG, α-ketoglutarate; 2PG, 2-phosphoglycerate; BPG, bisphosphoglycerate or 2,3-bisphosphoglycerate; DHAP, dihydroxyacetone phosphate; ECAR, extracellular acidification rate; EMP, Embden-Meyerhof-Parnas pathway of glycolysis; FBP, fructose-1,6-bisphosphate; G6P, glucose-6-phosphate; Glu, glutamic acid; LCAC, long chain of acylcarnitine; MCAC, medium chain of acylcarnitine; OCR, oxygen consumption rate; PEP, phosphoenolpyruvate; PPP, pentose phosphate pathway; R5P, ribose-5-phosphate; S7P, sedoheptulose-7-phosphate; SCAC, small chain of acylcarnitine.
Figure 6
Figure 6
WWP2 targets TWIST1 and regulates PGC-1α–mediated mitochondrial respiratory function. (A) Distribution of WWP2 ChIP-seq signal (red) at the Ppargc1a locus in primary WT myofibroblasts after TGFβ1 stimulation (5 ng/μl, 72 hours). The primers designed for ChIP-qPCR (gray boxes, I–VI) and the reference Ppargc1a gene (blue) are indicated. Genomics regions I–III contain WWP2-binding signals (ChIP-Seq peaks, in red), which overlap with known DNA-binding elements (light yellow boxes) identified from the REMAP DB; regions IV–VI serve as controls (i.e., no DNA-binding elements). (B) ChIP-qPCR analysis shows increased binding of WWP2 complex at Ppargc1a genomic regions I, II, and III after TGFβ1 stimulation, which overlap with predicted DNA-binding elements. Each bar shows WWP2 enrichment normalized to input and the ChIP-IgG control. Values are reported as mean±SD (n=3, independent experiments). P values were calculated by two-tailed Mann–Whitney U test. *P < 0.05; **P < 0.01; ns, P > 0.05. (C) Representative Western blot for PGC-1α in cultured renal myofibroblasts derived from WT and WWP2−/− kidneys. TGFβ1 stimulation (5 ng/μl) for 24 hours. (D) Genome-wide distribution of genes sorted based on their Pearson correlation with PGC-1α expression in myofibroblasts derived from fibrotic mouse kidneys. The color scale represents the fold change (log2FC) in expression between WWP2−/− myofibroblasts compared with WT cells. The red rectangle includes genes positively related to PGC-1α (r>0.5, P < 0.001) and which are upregulated in WWP2−/− myofibroblasts compared with WT cells; the genes in the blue rectangle are negatively related to PGC-1α (r<−0.5, P < 0.001) and downregulated in WWP2−/− myofibroblasts. (E and F) Subset of network genes from those highlighted in the red (D) and blue (E) rectangles in (C), which are correlated with PGC-1α (|r|>0.6). PGC-1α-network genes are further clustered in four distinct modules (M1–M4), positively (M1–M2) and negatively (M3–M4) correlated with PGC-1α, respectively (see Methods for details). Within each network, edges represent positive coexpression relationships between genes, and colors indicate functional clustering of the module genes, highlighting the cell proliferation (M1) and mitochondrial metabolism (M2) (D), and processes related to fibrous protein synthesis (M3 and M4, E). The genes highlighted are more strongly correlated positively (r>0.8, E) or negatively (r<−0.8, F) with PGC-1α expression, respectively, in myofibroblasts for fibrotic mouse kidneys. (G) For each module (M1–M4, see E and F), violin plot shows the distribution of normalized gene expression levels derived from bulk-RNA seq analysis of cultured WT and WWP2−/− myofibroblasts treated with TGFβ1 (5 ng/μl, 72 hours). For each module, P value for the difference between WT and WWP2−/− myofibroblasts was < 0.001, which was calculated by the two-tailed Wilcoxon rank-sum test. (H) Venn diagram showing the overlapping transcriptional factors identified by CHIP-seq motif analysis by RSATs (Supplemental Table 2) and scRNA-seq regulon analysis by pySCENIC analyses (Supplemental Table 4). (I) The difference in expression score of each regulon between WWP2−/− and WT myofibroblasts. The TWIST1 regulon showed the largest and most significant expression score difference between WWP2−/− and WT myofibroblasts. (J) DNA-binding sequence motif of TWIST1 (left panel), and correlation between WWP2-binding signaling (blue) and TWIST-binding probability (red) (right panel). (K) Distribution of WWP2 ChIP-seq signal (red) at the Ppargc1a locus in primary WT myofibroblasts after TGFβ1 stimulation (5 ng/μl, 72 hours). The location of TWIST1-binding sequence motifs (gray vertical lines) and TWIST1-binding signals (gray) identified from the REMAP DB are also indicated. (L) Representative Western blot image of co-IP showing a direct interaction of WWP2 full-length isoform and TWIST1 in myofibroblasts. (M) Effects of an activator of PGC-1α, ZLN005 (10 and 20 μM), in cultured WT myofibroblasts after TGFβ1 treatment (5 ng/μl, 72 hours). DMSO (10 μM) was used as a reference control. Upper panel: experimental design schematic. Lower panel: representative Western blot showing the effect of ZLN005 on PGC-1α protein expression in cultured WT myofibroblasts. (N) Effects of ZLN005 (10 and 20 μM) on cell metabolism in cultured WT myofibroblasts after TGFβ1 treatment (5 ng/μl, 72 hours), measured by Seahorse assay. DMSO (10 μM) was used as a reference control. Left panel: experimental design schematic. Middle panel: representative Seahorse Mito stress assays for OCR. Right panel: representative Seahorse Glycolysis assays for ECAR. n=3 independent experiments, each containing readouts from 3 to 4 microplate wells (technical replicates). Results of quantification analysis are shown in Supplemental Figure 9C. (O) Effects of ZLN005 (10 and 20 μM) on cell proliferation in cultured WT myofibroblasts after TGFβ1 treatment (5 ng/μl, 72 hours), measured by MTS assay (left panel) and Western blot (right panel) (n=6, from three independent experiments). P values were calculated by the two-tailed Mann–Whitney U test. (P) Western blot showing the effect of ZLN005 (10 and 20 μM) on ECM proteins production in cultured WT myofibroblasts after TGFβ1 treatment (5 ng/μl, 72 hours). (Q) Effects of an inhibitor of PGC-1α, SR18292 (2.5 and 5 μM), in cultured WWP2−/− myofibroblasts after TGFβ1 treatment (5 ng/μl, 72 hours). DMSO (5 μM) was used as a reference control. Upper panel: experimental design schematic. Lower panel: representative Western blot showing the effect of SR18292 on PGC-1α protein expression in cultured WWP2−/− myofibroblasts. (R) Effects of SR18292 (2.5 and 5 μM) on cell metabolism in cultured WWP2−/− myofibroblasts after TGFβ1 treatment (5 ng/μl, 72 hours) by Seahorse assay. DMSO (5 μM) was used as a reference control. Left panel: experimental design schematic. Middle panel: representative Seahorse Mito stress assays for OCR. Right panel: representative Seahorse Glycolysis assays for ECAR. n=3 independent experiments, each containing readouts from 3 to 4 microplate wells (technical replicates). Results of quantification analysis are shown in Supplemental Figure 9D. (S) Effects of SR18292 (2.5 and 5 μM) on cell proliferation in cultured WWP2−/− myofibroblasts after TGFβ1 treatment (5 ng/μl, 72 hours), measured by MTS assay (left panel) and Western blot (right panel) (n=6, from three independent experiments). P values were calculated by the two-tailed Mann–Whitney U test. (T) Western blot showing the effect of SR18292 (2.5 and 5 μM) on ECM proteins production in cultured WWP2−/− myofibroblasts after TGFβ1 treatment (5 ng/μl, 72 hours). 2-DG, 2-deoxy-D-glucose; ChIP, chromatin immuno-precipitation; ChIP-qPCR, chromatin immunoprecipitation quantitative PCR; ChIP-seq, chromatin immunoprecipitation sequencing; EDA-FN, extra domain A fibronectin; FCCP, fluoro-carbonyl cyanide phenylhydrazone; MTS, 3-(4,5-dimethylthiazol-2-yl)-5-(3-carboxymethoxyphenyl)-2-(4-sulfophenyl)-2H-tetrazolium; PGC-1α, peroxisome proliferator-activated receptor gamma coactivator 1-alpha; POSTN, periostin; RNA-seq, RNA sequencing; RSAT, regulatory sequence analysis tool; scRNA-seq, single-cell RNA sequencing.

References

    1. Kolb A Gallacher PJ Campbell J, et al. . A national registry study of patient and renal survival in adult nephrotic syndrome. Kidney Int Rep. 2021;6(2):449–459. doi:10.1016/j.ekir.2020.10.033 - DOI - PMC - PubMed
    1. Bulow RD, Boor P. Extracellular matrix in kidney fibrosis: more than just a scaffold. J Histochem Cytochem. 2019;67(9):643–661. doi:10.1369/0022155419849388 - DOI - PMC - PubMed
    1. Zeisberg M, Strutz F, Muller GA. Role of fibroblast activation in inducing interstitial fibrosis. J Nephrol. 2000;13(suppl 3):S111–S120. PMID: 11132027 - PubMed
    1. Sato Y, Yanagita M. Functional heterogeneity of resident fibroblasts in the kidney. Proc Jpn Acad Ser B Phys Biol Sci. 2019;95(8):468–478. doi:10.2183/pjab.95.033 - DOI - PMC - PubMed
    1. Miguel V, Kramann R. Metabolic reprogramming heterogeneity in chronic kidney disease. FEBS Open Bio. 2023;13(7):1154–1163. doi:10.1002/2211-5463.13568 - DOI - PMC - PubMed