Clinical Trial
. 2024 Mar 19;134(9):e162593.
doi: 10.1172/JCI162593.

Drug-regulated CD33-targeted CAR T cells control AML using clinically optimized rapamycin dosing

Affiliations
Clinical Trial

Drug-regulated CD33-targeted CAR T cells control AML using clinically optimized rapamycin dosing

Jacob Appelbaum et al. J Clin Invest. .

Abstract

Chimeric antigen receptor (CAR) designs that incorporate pharmacologic control are desirable; however, designs suitable for clinical translation are needed. We designed a fully human, rapamycin-regulated drug product for targeting CD33+ tumors called dimerizaing agent-regulated immunoreceptor complex (DARIC33). T cell products demonstrated target-specific and rapamycin-dependent cytokine release, transcriptional responses, cytotoxicity, and in vivo antileukemic activity in the presence of as little as 1 nM rapamycin. Rapamycin withdrawal paused DARIC33-stimulated T cell effector functions, which were restored following reexposure to rapamycin, demonstrating reversible effector function control. While rapamycin-regulated DARIC33 T cells were highly sensitive to target antigen, CD34+ stem cell colony-forming capacity was not impacted. We benchmarked DARIC33 potency relative to CD19 CAR T cells to estimate a T cell dose for clinical testing. In addition, we integrated in vitro and preclinical in vivo drug concentration thresholds for off-on state transitions, as well as murine and human rapamycin pharmacokinetics, to estimate a clinically applicable rapamycin dosing schedule. A phase I DARIC33 trial has been initiated (PLAT-08, NCT05105152), with initial evidence of rapamycin-regulated T cell activation and antitumor impact. Our findings provide evidence that the DARIC platform exhibits sensitive regulation and potency needed for clinical application to other important immunotherapy targets.

Keywords: Cancer immunotherapy; Hematology; Leukemias; T cells; Therapeutics.


Conflict of interest statement

Conflict of interest: WHL, AA, MP, and JJ are holders of patents related to DARIC (US 10,196,444 and applications US 2022/0025014, US 2019/0241910) and MCJ is a holder of patents related to CD19 CAR T cells (US10,869,889, US10,780,011, US9,217,025, US8,822,647, US11,851,649, US7,446,179, and others). AEP, JZ, WHL, DX, PPLS, SKH, UM, ARK, DEZ, PL, PDG, JJ, MP, and AA are current or former employees of 2seventy bio and own equity in 2seventy bio.

Figures

Figure 1
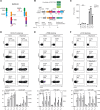
Figure 1. Rapamycin licenses permits antigen-dependent DARIC33 T cell responses and stabilizes surface expression of DARIC33 components.
(A) Schematic depicting rapamycin-dependent activation of DARIC33. In the absence of rapamycin, the two DARIC components are split and do not respond to antigen. Following rapamycin addition, heterodimerization of DARIC components enables antigen-dependent T cell responses. (B) Schematic depicting generation of DARIC33 candidates and T cell production. DNA sequences encoding modified VHH sequences are incorporated into DARIC33 lentiviral expression vectors. (C) IFN-γ release by DARIC33 cell products following coculture with CD33+ MV4-11 AML cells. One of n = 3 donors is shown. ***P < 0.001, ANOVA with Tukey’s multiple-comparison correction. (DF) Rapamycin stabilizes surface expression of DARIC33 components. DARIC33 cell products were cultured in medium alone or medium containing 1 nM rapamycin overnight before staining and evaluation by flow cytometry. Representative flow cytometry plots from 1 of 3 donors (above) with quantitation of percentage positive and median fluorescence intensity (MFI) from all 3 donors (below). *P < 0.05, **P < 0.01, ***P < 0.001, 2-way ANOVA with Šidák’s multiple-comparison correction, n = 3 donors. (D) Rapamycin increases antigen binding capacity of DARIC33 cells. (E) Rapamycin increases surface expression of the antigen signaling arm of DARIC. (F) Rapamycin increases surface expression of the antigen recognition arm of DARIC.
Figure 2
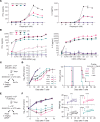
Figure 2. DARIC33-stimulated T cell responses require low levels of target antigen and low concentrations of rapamycin.
(A) Cytokine release by DARIC33 cells following coculture with MV4-11 AML target cells in the presence of increasing concentrations of rapamycin. IFN-γ is shown at left, IL-2 at right. (B) Cytokine release by UTD (control) or DARIC33 cells following coculture with or without rapamycin and HEK293 T cells electroporated with increasing amounts of CD33 mRNA. (C and D) 107 DARIC33+ cells or an equivalent number of UTD control cells were infused intravenously in NSG mice 7 days after engraftment of 1 × 10⁵ MOLM14.ff/luc leukemia cells per animal. After T cell infusion, mice were treated 3 times per week with 0.1 mg/kg rapamycin or were observed. (D) Left: Quantification of tumor growth by BLI; mean ± SEM, n = 5 mice per group. Right: Symptom-free survival with comparisons by Mantel-Cox (log-rank) test. (E and F) 107 DARIC33+ cells or an equivalent number of UTD control cells were infused intravenously in NSG mice 7 days after engraftment of 5 × 10⁶ HL-60.ff/luc leukemia cells per animal. After T cell infusion, mice were treated 3 times per week with 0.1 mg/kg rapamycin or were observed. (F) Left: Quantification of tumor growth by BLI; mean ± SEM, n = 5 mice per group. Right: Mouse weight. Time points at which all DARIC33 formats meet the P value threshold when compared with UTD cells plus rapamycin (D and F) are indicated as **P < 0.01, ***P < 0.001, using repeated-measures ANOVA with Dunnett’s multiple-comparison correction.
Figure 3
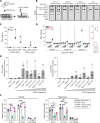
Figure 3. DARIC33 is specific for CD33 antigen and does not inhibit HSPC colony formation.
(A and B) Evaluation of CD33-specific VHH-Fc fusion proteins used in DARIC33 designs. (A) Schematic depicting detection strategy of VHH-Fc fusions binding to HEK293 cells expressing one of 5,528 surface-bound or secreted proteins. After reverse transfection, HEK293 cells are spotted onto slides, then stained with VHH-Fc proteins (or PBS control) and Alexa Fluor 647–labeled anti–human Fc secondary antibodies. (B) Secondary screen of selected hit and control transgenic HEK293 samples (n = 2 replicates shown). (C) Stimulation of T cell IFN-γ release by DARIC33 designs in the presence of rapamycin following exposure to HEK293 cells electroporated with mRNA encoding CD33M (left) and CD33m (right). (D) Left: Stimulation of T cell IFN-γ release by DARIC33 designs in the presence of rapamycin following exposure to HEK293 cells electroporated with mRNA encoding Siglec-6. Right: Release of IFN-γ following coculture of DARIC33 with MV4-11 AML cells is shown for comparison. (E) Correlation of CD33 density (expressed as the logarithm of the antigen binding capacity) with release of IFN-γ (left) and IL-2 (right). (F) Colony-forming units following culture of CD34+ cells alone or with T cells in the presence or absence of rapamycin. Colonies were enumerated after 14 days of growth. n = 2 T cell donors. **P < 0.01, ****P < 0.0001, ANOVA with Tukey’s multiple-comparison correction.
Figure 4
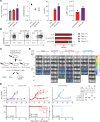
Figure 4. DARIC33 stimulates T cell transcriptional responses in the presence of antigen and rapamycin and without hallmarks of tonic signaling.
(AD) DARIC33 cells derived from n = 4 healthy donors were incubated with 1 nM rapamycin or medium alone before culture alone or with CD33+ MV4-11 AML target cells. After coculture, CD4+ and CD8+ cells were sorted and evaluated by RNA-Seq. (A) Schema for the experiment. DARIC33 cells resting in the absence of rapamycin or antigen are considered “off,” whereas DARIC33 cells incubated in rapamycin without antigen and with antigen exposure are labeled “ready” and “active,” respectively. (B) Transcriptional responses among selected genes associated with early T cell activation. (C) Volcano plot of the magnitude of statistical significance (y axis) versus magnitude of rapamycin and antigen (e.g., “DARIC-active”) effect (x axis, labeled “Coef.” in the figure). GZMB, IL2RA, and TNFRSF9 are shown in red, and additional genes exhibiting significant “DARIC-active” regulation are shown in black, with more detail provided in a heatmap shown in Supplemental Figure 5. (D) Flow cytometric confirmation that transcriptional changes are reflected in protein abundance. MFI for each sample is shown.
Figure 5
Figure 5. Clinically appropriate manufacture of donor-matched DARIC33 and CD19 CAR T cells allows comparisons of manufacture feasibility and cell potency.
(A) Yields of UTD, CD19 CAR, and DARIC33 cell products following manufacture using reagents and techniques appropriate for clinical application from n = 2 donors. (B) Surface expression of CD45RO and CD62L of clinical cell product facsimiles. Representative flow plot is shown at left, with quantitation from n = 2 donors shown at right (stacked bars indicate mean ± SD). (CE) 1 × 10⁷ to 3 × 10⁷ DARIC33+ cells, CD19 CAR T cells, or CD19 DARIC+ cells or an equivalent number of UTD control cells were infused intravenously in NSG mice 7 days after engraftment of 5 × 10⁵ Raji.CD33.ff/luc leukemia cells. After T cell infusion, mice were treated with 0.1 mg/kg rapamycin 3 times weekly for the indicated durations or were observed. (C) Schematic depicting experimental design. To compare cell potency with benchmark immunotherapy products, 2 doses of DARIC33+ cells were used. (D) Tumor progression monitored by bioluminescence; n = 5–8 mice per group. (E) Top: Quantitation of tumor growth, with points representing measurements of individual mice. Bottom: Kaplan-Meier survival estimates; log-rank test P values.
Figure 6
Figure 6. Activation of SC-DARIC33 is reversible.
(A) DARIC33 cell cytokine responses to antigen at various times following washout from rapamycin-containing medium. DARIC33 cells replaced into rapamycin-containing medium or DARIC33 cells previously cultured in medium not containing rapamycin were used as comparators. The t1/2 was determined by fitting of a single-phase exponential decay. (BF) 107 SC-DARIC33+ cells or an equivalent number of UTD control cells were infused intravenously in NSG mice 7 days after engraftment of 1 × 10⁶ MV4-11.ff/luc leukemia cells. After T cell infusion, mice were treated with 0.1 mg/kg rapamycin 3 times weekly for the indicated durations or were observed. (C) Tumor progression monitored by bioluminescence; n = 5 mice per group. Images taken during a “pause” in rapamycin dosing are outlined in red. (D) Quantitation of tumor growth. Points are measurements of individual mice, lines are best-fit tumor growth trajectories (see Supplemental Methods). (E) Tumor growth rates. Points are growth rates fit for individual mice; boxes and whiskers show mean and SD. **P < 0.01, 2-tailed t tests with Benjamini-Hochberg correction for multiple comparisons. (F) Survival after infusion of DARIC33 cells or UTD cells followed by treatment with various rapamycin schedules. Mantel-Cox log-rank P values are shown uncorrected.
Figure 7
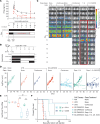
Figure 7. In vitro modeling of SC-DARIC33 rapamycin response allows targeted rapamycin dosing in vivo.
(A) Cytokine release following stimulation of DARIC33 cells with MV4-11 AML cells in medium or whole blood in the presence of increasing rapamycin concentrations. IFN-γ responses are normalized per donor, and apparent EC50 determined using 4-parameter logistic dose-response curves is reported. (B) Determination of rapamycin pharmacokinetics in mice. Concentrations of rapamycin in whole blood obtained during administration of various rapamycin doses 3 times weekly are shown above, along with the timing of intraperitoneal rapamycin injections (bars, below). Upper limit of quantitation (ULOQ = 200 ng/mL) and lower limit of quantitation (LLOQ = 1 ng/mL) are indicated. (C and D) AML tumor progression in mice following treatment with DARIC33 and various dose schedules of rapamycin days 0–18 after T cell infusion. (C) Schematic illustrating experimental design. (D) Quantitation of tumor growth kinetics. Points represent bioluminescence measures of individual mice (n = 5–10 per group), and lines indicate tumor growth trajectories modeled using linear mixed effects. (E) Modeled tumor growth rates (slopes of lines in D). Points are growth rates modeled for individual mice; boxes and whiskers show mean and SD. **P < 0.01, ***P < 0.001, ****P < 0.0001, 2-tailed t tests with Benjamini-Hochberg correction for multiple comparisons.
Figure 8
Figure 8. Clinical SC-DARIC33 exhibits activity in patients following accurate targeting of rapamycin levels.
(A) PLAT-08 clinical treatment schema. After SC-DARIC33 manufacturing, subjects receive lymphodepleting fludarabine and cyclophosphamide (Flu/Cy) and SC-DARIC33 at 1 of 3 assigned dose levels on day 0. Rapamycin is administered on days 3–21. Bone marrow biopsies are conducted for response assessments on days 21 and 28. (B) Simulated serum rapamycin concentrations using population pharmacokinetic modeling. Daily administration of 0.5 mg/m2 rapamycin achieves trough concentrations above the target range for SC-DARIC33 activation and peak concentrations below immunosuppressive doses of rapamycin for most pediatric subjects. (C) Characteristics of thawed clinical SC-DARIC33 cell products administered to trial participants. The proportion of cells expressing surface DARIC components as assessed by flow cytometry is shown. (D) Expression of activation markers by clinical infusion cell products following overnight culture in medium alone or medium supplemented with 1 nM rapamycin. (E) Frequent reevaluation enables successful targeting of serum rapamycin levels in patients. The proportion of time points (both peak and trough levels) within the target range (1.5–4 ng/mL) is shown at right. (F) Elevation of serum cytokines associated with T cell activation is observed following administration of SC-DARIC33. Traces show cytokine levels for samples obtained from each patient. Values reported are the mean of n = 2 replicates.
Figure 9
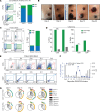
Figure 9. Clinical activity of rapamycin-activated SC-DARIC33 in patients.
(A) Expression of FRB by SC-DARIC33 is correlated with rapamycin exposure. SC-DARIC33 manufactured from a healthy donor was cultured overnight in medium alone or media supplemented with 1 nM rapamycin. The proportion of VHH+ and FRB+ cells is shown in the bar graph. Note the rightward shift of VHH+ cells following rapamycin exposure. (B) Progressive inflammatory changes and hemorrhagic conversion of a chloroma following administration of SC-DARIC33 to subject S002. Samples from chloroma tissues are shown in C and D. Photographs used with permission. (C) Rapamycin-activated FRB+ DARIC33 T cells are expanded within chloroma tissue. Paired blood and chloroma tissue from patient S002 were evaluated by flow cytometry. T cells expressing CD3 were analyzed for VHH and FRB expression. The proportion of VHH+ and FRB+ cells among CD3+ cells is shown in the bar graph. (D) Rapamycin-activated DARIC33 cells within chloroma tissue obtained from patient S002 express increased markers of activation including PD-1 and TIM3. The proportion of either VHH+FRB+ cells (green bars) or VHH cells (gray bars) expressing PD-1 or TIM3 is shown. ***P < 0.001, χ2 test with Bonferroni correction for multiple tests. (E) Peripheral blood from patient S004 shows concurrent expansion of DARIC33 cells and reduction of CD33hi cells. (F) Quantification of antigen abundance, as measured by MFI, and expansion of SC-DARIC33 cells within blood samples. Peak SC-DARIC33 expansion is followed by decreased CD33 antigen expression. (G) Expression of activation/exhaustion markers by rapamycin-activated SC-DARIC33 cells, as assessed by flow cytometry. Boolean gating results are shown as pie graphs with overlapping arcs indicating multi-antigen expression. At later time points (days 17 and 21), expression of activation markers is increased among VHH+FRB+ cells.

References

    1. Ghorashian S, et al. Enhanced CAR T cell expansion and prolonged persistence in pediatric patients with ALL treated with a low-affinity CD19 CAR. Nat Med. 2019;25(9):1408–1414. doi: 10.1038/s41591-019-0549-5. - DOI - PubMed
    1. Juluri KR, et al. Severe cytokine release syndrome is associated with hematologic toxicity following CD19 CAR T-cell therapy. Blood Adv. 2022;6(7):2055–2068. doi: 10.1182/bloodadvances.2020004142. - DOI - PMC - PubMed
    1. Perna F, et al. Integrating proteomics and transcriptomics for systematic combinatorial chimeric antigen receptor therapy of AML. Cancer Cell. 2017;32(4):506–519. doi: 10.1016/j.ccell.2017.09.004. - DOI - PMC - PubMed
    1. Leung WH, et al. Sensitive and adaptable pharmacological control of CAR T cells through extracellular receptor dimerization. JCI Insight. 2019;4(11):e124430. doi: 10.1172/jci.insight.124430. - DOI - PMC - PubMed
    1. Wu CY, et al. Remote control of therapeutic T cells through a small molecule-gated chimeric receptor. Science. 2015;350(6258):aab4077. doi: 10.1126/science.aab4077. - DOI - PMC - PubMed

Publication types

MeSH terms