. 2024 Mar 19;134(10):e176748.
doi: 10.1172/JCI176748.

STING activation reprograms the microenvironment to sensitize NF1-related malignant peripheral nerve sheath tumors for immunotherapy

Affiliations

STING activation reprograms the microenvironment to sensitize NF1-related malignant peripheral nerve sheath tumors for immunotherapy

Bandarigoda N Somatilaka et al. J Clin Invest. .

Abstract

Neurofibromatosis type 1 (NF1) is caused by mutations in the NF1 gene that encodes neurofibromin, a RAS GTPase-activating protein. Inactivating NF1 mutations cause hyperactivation of RAS-mediated signaling, resulting in the development of multiple neoplasms, including malignant peripheral nerve sheath tumors (MPNSTs). MPNSTs are an aggressive tumor and the main cause of mortality in patients with NF1. MPNSTs are difficult to resect and refractory to chemo- and radiotherapy, and no molecular therapies currently exist. Immune checkpoint blockade (ICB) is an approach to treat inoperable, undruggable cancers like MPNST, but successful outcomes require an immune cell-rich tumor microenvironment. While MPNSTs are noninflamed "cold" tumors, here, we converted MPNSTs into T cell-inflamed "hot" tumors by activating stimulator of IFN genes (STING) signaling. Mouse genetic and human xenograft MPNST models treated with a STING agonist plus ICB exhibited growth delay via increased apoptotic cell death. This strategy offers a potential treatment regimen for MPNSTs.

Keywords: Cancer immunotherapy; Immunotherapy; Oncology; Therapeutics.


Conflict of interest statement

Conflict of interest: The authors have declared that no conflict of interest exists.

Figures

Figure 1
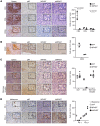
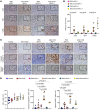
Figure 1. Characterization of the immune microenvironment of MPNST.
(AD) Paraffin sections of murine spleen, murine pNF (harvested from Sox10-CreERT Nf1fl/fl mice induced with tamoxifen), murine MPNST (from cisNP mice), and MPNST allografts in athymic nude mice (aMPNST) were stained with antibodies against CD3, CD4, and CD8α (A); CD20 (B); and Iba1, iNOS, and the mannose receptor (C). (D) Paraffin sections of human melanoma, murine pNFs, murine MPNSTs, and human MPNSTs (hMPNST) were stained with antibodies against PD-1 and PD-L1. Sections in AD were counterstained with hematoxylin (blue), and the respective cell counts for AD are shown on the right. Data indicate the mean ± SEM (A) and the mean ± SD (BD). *P < 0.0 and ****P < 0.0001, by 2-tailed t test with respect to pNF (A). Scale bars: 50 μm. Original magnification, ×80 (enlarged insets).
Figure 2
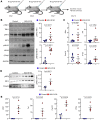
Figure 2. ADU-S100 treatment of cisNP mice activates the STING pathway in tumors.
(A) Schema of the ADU-S100 treatment protocol. (B) Western blot analysis for expression of the indicated proteins in MPNSTs harvested from cisNP mice treated with vehicle control (n = 8) or ADU-S100 (n = 6). Quantified protein band intensities are shown graphically on the right. (C) PCR analysis of the fold change in cytokine gene expression (Ifnb1, Tnf, Cxcl10, and Il12a) in cisMPNSTs harvested from control-treated (n = 8) and ADU-S100–treated (n = 6) mice. (D) Western blot analysis for expression of the indicated proteins in MPNSTs harvested from cisNP mice treated with vehicle control (n = 4) or ADU-S100 (n = 4) for 24 hours. Quantified protein band intensities are shown graphically on the right. (E) PCR analysis of fold change in cytokine gene expression (Ifnb1, Tnf, Cxcl10, and Il12a) in cisMPNSTs harvested from control-treated (n = 4) and ADU-S100–treated (n = 4) mice 24 hours after treatment. Data are presented as the mean ± SEM. *P < 0.05, **P < 0.01, and ****P < 0.0001, by 2-tailed t test versus vehicle control.
Figure 3
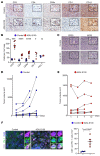
Figure 3. STING activation in MPNST increases T cell infiltration and impedes tumor growth.
(A) Paraffin sections of MPNSTs harvested from vehicle-treated or ADU-S100–treated cisNP mice were stained with antibodies against CD3, CD4, CD8α, PD-1, and PD-L1 and (B) quantified. (C) The same sections were also stained for CD20 and iNOS. (D and E) Tumor volume change with time in response to indicated treatments. (F) Coimmunostaining for CD3 and PD-1 with quantification. Cells marked with asterisks in each panel are magnified and shown adjacently. Control, n = 4; ADU-S100, n = 5. Scale bars: 50 μm. Original magnification, ×80 (enlarged insets in A and C) and ×160 (enlarged insets in F). Data are presented as the mean ± SEM. *P < 0.05, **P < 0.01, ***P < 0.001, and ****P < 0.0001, by unpaired, 2-tailed t test versus vehicle control. See Methods for a detailed description of the staining methodology.
Figure 4
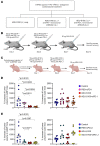
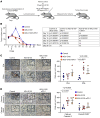
Figure 4. Combination treatment of cisNP mice with a STING agonist plus ICB delays tumor growth.
(A) Treatment arms for STING activation followed by the ICB study. i.t., intratumoral. (B) Schema of drug treatment for STING activation and ICB in cisNP mice. (C) Schema of STING activation and ICB in nude mice. (D and E) Percentage of increase in tumor volume in cisNP mice and nude mice given the indicated treatments. Control, n = 9; ADU-S100, ADU-S100 plus anti–PD-1 (αPD-1), n = 6; PBS plus anti–PD-1, n = 6; PBS plus anti–PD-L1, n = 5; ADU-S100 plus anti–PD-L1, n = 7 for cisNP mice. Control, n = 11; ADU-S100, n = 11; ADU-S100 plus anti–PD-1, n = 12; PBS plus anti–PD-1, n = 12; PBS plus anti–PD-L1, n = 10; ADU-S100 plus anti–PD-L1, n = 10 for nude mice. The same data sets for control and ADU-S100 treatments in D are shown in the respective graphs in E for clarity and ease of comparison. Data are presented as the mean ± SEM. *P < 0.05 and **P < 0.01, by Tukey’s multiple-comparison test.
Figure 5
Figure 5. Combination treatment of cisNP mice with STING agonist plus ICB increases the expression of apoptotic markers in MPNSTs.
(A) Paraffin sections from MPNSTs harvested from mice treated as indicated were stained for T cell markers. (B) Quantification of images in A. (C) Paraffin sections from MPNSTs harvested from mice treated as indicated were stained for p-H3, cleaved caspase 3, and cleaved PARP. (D) Quantification of p-H3+ cells, cleaved caspase 3+ cells, and cleaved PARP+ cells in tumors treated as indicated in C. Control, n = 8; ADU-S100, ADU-S100 plus anti–PD-1, n = 6; PBS plus anti–PD-1, PBS plus anti–PD-L1, ADU-S100 plus anti–PD-L1, n = 3. Data are presented as the mean ± SEM. *P < 0.05, **P < 0.01, ***P < 0.001, and ****P < 0.0001, by 2-tailed t test (B) and Tukey’s multiple-comparison test (D). Scale bars: 50 μm. Original magnification, ×80 (enlarged insets in A and C). See Methods for a detailed description of the staining methodology.
Figure 6
Figure 6. Combination treatment of xenograft human MPNST with a STING agonist plus ICB accelerates complete tumor regression.
(A) Schema showing the design of the mouse xenograft MPNST model and the treatment regimen of ADU-S100 with ICB. (B) Change in xenograft MPNST volumes following the indicated treatments. Control, ADU-S100, and ADU-S100 plus anti–PD-1 (n = 15 each). (C) Paraffin sections from xenograft MPNSTs treated as indicated were stained for T cell markers. (D) Paraffin sections from xenograft MPNSTs treated as indicated were stained for cleaved caspase 3 and cleaved PARP. Control, n = 3–4; ADU-S100, n = 3–4; ADU-S100 plus anti–PD-1, n = 3–4. Data are presented as the mean ± SEM. *P < 0.05 and **P < 0.01, by Tukey’s multiple-comparison test. Scale bars: 50 μm. Original magnification, ×80 (enlarged insets in C and D).

References

    1. Kim A, et al. Malignant peripheral nerve sheath tumors state of the science: leveraging clinical and biological insights into effective therapies. Sarcoma. 2017;2017:7429697. doi: 10.1155/2017/7429697. - DOI - PMC - PubMed
    1. Ratner N, Miller SJ. A RASopathy gene commonly mutated in cancer: the neurofibromatosis type 1 tumour suppressor. Nat Rev Cancer. 2015;15(5):290–301. doi: 10.1038/nrc3911. - DOI - PMC - PubMed
    1. Kim A, et al. Targeting refractory sarcomas and malignant peripheral nerve sheath tumors in a phase I/II study of sirolimus in combination with ganetespib (SARC023) Sarcoma. 2020;2020:5784876. doi: 10.1155/2020/5784876. - DOI - PMC - PubMed
    1. Schuetze SM, et al. SARC009: Phase 2 study of dasatinib in patients with previously treated, high-grade, advanced sarcoma. Cancer. 2016;122(6):868–874. doi: 10.1002/cncr.29858. - DOI - PubMed
    1. Chugh R, et al. Phase II multicenter trial of imatinib in 10 histologic subtypes of sarcoma using a bayesian hierarchical statistical model. J Clin Oncol. 2009;27(19):3148–3153. doi: 10.1200/JCO.2008.20.5054. - DOI - PubMed

MeSH terms