. 2024 Mar 26;121(13):e2309925121.
doi: 10.1073/pnas.2309925121. Epub 2024 Mar 19.

Vulnerability to APOBEC3G linked to the pathogenicity of deltaretroviruses

Affiliations

Vulnerability to APOBEC3G linked to the pathogenicity of deltaretroviruses

Takafumi Shichijo et al. Proc Natl Acad Sci U S A. .

Abstract

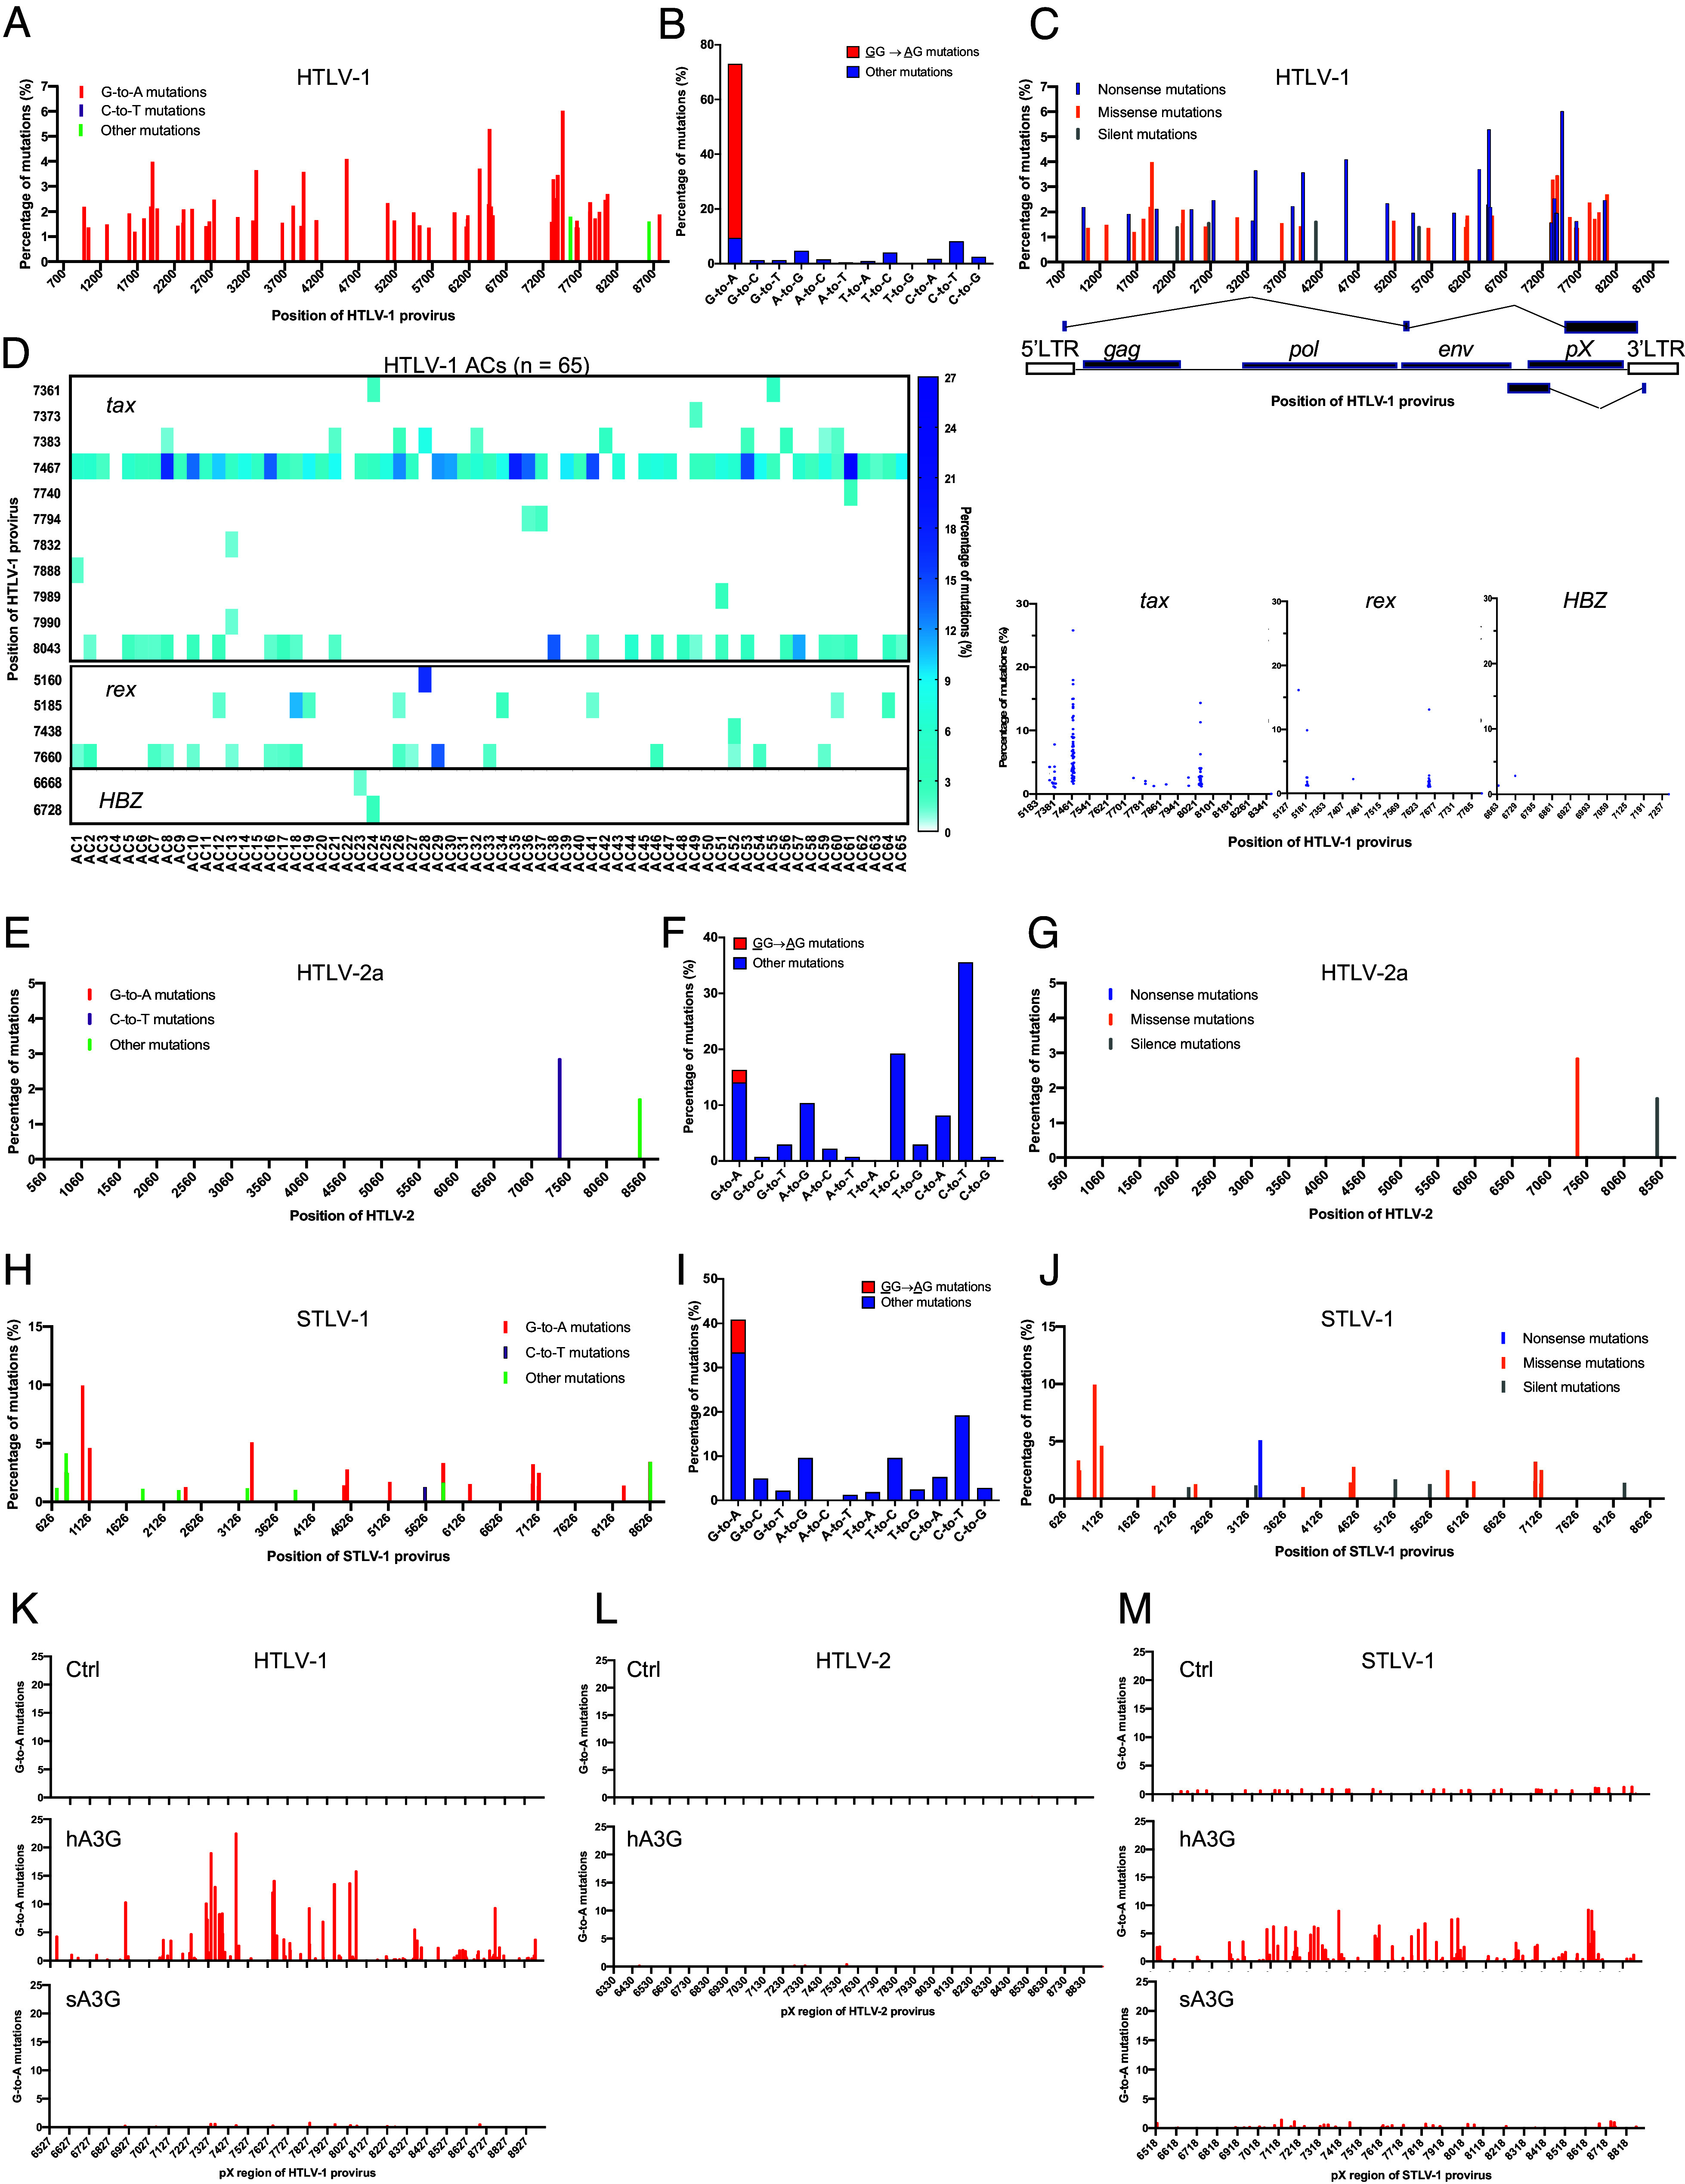
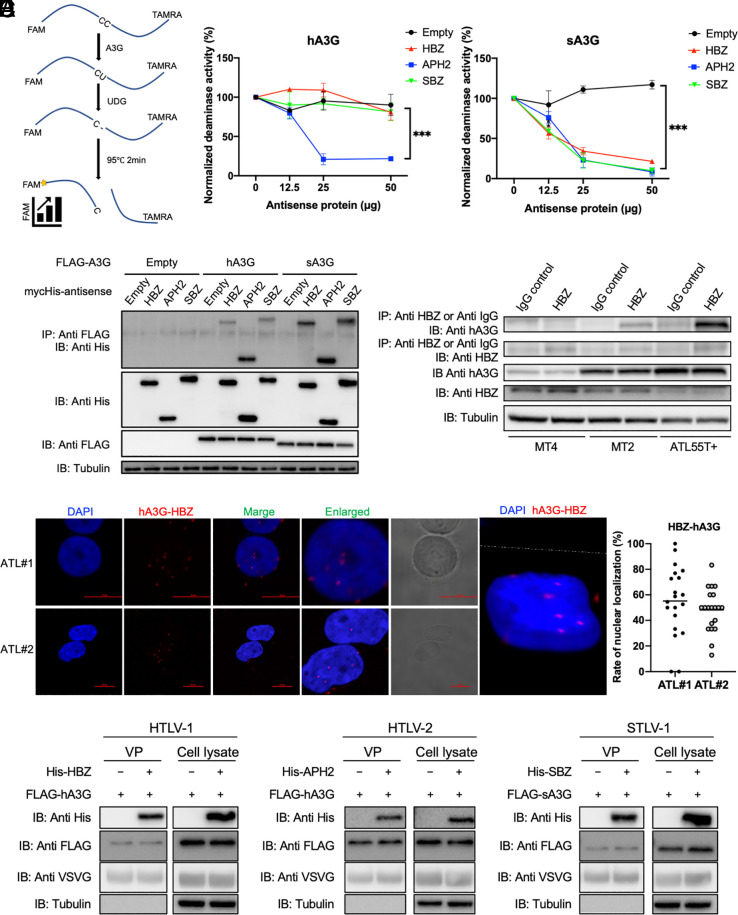
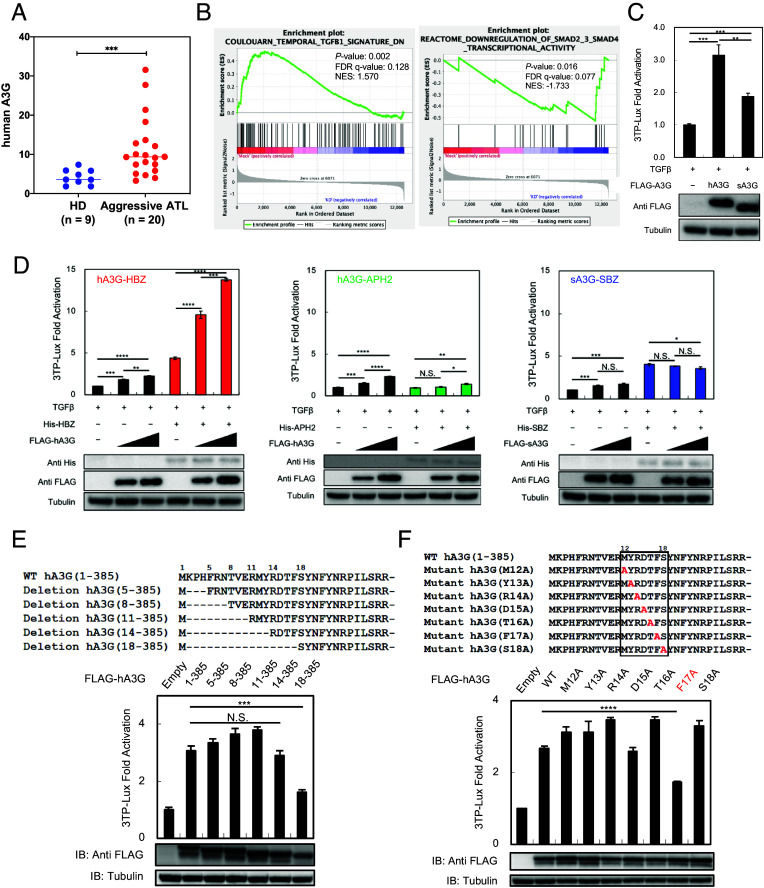
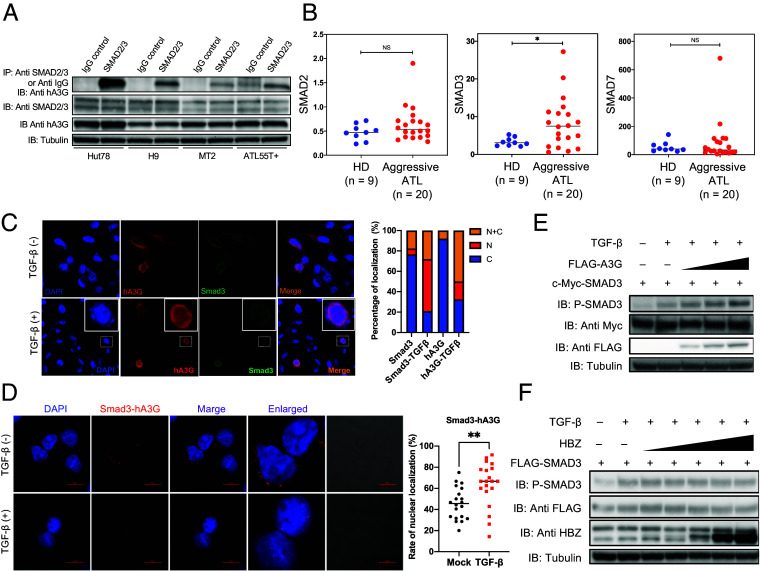
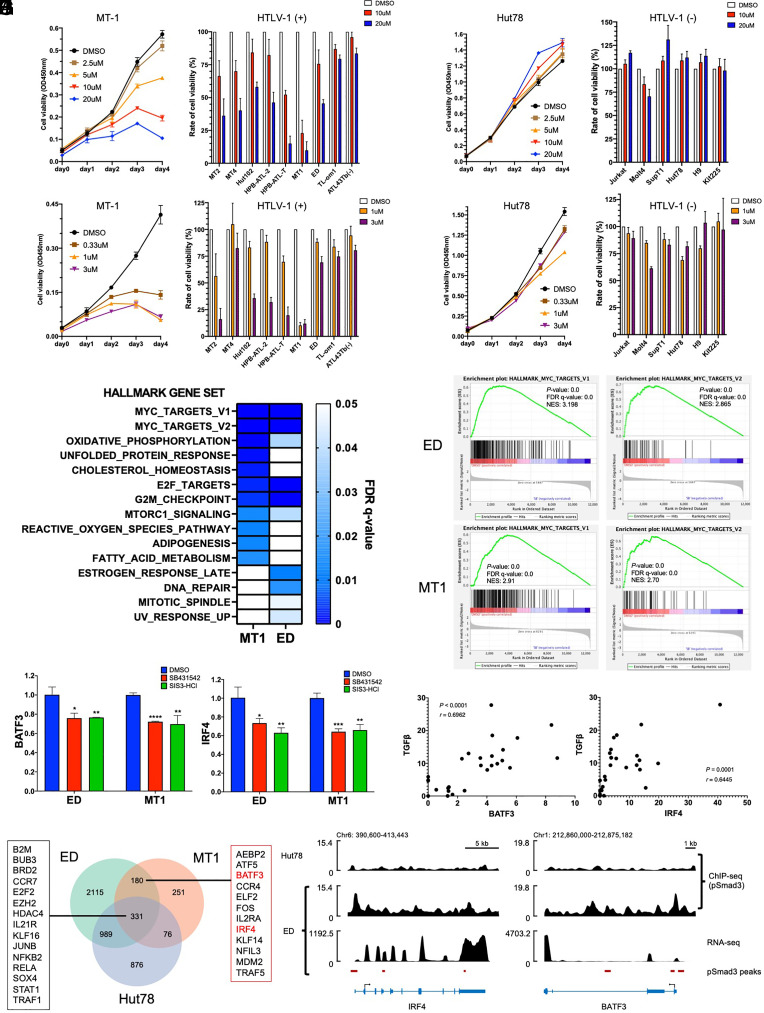
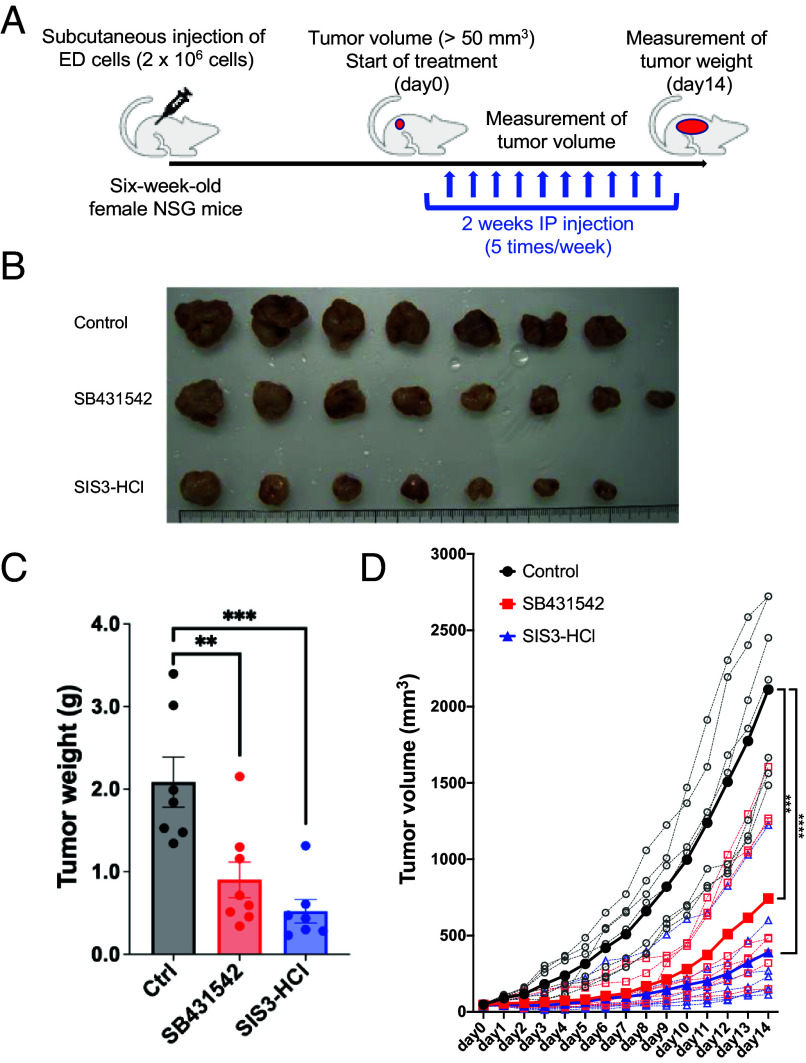
Human retroviruses are derived from simian ones through cross-species transmission. These retroviruses are associated with little pathogenicity in their natural hosts, but in humans, HIV causes AIDS, and human T-cell leukemia virus type 1 (HTLV-1) induces adult T-cell leukemia-lymphoma (ATL). We analyzed the proviral sequences of HTLV-1, HTLV-2, and simian T-cell leukemia virus type 1 (STLV-1) from Japanese macaques (Macaca fuscata) and found that APOBEC3G (A3G) frequently generates G-to-A mutations in the HTLV-1 provirus, whereas such mutations are rare in the HTLV-2 and STLV-1 proviruses. Therefore, we investigated the mechanism of how HTLV-2 is resistant to human A3G (hA3G). HTLV-1, HTLV-2, and STLV-1 encode the so-called antisense proteins, HTLV-1 bZIP factor (HBZ), Antisense protein of HTLV-2 (APH-2), and STLV-1 bZIP factor (SBZ), respectively. APH-2 efficiently inhibits the deaminase activity of both hA3G and simian A3G (sA3G). HBZ and SBZ strongly suppress sA3G activity but only weakly inhibit hA3G, suggesting that HTLV-1 is incompletely adapted to humans. Unexpectedly, hA3G augments the activation of the transforming growth factor (TGF)-β/Smad pathway by HBZ, and this activation is associated with ATL cell proliferation by up-regulating BATF3/IRF4 and MYC. In contrast, the combination of APH-2 and hA3G, or the combination of SBZ and sA3G, does not enhance the TGF-β/Smad pathway. Thus, HTLV-1 is vulnerable to hA3G but utilizes it to promote the proliferation of infected cells via the activation of the TGF-β/Smad pathway. Antisense factors in each virus, differently adapted to control host cellular functions through A3G, seem to dictate the pathogenesis.

Keywords: APOBEC3G; HBZ; HTLV-1; TGF-β; deltaretrovirus.


Conflict of interest statement

Competing interests statement:The authors declare no competing interest.

Figures

Fig. 1.
Fig. 1.
A3G induces G-to-A mutations in HTLV-1, but not in HTLV-2 and STLV-1. (A) Frequency of mutations detected in the proviruses of 65 HTLV-1 ACs by deep sequencing. (B) These HTLV-1 mutations occurred primarily at human APOBEC3G (hA3G) preferred target sequences. (C) Frequency of nonsense mutations observed in 65 HTLV-1 ACs. (D) Heatmaps showing the frequency of nonsense mutations observed in the tax, rex, and HBZ genes in 65 HTLV-1 ACs. (E) Frequency of mutations detected in the proviruses of 11 HTLV-2a-infected individuals by deep sequencing. (F) These HTLV-2a mutations did not typically occur at hA3G preferred target sequences (GG→AG). (G) Frequency of nonsense mutations observed in 11 HTLV-2a-infected individuals. (H) Frequency of mutations detected in the proviruses of 16 STLV-1-infected Japanese macaques by deep sequencing. (I) Most of these STLV-1 mutations do not typically occur at sA3G target sequences. (J) Frequency of nonsense mutations observed in 16 STLV-1-infected Japanese macaques. Mutations detected in more than 10% of total cases are shown (A and C in HTLV-1 ACs, E and G in HTLV-2a-infected individuals, and H and J in STLV-1-infected Japanese macaques). (K) Frequency of G-to-A mutations detected in HTLV-1-infected cells expressing hA3G or sA3G in vitro. (L) Frequency of G-to-A mutations detected in HTLV-2-infected cells expressing hA3G in vitro. (M) Frequency of G-to-A mutations detected in STLV-1-infected cells expressing hA3G or sA3G in vitro. Experiments were performed twice (K–M).
Fig. 2.
Fig. 2.
Antisense proteins interact with A3G. (A) Schematic representation of the A3G-mediated deaminase activity assay (Left) and quantifications of A3G deaminase activity in the presence of increasing concentrations of HBZ, APH-2, and SBZ (normalized mean ± SD of triplicate experiments; one-way ANOVA with Tukey correction; ***P < 0.001) (Right). (B) Coimmunoprecipitation experiment showing the interaction between human or sA3G and the antisense proteins of HTLV-1, HTLV-2, and STLV-1 in transfected HEK293T cells. IP, immunoprecipitation; IB, immunoblot. (C) Coimmunoprecipitation experiment showing the interaction of endogenous hA3G with endogenous HBZ in HTLV-1-infected T cell lines (MT-2 and MT-4), and an ATL cell line (ATL-55T+). IP, immunoprecipitation; IB, immunoblot. (D) Complex of hA3G with HBZ in primary ATL cells (n = 2; ATL#1 and ATL#2) and 3-dimensional image of a fresh ATL cell (ATL#2) shown by confocal z-stacking, detected by the Duolink Proximity Ligation Assay (Left) and rate of nuclear localization of HBZ-hA3G complex (Right). (E) Immunoblot showing the incorporation of both A3G and antisense proteins into HTLV-1, HTLV-2, and STLV-1 VP. All experiments were performed at least twice.
Fig. 3.
Fig. 3.
hA3G cooperates with HBZ to activate the TGF-β/SMAD pathway. (A) Expression of hA3G in healthy donors (n = 9) and patients with aggressive ATL (acute, and lymphoma type ATL) (n = 20) by RT-qPCR (triplicate experiments; one-way ANOVA with Tukey correction; ***P < 0.001). (B) Gene signatures that are significantly enriched in hA3G-knockdown ATL cells (ATL-55T+), based on GSEA analysis with RNA-seq. (C) Luciferase activity of 3TP-Lux under the control of a TGF-β responsive element in cells expressing hA3G or sA3G (normalized mean ± SD of triplicate experiments; two-tailed unpaired Student’s t test; **P < 0.01; ***P < 0.001). (D) Luciferase activity of 3TP-Lux under the control of a TGF-β responsive element in cells coexpressing HBZ with hA3G (Left), APH-2 with hA3G (Middle), or SBZ with sA3G (Right) (normalized mean ± SD of triplicate experiments; two-tailed unpaired Student’s t test; *P < 0.05; **P < 0.01; ***P < 0.001; ****P < 0.0001). (E) Luciferase activity of 3TP-Lux under the control of a TGF-β responsive element in cells expressing deletion mutants of the N-terminal region of hA3G (normalized mean ± SD of triplicate experiments; two-tailed unpaired Student’s t test; ***P < 0.001). IB, immunoblot. (F) Luciferase activity of 3TP-Lux under the control of a TGF-β responsive element in cells expressing alanine scanning mutants of the 12 to 18th amino acids of hA3G (normalized mean ± SD of triplicate experiments; two-tailed unpaired Student’s t test; ****P < 0.0001). IB, immunoblot.
Fig. 4.
Fig. 4.
Interaction between A3G and Smad proteins. (A) Coimmunoprecipitation experiment showing the interaction of endogenous hA3G with endogenous Smad2/3 in HTLV-1-negative T cell lines (Hut78, H9), an HTLV-1-infected T cell line (MT-2), and an ATL cell line (ATL55T+). IP, immunoprecipitation; IB, immunoblot. (B) Expression of Smad2, Smad3, and Smad7 in healthy donors (n = 9) and patients with aggressive ATL (n = 20) by RT-qPCR (triplicate experiments; one-way ANOVA with Tukey correction; *P < 0.05). (C) Immunofluorescence microscopy images showing the hA3G protein and Smad3 protein in the presence or absence of TGF-β (Left) and percentage of localization (Right) in transfected HeLa cells. N: nucleus, C: cytoplasm. (D) Complex of hA3G with Smad3 in primary ATL cells with or without TGF-β treatment, detected by the Duolink PLA (Left) and the rate of nuclear localization (Right; two-tailed unpaired Student’s t test; **P < 0.01). (E) Immunoblot showing that hA3G expression induces the phosphorylation of Smad3 in a dose-dependent manner in transfected HepG2 cells. (F) Immunoblotting reveals no dose-dependent phosphorylation of Smad3 induced by HBZ expression in transfected HepG2 cells. Experiments were performed at least twice (A and CF).
Fig. 5.
Fig. 5.
Blockage of TGF-β/Smad signaling suppresses ATL cell proliferation. (A and B) Cell growth of MT-1 (A) Hut78 (B) cells treated with SB431542 (Left), and cell growth rates of assorted HTLV-1-infected T cell lines (n = 9) (A) and HTVL-1 noninfected T cell lines (n = 6) (B) treated with SB431542 at day 4 are shown (Right) (normalized mean ± SD of triplicate experiments). (C and D) Cell growth of MT-1 (C) Hut78 (D) cells treated with SIS3-HCl cell (Left), and cell growth rates of assorted HTLV-1-infected T cell lines (n = 9) (C) and HTVL-1 noninfected T cell lines (n = 6) (D) treated with SIS3-HCl at day 4 are shown (Right) (normalized mean ± SD of triplicate experiments). (E) Hallmark gene sets down-regulated in MT-1 and ED cells upon treatment with SB431542, analyzed by RNA-seq. (F) Significantly enriched gene signatures for Myc-related gene sets in SB431542 treated ED cells and MT-1 cells, determined by GSEA analysis with RNA-seq. (G) BATF3 and IRF4 expression in ED and MT-1 cells treated with SB431542 or SIS3-HCl, analyzed by RT-qPCR (one-way ANOVA with Tukey correction; *P < 0.05; **P < 0.01; ***P < 0.001; ****P < 0.0001). (H) Correlation of TGF-β protein with BATF3 protein or IRF4 protein in fresh ATL cells (n = 26), detected by multiplex mass-cytometry analysis (CyToF) (Pearson correlation analysis). (I) Venn diagram of differently expressed genes (DEG) by ChIP-seq in ED cells, MT-1 cells, and Hut78 cells. (J) Enrichment of phosphorylated Smad3 in BATF3 and IRF4 genes demonstrated by ChIP-seq analysis in an ATL cell line (ED) and a non-ATL T cell line (Hut78).
Fig. 6.
Fig. 6.
In vivo effect of blockage of TGF-β/Smad signaling on ATL. (A) Schematic representation of the xenograft model of ATL. (B) ATL tumor growth in mice treated with control (n = 7), SB431542 (n = 8), or SIS3-HCl (n = 7). (C and D) ATL tumor weights (normalized mean ± SD) (C) and volumes (D) in mice treated with control (n = 7), SB431542 (n = 8), or SIS3-HCl (n = 7) are shown (one-way ANOVA with Tukey correction; **P < 0.01; ***P < 0.001; ****P < 0.0001).

References

    1. Poiesz B. J., et al. , Detection and isolation of type C retrovirus particles from fresh and cultured lymphocytes of a patient with cutaneous T-cell lymphoma. Proc. Natl. Acad. Sci. U.S.A. 77, 7415–7419 (1980). - PMC - PubMed
    1. Kalyanaraman V. S., et al. , A new subtype of human T-cell leukemia virus (HTLV-II) associated with a T-cell variant of hairy cell leukemia. Science 218, 571–573 (1982). - PubMed
    1. Barre-Sinoussi F., et al. , Isolation of a T-lymphotropic retrovirus from a patient at risk for acquired immune deficiency syndrome (AIDS). Science 220, 868–871 (1983). - PubMed
    1. Barin F., et al. , Serological evidence for virus related to simian T-lymphotropic retrovirus III in residents of west Africa. Lancet 2, 1387–1389 (1985). - PubMed
    1. Kanki P. J., et al. , New human T-lymphotropic retrovirus related to simian T-lymphotropic virus type III (STLV-IIIAGM). Science 232, 238–243 (1986). - PubMed

MeSH terms

Substances