. 2024 Mar 26;121(13):e2317095121.
doi: 10.1073/pnas.2317095121. Epub 2024 Mar 19.

Morc1 reestablishes H3K9me3 heterochromatin on piRNA-targeted transposons in gonocytes

Affiliations

Morc1 reestablishes H3K9me3 heterochromatin on piRNA-targeted transposons in gonocytes

Yuta Uneme et al. Proc Natl Acad Sci U S A. .

Abstract

To maintain fertility, male mice re-repress transposable elements (TEs) that were de-silenced in the early gonocytes before their differentiation into spermatogonia. However, the mechanism of TE silencing re-establishment remains unknown. Here, we found that the DNA-binding protein Morc1, in cooperation with the methyltransferase SetDB1, deposits the repressive histone mark H3K9me3 on a large fraction of activated TEs, leading to heterochromatin. Morc1 also triggers DNA methylation, but TEs targeted by Morc1-driven DNA methylation only slightly overlapped with those repressed by Morc1/SetDB1-dependent heterochromatin formation, suggesting that Morc1 silences TEs in two different manners. In contrast, TEs regulated by Morc1 and Miwi2, the nuclear PIWI-family protein, almost overlapped. Miwi2 binds to PIWI-interacting RNAs (piRNAs) that base-pair with TE mRNAs via sequence complementarity, while Morc1 DNA binding is not sequence specific, suggesting that Miwi2 selects its targets, and then, Morc1 acts to repress them with cofactors. A high-ordered mechanism of TE repression in gonocytes has been identified.

Keywords: Morc1; gonocyte; heterochromatin; piRNA.


Conflict of interest statement

Competing interests statement:The authors declare no competing interest.

Figures
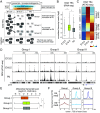
Fig. 1.
Fig. 1.
Resilencing of TEs in gonocytes coincides with enrichment of H3K9me3. (A) Schematic of TE dynamics during the gonocyte stage. TEs are indicated by squares with rounded corners. The color inside the squares denotes the degree of TE silencing. A dark color indicates a more repressive chromatin state on each TE. (B) Dynamics of the transcript abundance of TEs with higher chromatin accessibility at E16.5 than E13.5 during the gonocyte stage. (C) K-mer clustering of DAD TEs based on their dynamics of chromatin accessibility over the TSS region. The number of clusters supplied as input was 4. (D) Genome browser views of representative ATAC-seq peaks categorized to each group. An asterisk marks peaks identified by Homer using ATAC-seq data at E16.5. (E) Differential transcript levels of TEs for each group in gonocytes between E16.5 and P0. The Mann–Whitney U test was used for statistical hypothesis testing. *P < 0.001. (F) Line plots of the average level of either H3K4me3 or H3K9me3 around the TSS of TEs for each group. Regions surrounding 5 kb upstream and downstream from peaks are depicted.
Fig. 2.
Fig. 2.
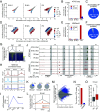
Morc1 triggers the formation of closed chromatin together with enrichment of H3K9me3 over TSSs of group I TEs. (A) Scatter plots of the normalized number of reads mapped to ATAC-seq peaks for Morc1 het and Morc1 KO gonocytes. The color of each dot indicates the range of the ratio between the two strains. Red, light red, gray, light blue, and blue indicate greater than 4, greater than 2 but no more than 4, greater than −2 but no more than 2, greater than −4 but no more than −2, and no more than −4, respectively. (B) Bar plot of the numbers of peaks that showed differential chromatin accessibility in Morc1 KO gonocytes identified by MAnorm. Red and blue bars indicate the number of peaks up-regulated and down-regulated in Morc1 KO gonocytes, respectively. (C) Pie chart of the annotation of ATAC-seq peaks with open chromatin in Morc1 KO gonocytes at P0 showing that 96.9% of them overlapped with LINE-1 or LTR-type retrotransposons. (D) Scatter plots of the normalized number of reads mapped to peaks of H3K9me3 for Morc1 het and Morc1 KO gonocytes. The value was normalized to the abundance of H3. The color of each dot indicates the range of the ratio between the two strains. Red, light red, gray, light blue, and blue indicate greater than 4, greater than 2 but no more than 4, greater than −2 but no more than 2, greater than −4 but no more than −2, and no more than −4, respectively. (E) Bar plot of the numbers of peaks that showed a differential level of H3K9me3 in Morc1 KO gonocytes identified by MAnorm. Red and blue bars indicate the number of peaks up-regulated and down-regulated in Morc1 KO gonocytes, respectively. (F) Pie chart of the annotation of ChIP-seq peaks with less H3K9me3 signals in Morc1 KO gonocytes at P0 showing 95.1% of them overlapped with LINE-1 or LTR-type retrotransposons. (G) Metaplot and heatmap plot analysis of the abundance of H3K9me3 surrounding ATAC-seq peaks that showed significantly higher accessibility in Morc1 KO gonocytes compared with Morc1 het gonocytes at P0. Regions spanning 5 kb upstream and downstream from peak regions are depicted. (H) Temporal transition of H3K9me3 abundance around TSSs of TEs in each group. The H3K9me3 level on group I TEs was more recovered at P0 than that of the other two groups. (I) Expression profile of Morc1 during the gonocyte stage. (J) ATAC-seq and H3K9me3 profiles of Morc1 het and Morc1 KO gonocytes at E16.5 and P0. The positions of LINE-1 and LTR-type retrotransposons from the RepeatMasker database are shown at the bottom. Gray boxes indicate regions showing a difference between Morc1 het and Morc1 KO gonocytes. (K) Pie chart showing the percentages of TEs repressed by Morc1 among TEs in each TE group. (L) As described in (G), but the depicted genomic coordinates were TSSs of group I TEs. (M) MAplot of RNA-seq reads mapped to TEs in Morc1 KO and Morc1 het gonocytes. Blue dots indicate individual TEs that were differentially expressed between Morc1 KO and Morc1 het gonocytes (FDR < 0.05). (N) Number of TE copies that were significantly up-regulated or down-regulated in Morc1 KO gonocytes compared with Morc1 het gonocytes (log2 FC > 1 or log2 FC < 1, FDR < 0.05). (O) Boxplots showing the abundance of transcripts from group I TEs in Morc1 KO and Morc1 het gonocytes. A t test was applied for statistical hypothesis testing. *P < 0.001.
Fig. 3.
Fig. 3.
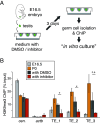
SetDB1 deposits H3K9me3 onto Morc1-dependent TEs in gonocytes. (A) Scheme of gonocytes in vitro culture. Testes were excised from E16.5 embryos. The embryo harbored a heterothallic Ddx4-Venus transgene, so that germ cells could be isolated by fluorescence. (B) ChIP-qPCR analysis of H3K9me3. The names of four samples used were indicated in the box: E16.5, germ cells isolated from E16.5 testes; P0, germ cells isolated from P0 testis; with DMSO, germ cells isolated from testis cultured in vitro for 2 d with DMSO; with inhibitor, germ cells isolated from testes cultured in vitro for 4 d with a SetDB1 inhibitor. The promoter region of β-actin (actb) and the pericentromeric region (cen.) were used as negative and positive controls, respectively. Three TE regions tested were among Morc1-dependent TEs. A t test was applied for statistical hypothesis testing. *P < 0.05.
Fig. 4.
Fig. 4.
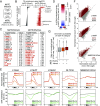
Certain subclasses of TEs acquire H3K9me3 in a Morc1-dependent manner accompanied by little or opposite effect on DNA methylation. (A) Venn diagram showing overlaps between peaks that lost H3K9me3 in Morc1 KO gonocytes and differentially methylated regions (DMRs) defined in a previous study (30). (B) Families/subfamilies of TEs were sorted by the extent to which certain TEs were enriched in MdTE (K9me3) (Methods). Enrichment values are also shown for MdTE (DNAme) on the right and sorted by the order of MdTE (K9me3) on the left. (C) Top 20 TE families/subfamilies of MdTE (K9me) and MdTE (DNAme). TEs in red are not shared between the two lists. Values shown were calculated as described in (B). (D) Subtracted difference of the DNAme level between Morc1 het and Morc1 KO gonocytes at MdTE (K9me3). The number of TEs with a value under 50% and 25% are shown. (E) Line plots showing the average level of H3K9me3 (Top) and DNAme (Bottom) over regions around each TE family/subfamily in Morc1 KO and Morc1 het gonocytes. (F) Scatter plots showing normalized reads of TEs in three TE families/subfamilies in Morc1 KO and Morc1 het gonocytes. (G) Box plots of the ratio of chromatin accessibility between Morc1 KO and Morc1 het gonocytes for three TE categories: TEs that lose H3K9me3 and DNAme in Morc1 KO gonocytes, TEs that lose only H3K9me3 in Morc1 KO gonocytes, and TEs with no significant change in H3K9me3 or DNAme in Morc1 KO gonocytes.
Fig. 5.
Fig. 5.
A substantial number of TEs targeted by Morc1 are preferentially repressed by Miwi2. (A) Temporal change of the abundance of Miwi2 transcripts during the gonocyte stage. Shaded gray indicates the pattern of Morc1 expression shown in Fig. 2H. (B) Venn diagram showing the overlaps between peaks that lost H3K9me3 in Morc1 KO and Miwi2 KO gonocytes (45). (C) Average plots showing the H3K9me3 level in Morc1 het and Morc1 KO gonocytes over H3K9me3 peaks dependent on Miwi2 (Left). Average plots showing the H3K9me3 level in Miwi2 het and Miwi2 KO gonocytes over H3K9me3 peaks dependent on Morc1 (Right). (D) Heat map showing the average level of H3K9me3 over regions containing the indicated TE families/subfamilies in Morc1 KO and Morc1 het gonocytes (Top), and Miwi2 KO and Miwi2 het gonocytes (Bottom). (E) Cumulative plots showing the distributions of piRNA reads mapped to each copy of the shown TE families. In addition to the target TEs of Morc1 (orange), Miwi2 (blue), and Trim28 (black), the plots of randomly selected TEs (gray) are also shown. The x-axis shows the number of reads mapped to each TE copy. The y-axis shows the cumulative fraction. The two-sided Kolmogorov–Smirnov test was applied for statistical hypothesis testing. *P < 0.001. (F) As described in Fig. 4D, the subtracted difference in the DNAme level between Morc1 het and Morc1 KO gonocytes at DMR in Miwi2 KO gonocytes.
Fig. 6.
Fig. 6.
Morc1 reshapes the host gene transcriptome through suppression of neighboring TEs. (A) MAplots of RNA-seq reads mapped to host genes in Morc1 KO and Morc1 het gonocytes at P0 and P3. Blue dots denote differentially expressed genes (DEG) (q < 0.001). (B) Bar plots of the number of DEGs at the indicated time points. (C) Venn diagram showing overlaps of up-regulated DEGs in Morc1 KO gonocytes between P0 and P3. (D) Line plots showing the average level of chromatin accessibility around TSS regions of up-regulated DEGs in Morc1 KO gonocytes at the indicated time points in Morc1 KO and Morc1 het gonocytes. (E) Box plots showing the distance on chromosome between MdTE (ATAC) and up-regulated genes (UP), and randomly selected genes (random). A t test was applied for statistical hypothesis testing. *P < 0.01. (F) Genome browser views of exons downstream from Morc1-dependent TEs inserted in the corresponding intron producing aberrant transcripts in Morc1 KO gonocytes. Asterisks indicate exons upstream from the same TEs. Note that such exons did not produce more transcripts in Morc1 KO gonocytes than in Morc1 het gonocytes. (G) Box plots showing the abundance of transcripts of up-regulated DEGs in Morc1 KO gonocytes using wild-type RNA-seq datasets at each developmental stage. A t test was applied for statistical hypothesis testing. *P < 0.001. (H) As described in (D), but the H3K9me3 level is plotted.
Fig. 7.
Fig. 7.
Model showing how TEs are regulated by H3K9me3, Morc1, Miwi2, and SetDB1 during the gonocyte stage. From E13.5 to E16.5, TEs lose H3K9me3 from their TSS regions, leading to their transcriptional activation together with accumulation of their transcripts. These TE-derived transcripts serve as a source of piRNAs that are loaded onto Miwi2. As gonocytes enter the P0 stage, activated TEs gain H3K9me3 and return to the transcriptionally repressed state. Morc1 and SetDB1 family proteins are involved in reestablishing heterochromatin on the TEs with the guidance of Miwi2.

References

    1. Fedoroff N. V., Transposable elements, epigenetics, and genome evolution. Science 338, 758–767 (2012). - PubMed
    1. Bourc'his D., Xu G. L., Lin C. S., Bollman B., Bestor T. H., Dnmt3L and the establishment of maternal genomic imprints. Science 294, 2536–2539 (2001). - PubMed
    1. Bourc’his D., Bestor T. H., Meiotic catastrophe and retrotransposon reactivation in male germ cells lacking Dnmt3L. Nature 431, 96–99 (2004). - PubMed
    1. Sasaki H., Matsui Y., Epigenetic events in mammalian germ-cell development: Reprogramming and beyond. Nat. Rev. Genet. 9, 129–140 (2008). - PubMed
    1. Seki Y., et al. , Extensive and orderly reprogramming of genome-wide chromatin modifications associated with specification and early development of germ cells in mice. Dev. Biol. 278, 440–458 (2005). - PubMed