. 2024 Mar 19;17(828):eadh2783.
doi: 10.1126/scisignal.adh2783. Epub 2024 Mar 19.

Exercise-induced BDNF promotes PPARδ-dependent reprogramming of lipid metabolism in skeletal muscle during exercise recovery

Affiliations

Exercise-induced BDNF promotes PPARδ-dependent reprogramming of lipid metabolism in skeletal muscle during exercise recovery

Wing Suen Chan et al. Sci Signal. .

Abstract

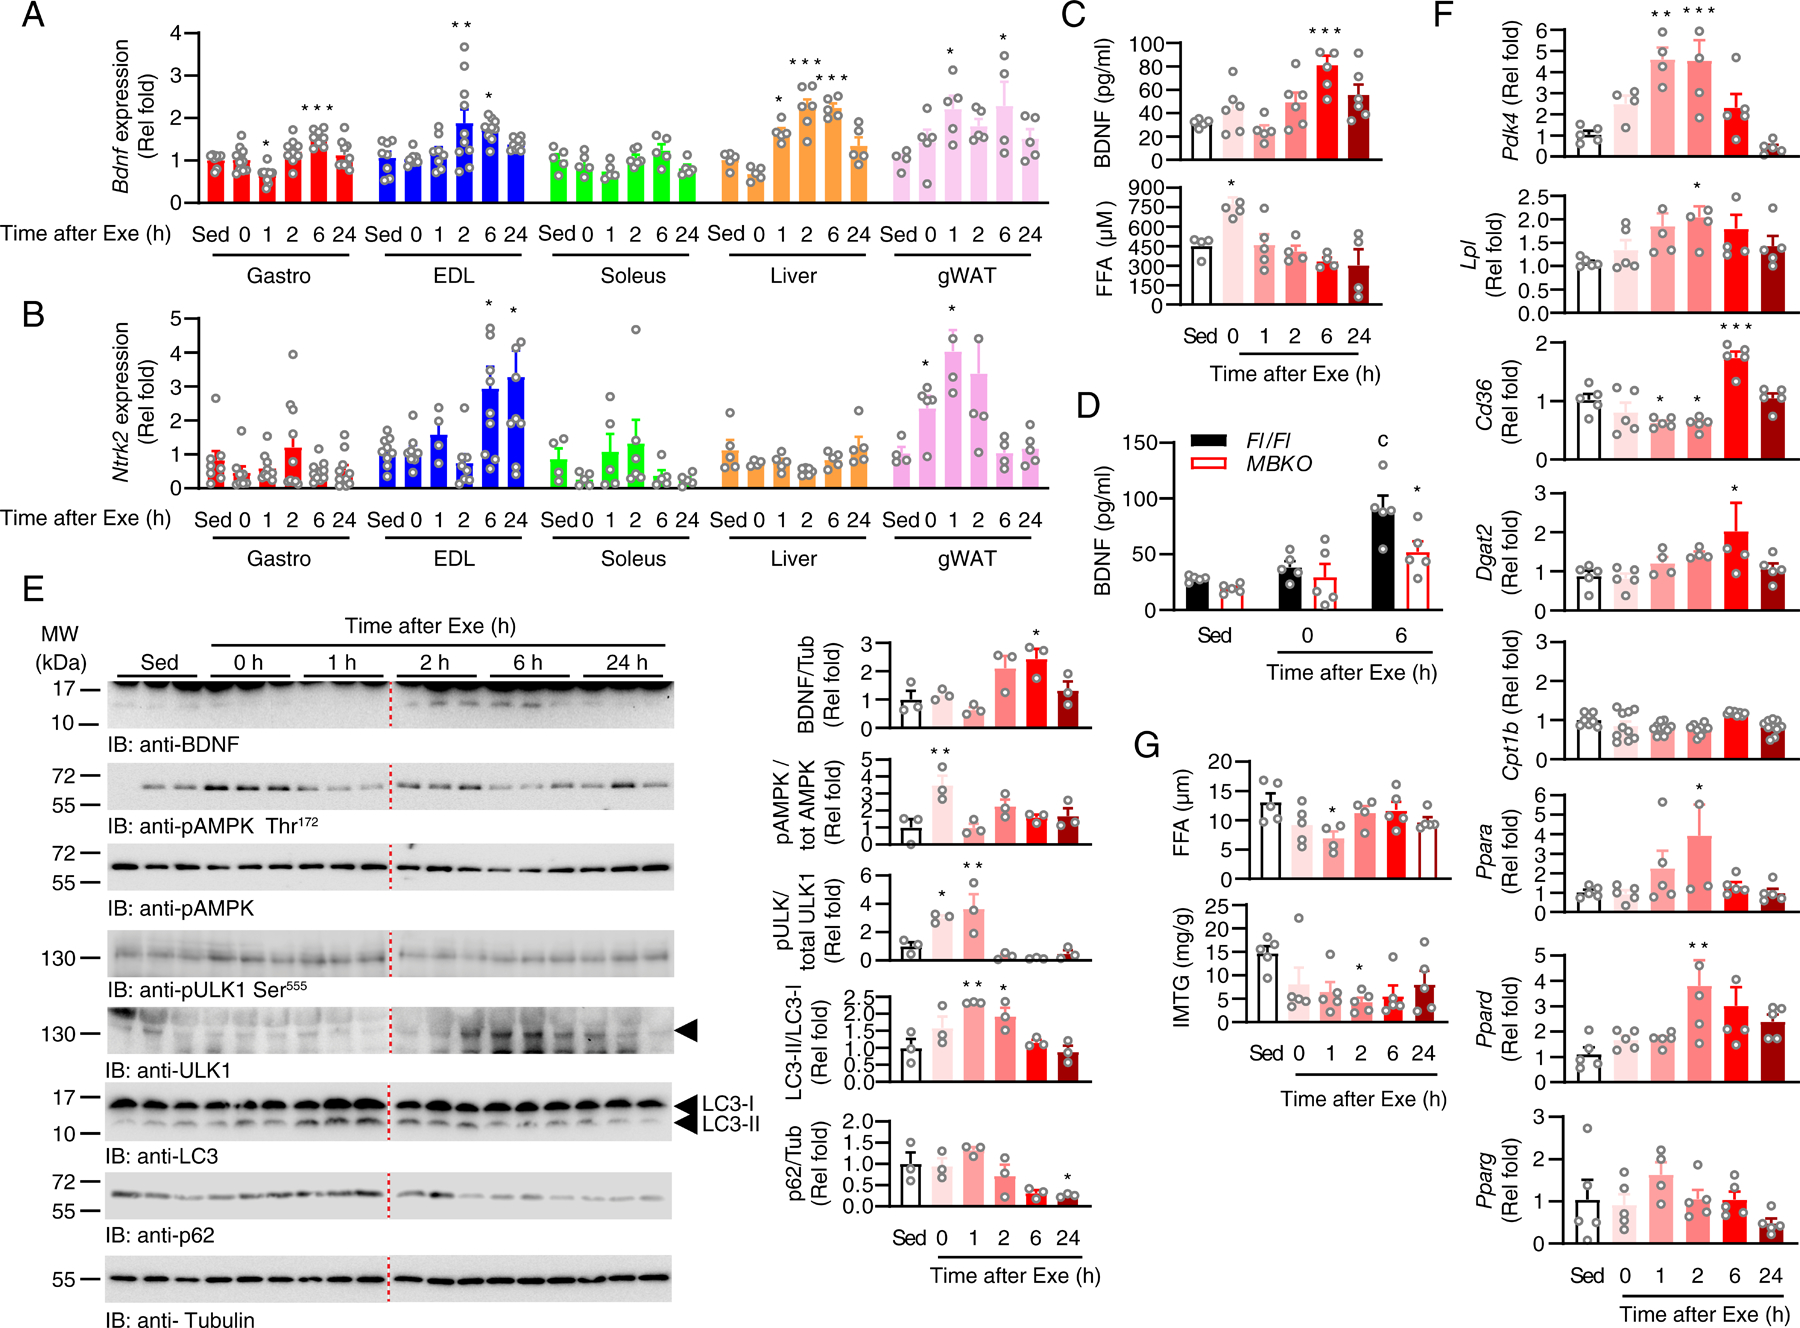
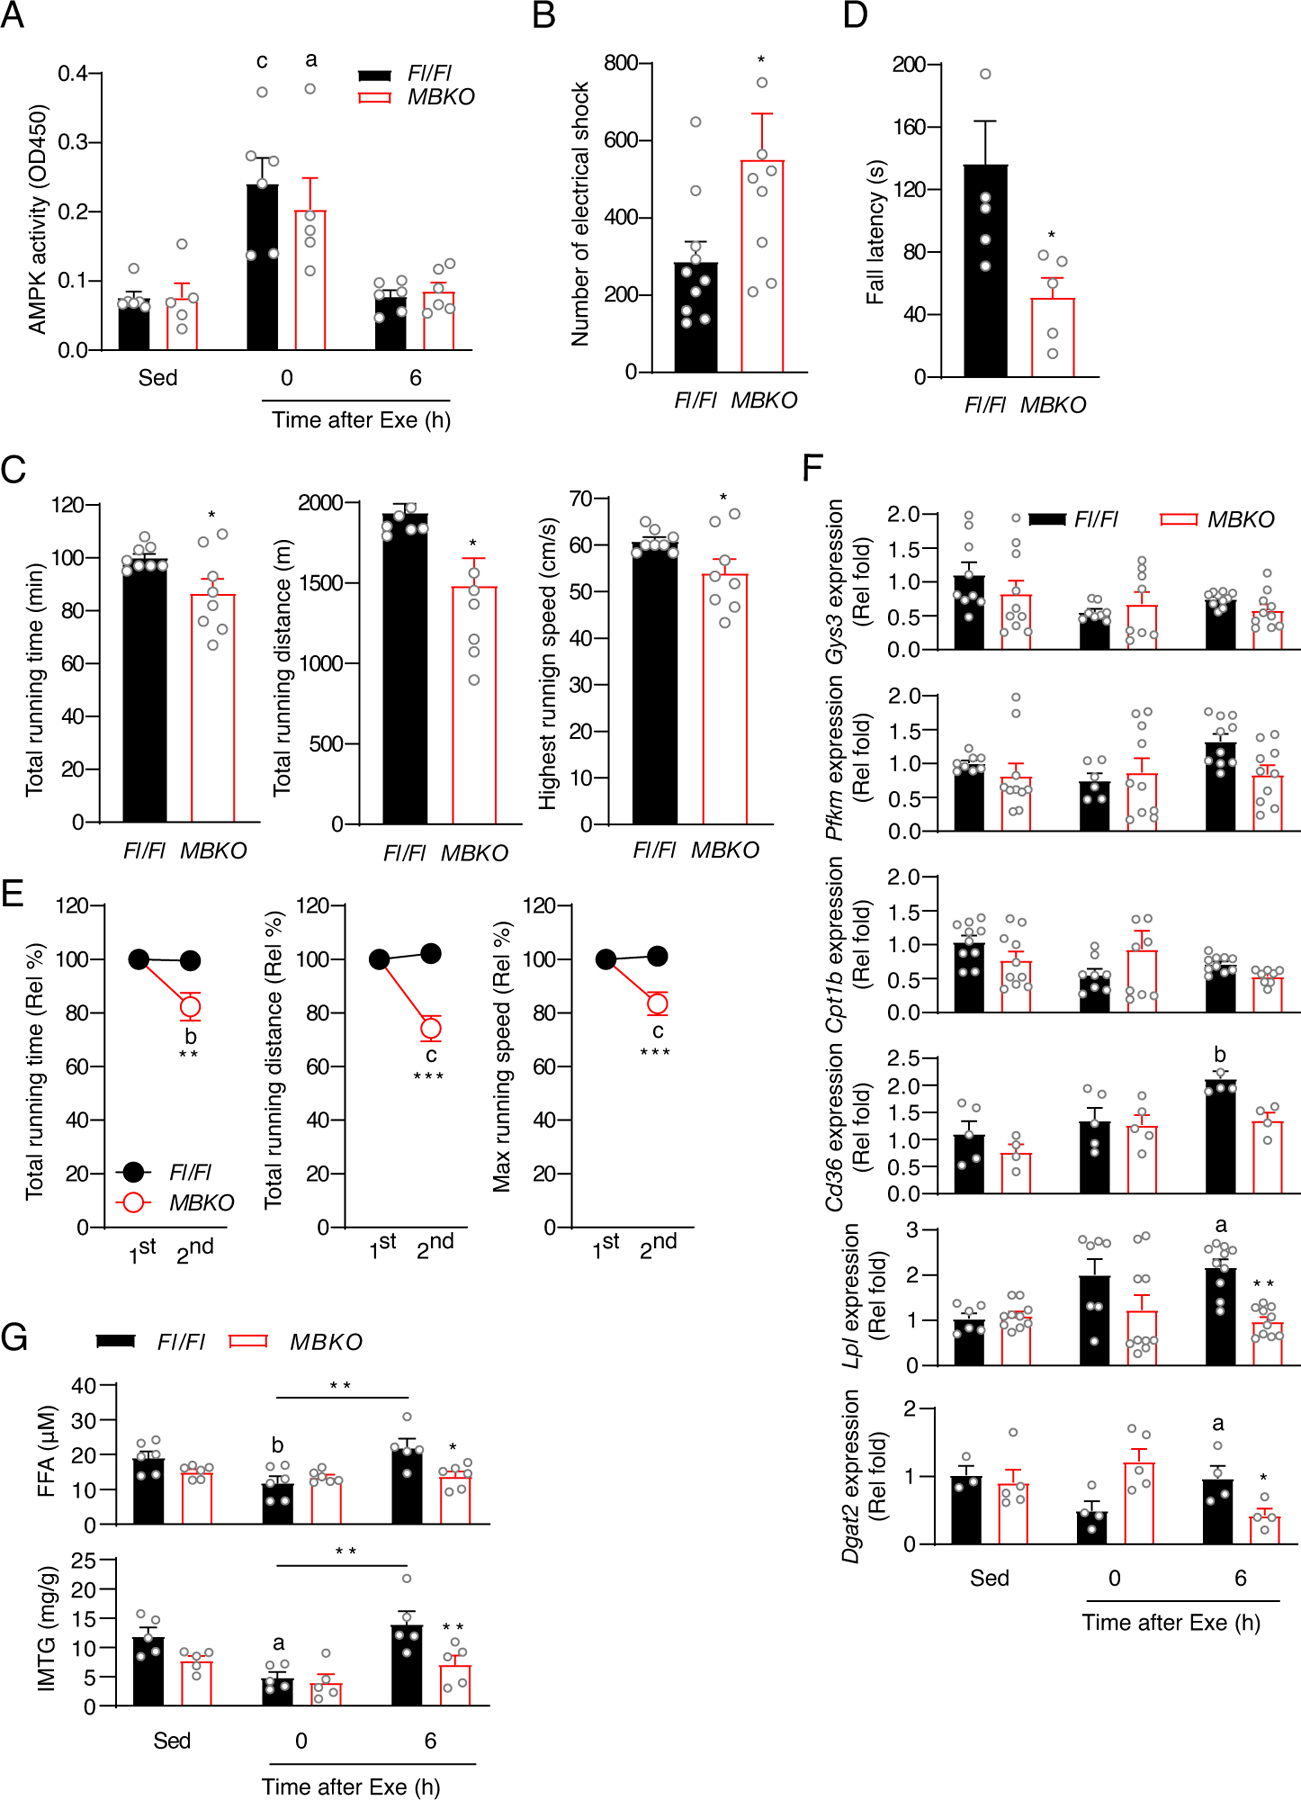
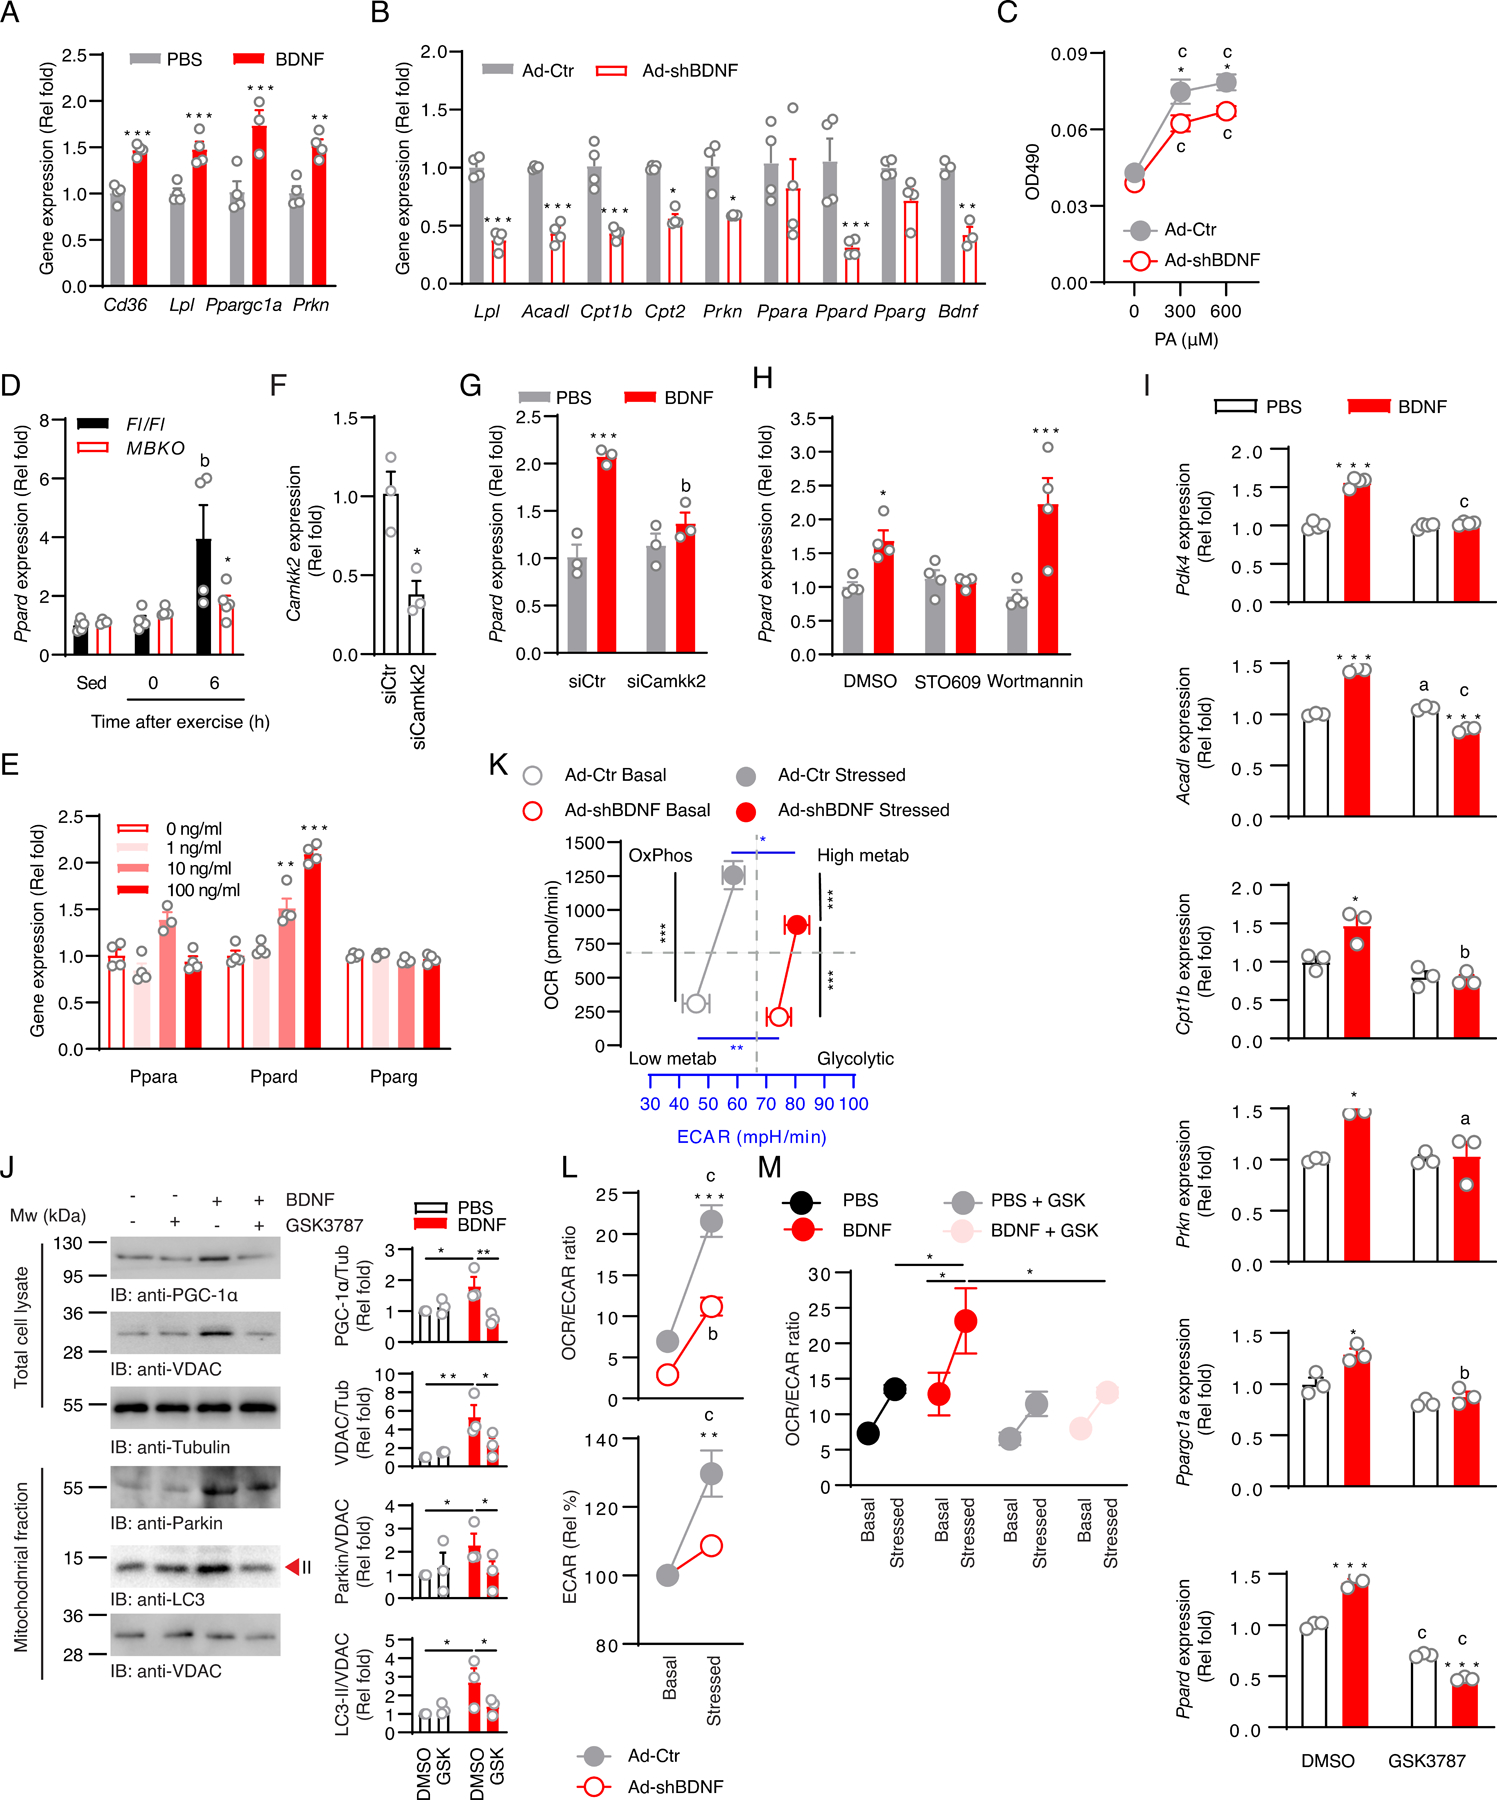
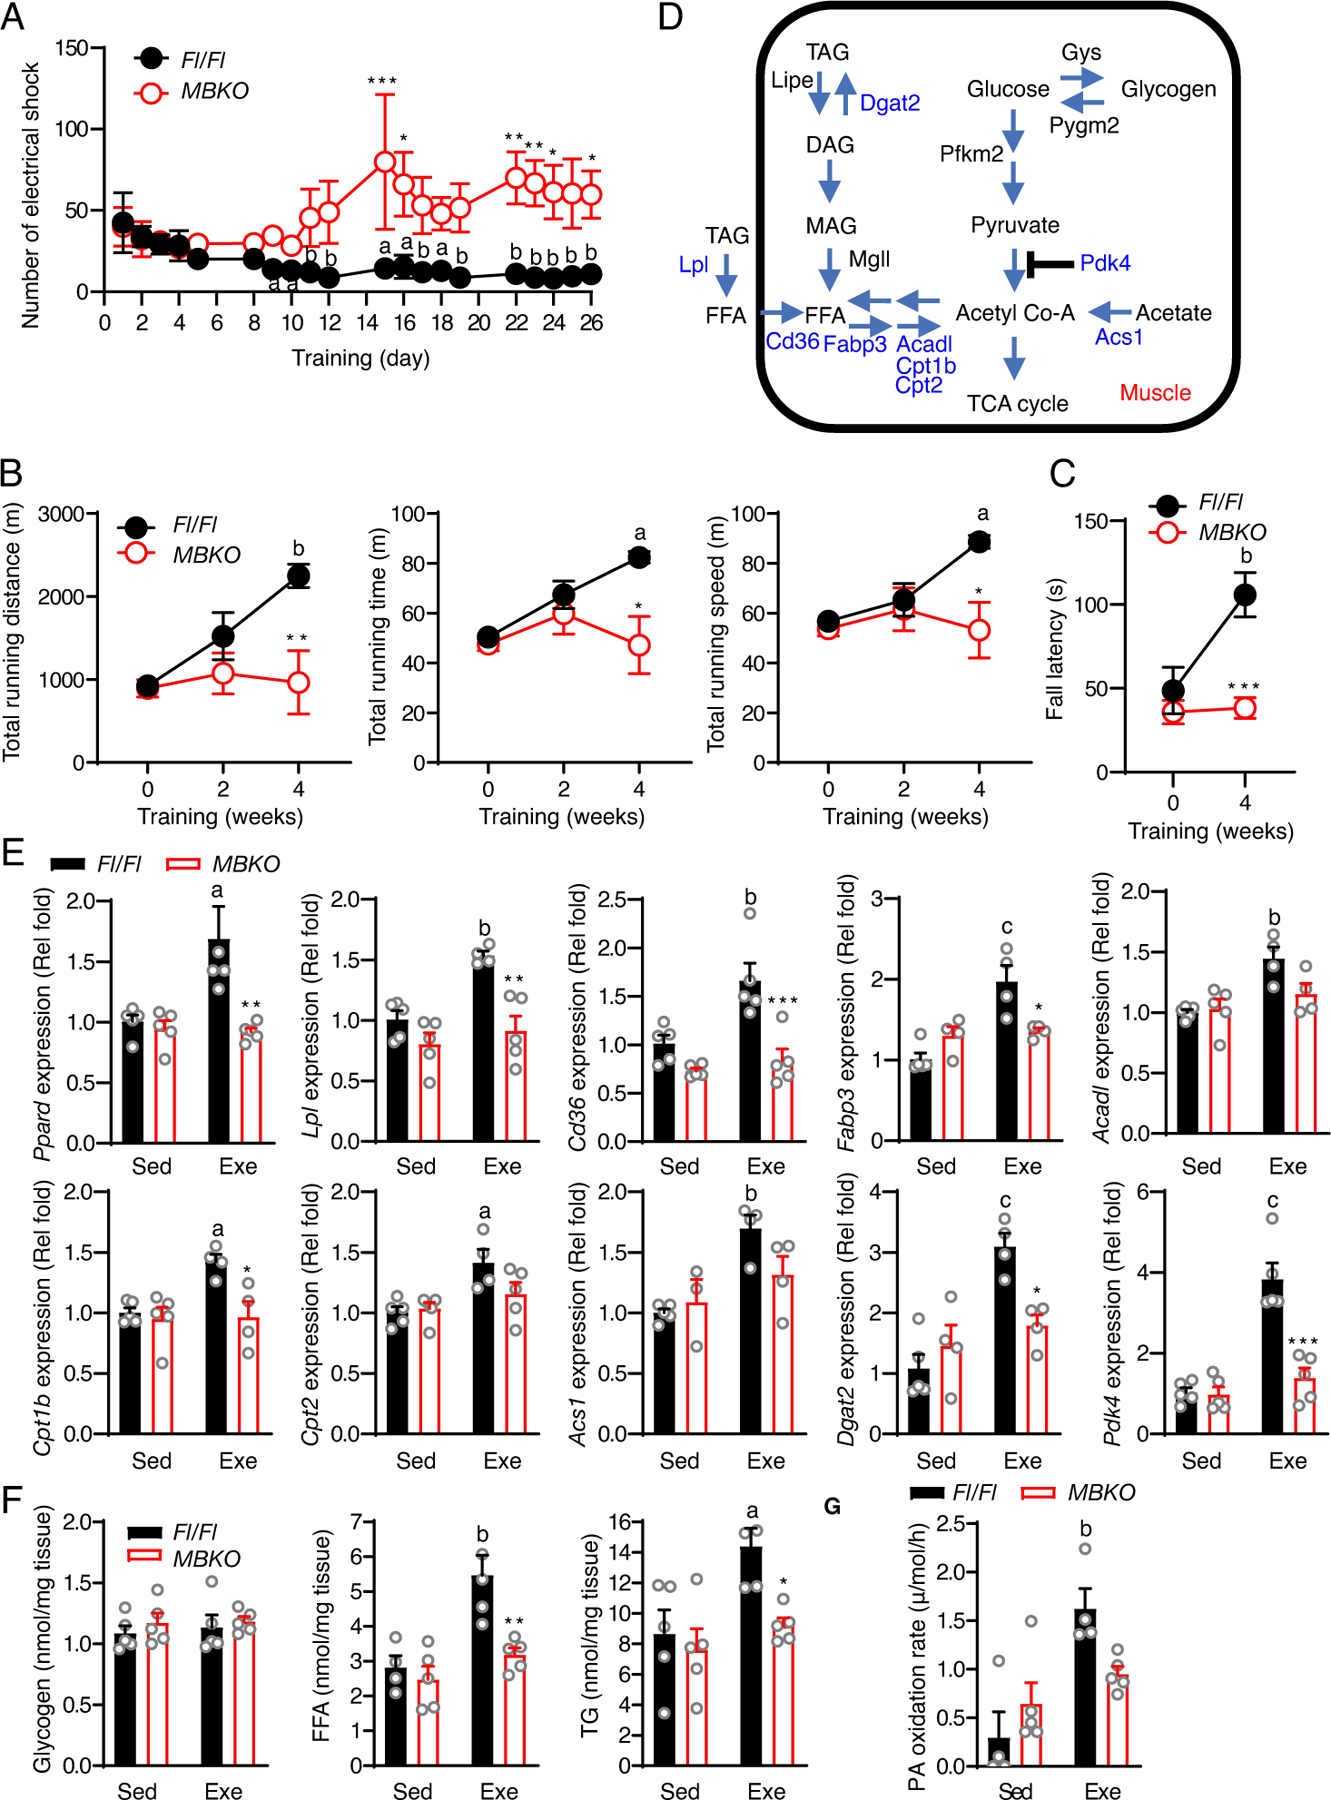
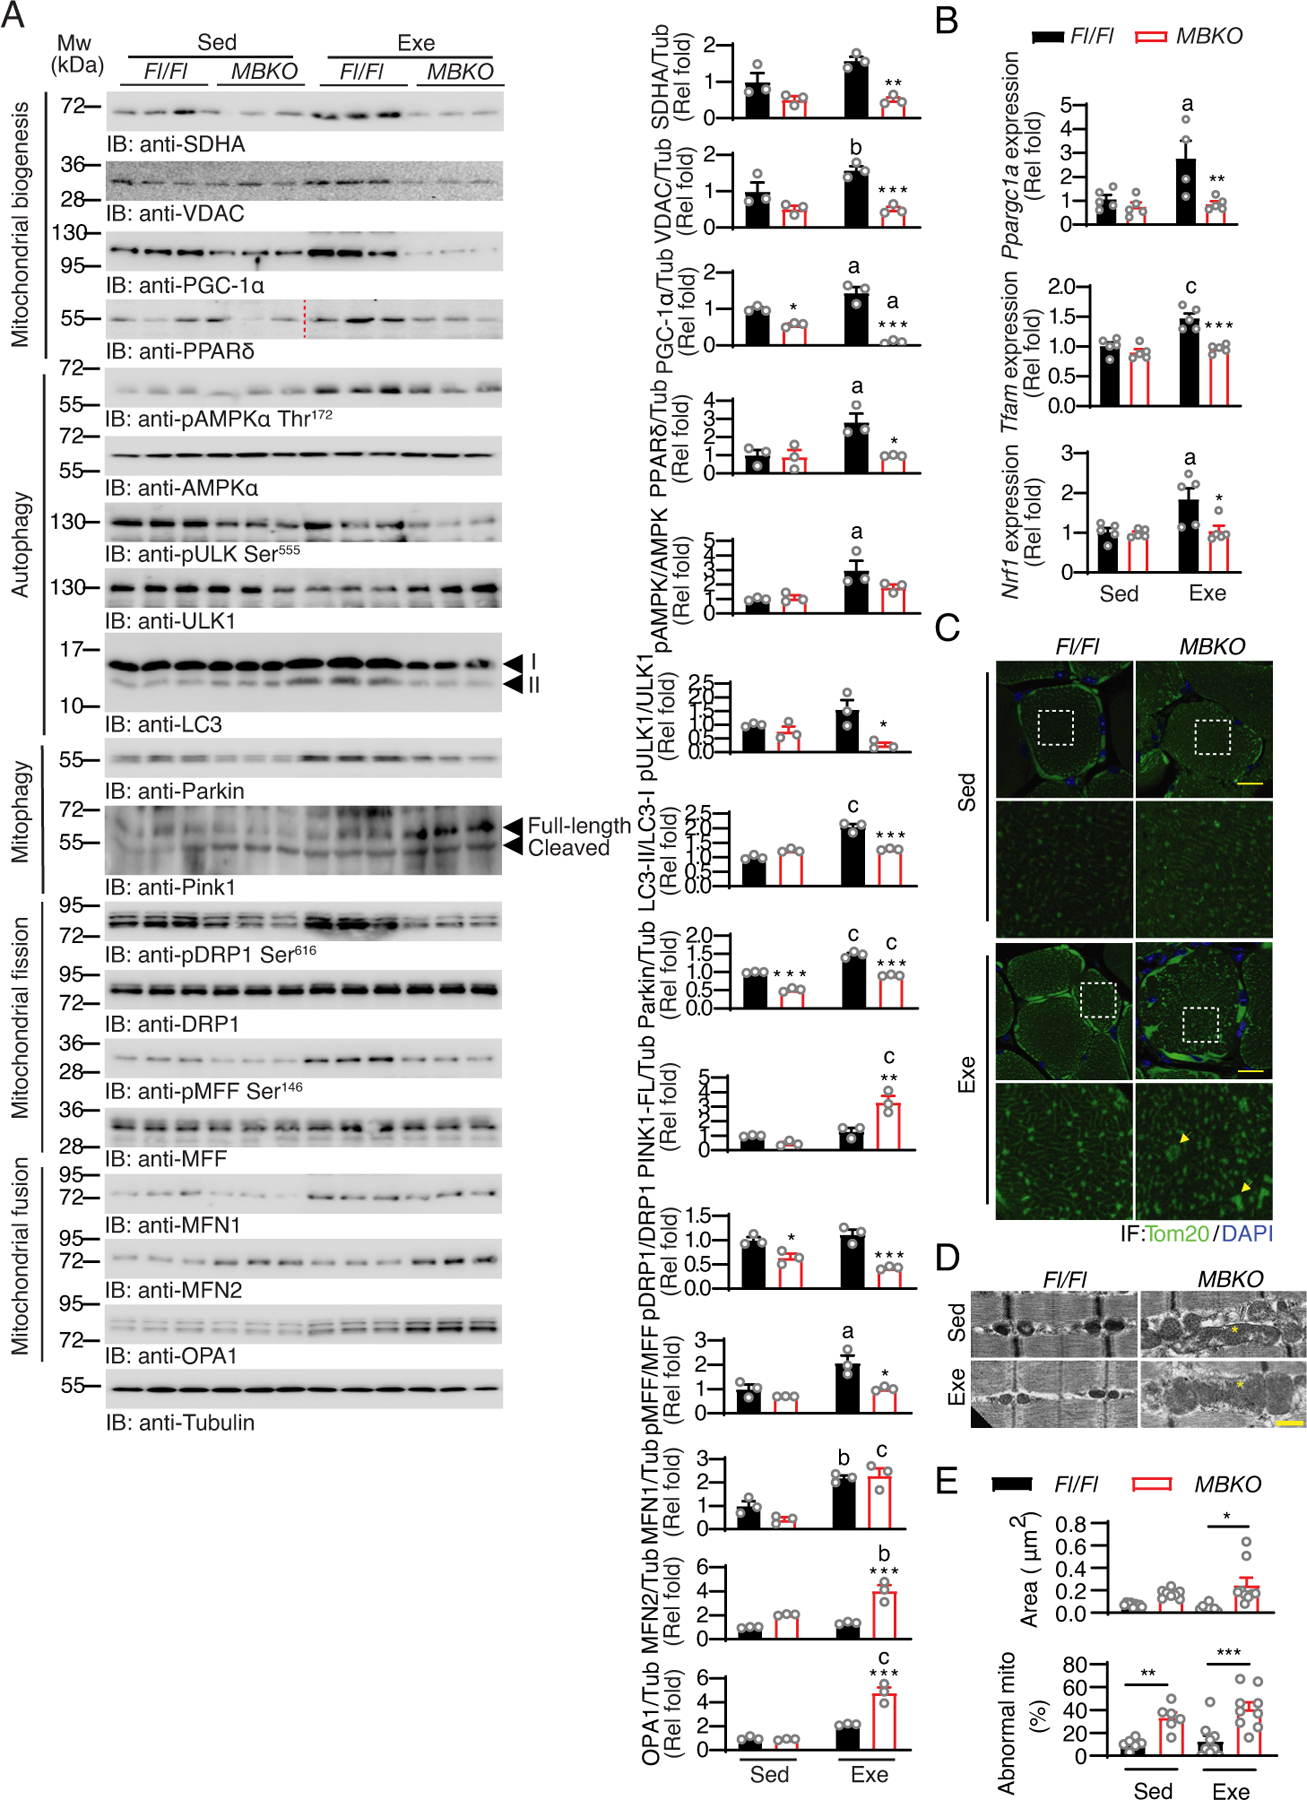
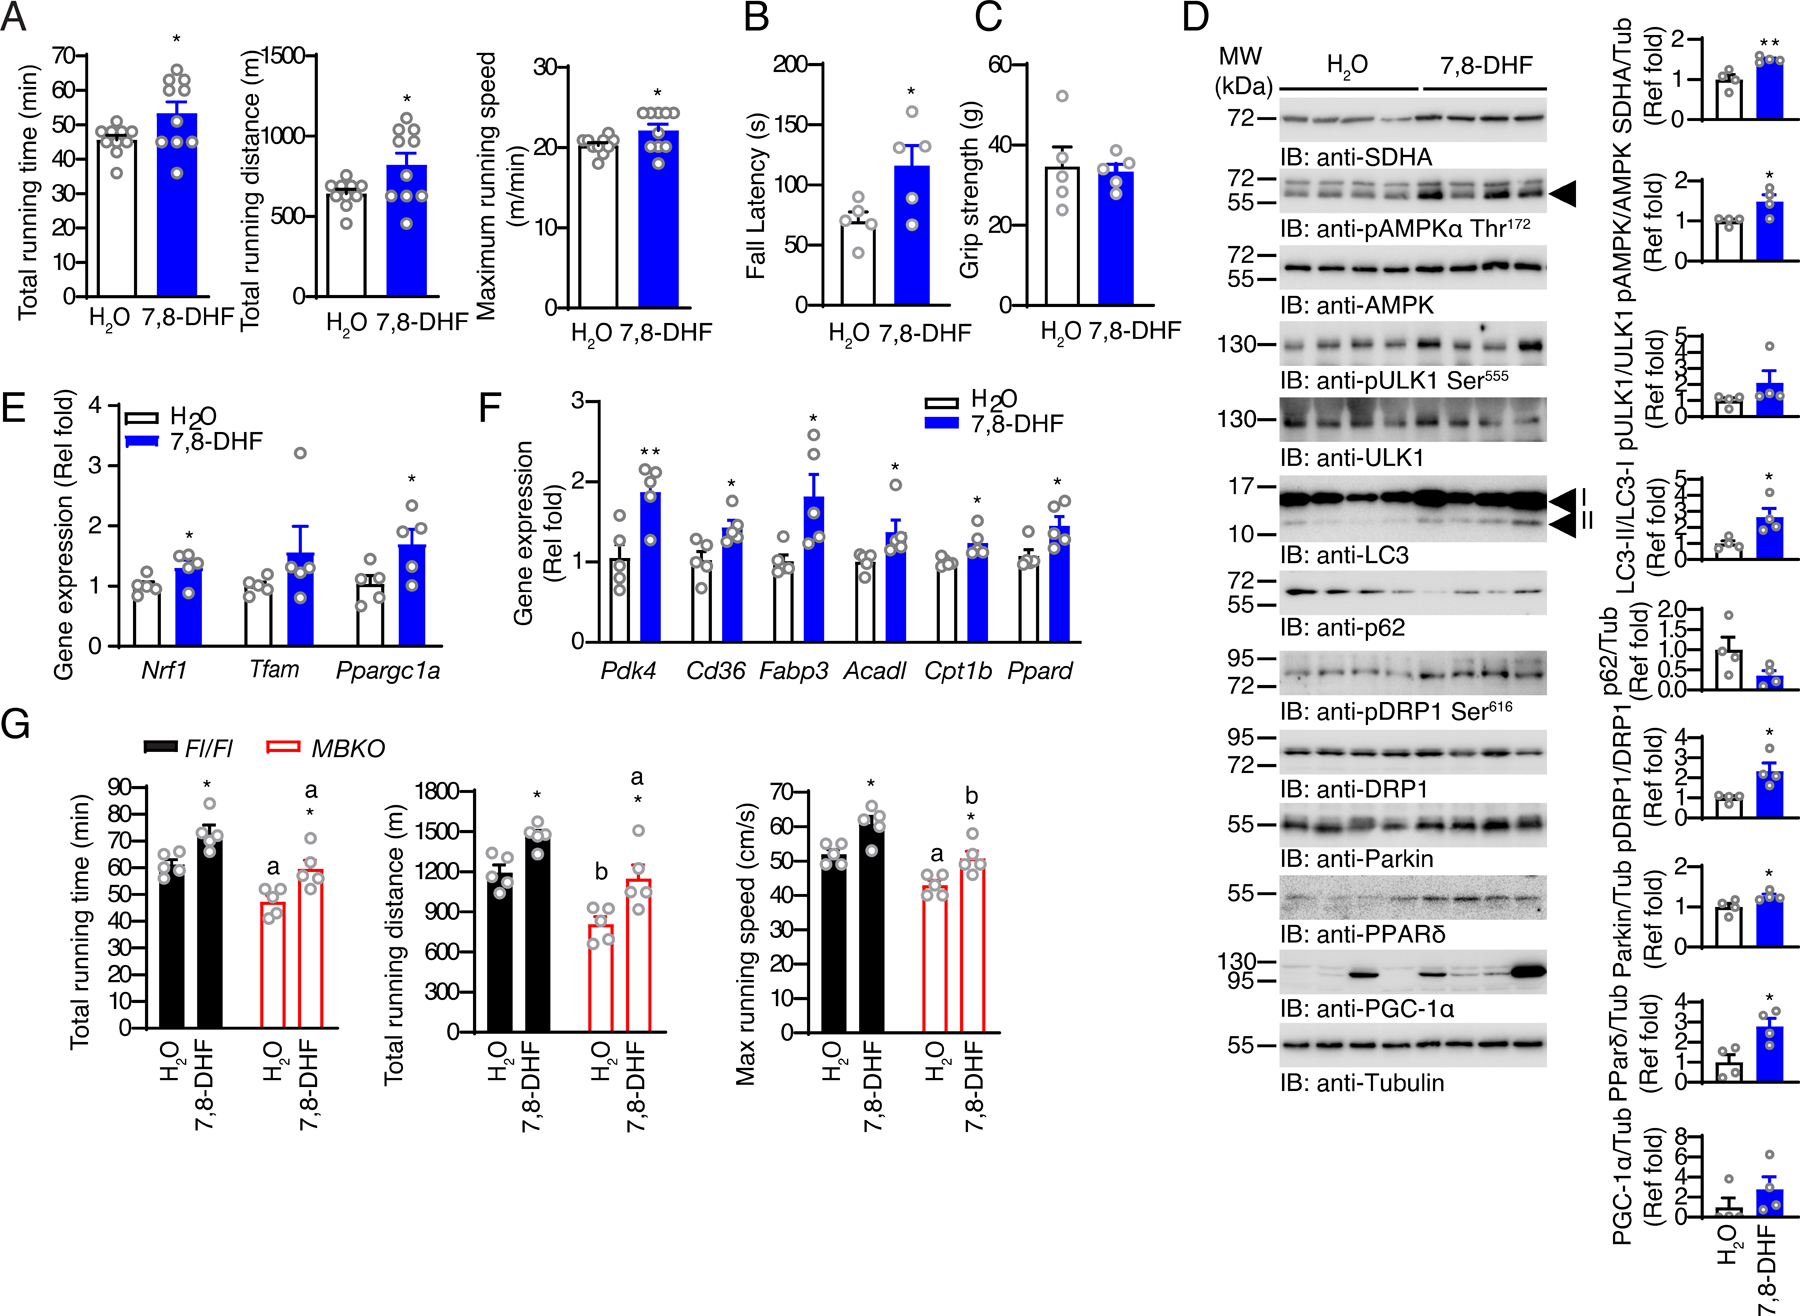
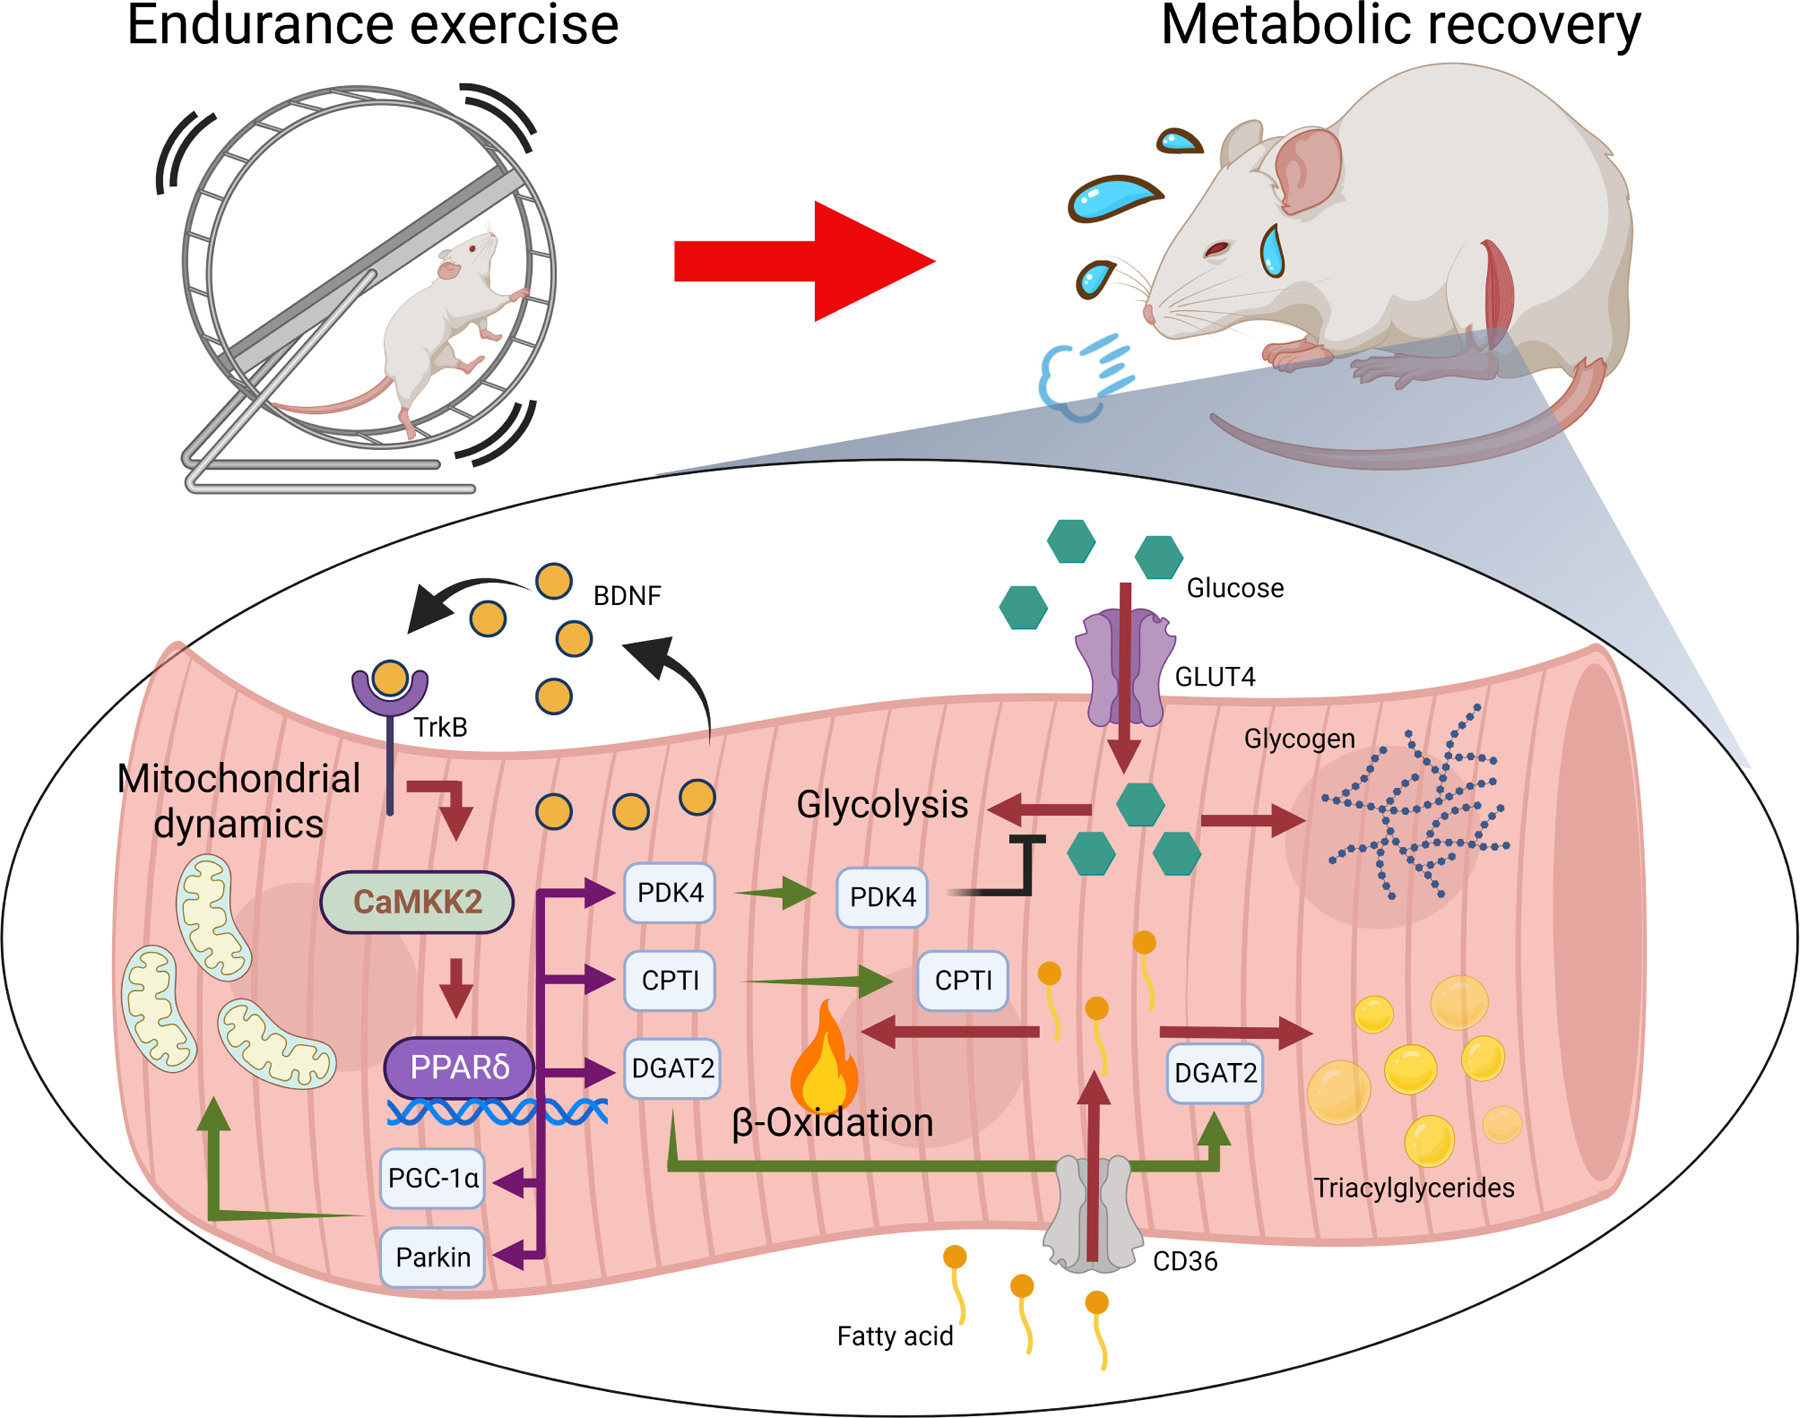
Post-exercise recovery is essential to resolve metabolic perturbations and promote long-term cellular remodeling in response to exercise. Here, we report that muscle-generated brain-derived neurotrophic factor (BDNF) elicits post-exercise recovery and metabolic reprogramming in skeletal muscle. BDNF increased the post-exercise expression of the gene encoding PPARδ (peroxisome proliferator-activated receptor δ), a transcription factor that is a master regulator of lipid metabolism. After exercise, mice with muscle-specific Bdnf knockout (MBKO) exhibited impairments in PPARδ-regulated metabolic gene expression, decreased intramuscular lipid content, reduced β-oxidation, and dysregulated mitochondrial dynamics. Moreover, MBKO mice required a longer period to recover from a bout of exercise and did not show increases in exercise-induced endurance capacity. Feeding naïve mice with the bioavailable BDNF mimetic 7,8-dihydroxyflavone resulted in effects that mimicked exercise-induced adaptations, including improved exercise capacity. Together, our findings reveal that BDNF is an essential myokine for exercise-induced metabolic recovery and remodeling in skeletal muscle.


Conflict of interest statement

COMPETING INTEREST

The authors declare that they have no competing interests.

Figures

Fig. 1.
Fig. 1.. Post-exercise induction of Bdnf expression in skeletal muscle.
(A) Expression of Bdnf in different tissues of sedentary (Sed) mice or mice that performed a single bout of endurance exercise (Exe) (*: P<0.05, **: P<0.01, ***: P<0.001 compared to Sed, one-way ANOVA, n=5–10 mice/group). (B) Expression of Ntrk2 in different tissues of sedentary (Sed) mice or mice that performed a single bout of endurance exercise (Exe) (*: P<0.05 compared to Sed, one-way ANOVA, n=5–10 mice/group). (C) Circulating BDNF and free fatty acid (FFA) content in sedentary (Sed) mice or mice that performed after a single bout of endurance exercise (*: P<0.05, ***: P<0.001 compared to Sed, one-way ANOVA, n=4–6 mice/group). (D) Circulating BDNF content in Fl/Fl and MBKO mice after a single bout of endurance exercise (c: P<0.001 compared to Sed, *: P<0.05 compared to Fl/Fl for the same treatment, two-way ANOVA, n=5 mice/group). (E) Immunoblotting analysis of signaling molecules in the gastrocnemius muscle of sedentary (Sed) mice or mice that performed a single bout of endurance exercise (Exe). The arrowhead indicates the band with the correct molecular mass. Bar graphs show quantification of immunoblot signals (*: P<0.05, **: P<0.01 compared to Sed, one-way ANOVA, n=3 mice/group). (F) Expression of metabolic genes in the muscle of sedentary (Sed) mice or mice that performed a single bout of endurance exercise (Exe) (*: P<0.05, **: P<0.01, ***: P<0.001 compared to Sed, one-way ANOVA, n=4–10 mice/group). (G) The concentration of FFA and intramyocellular triacylglycerides (IMTG) in the gastrocnemius muscle of sedentary (Sed) mice or mice that performed a single bout of endurance exercise (Exe) (*: P<0.05 compared to Sed, one-way ANOVA, n=5 mice/group).
Fig. 2.
Fig. 2.. Deficiency of BDNF production in muscle impairs exercise performance and post-exercise lipid metabolism
(A) AMPK activity as determined by ELISA in the gastrocnemius muscles of Fl/Fl and MBKO mice that performed a single bout of endurance exercise (n=5–6 mice/group). (B) The number of electrical shocks received by Fl/Fl and MBKO mice during the exhaustive running test (*: P<0.05, Student’s t-test, n=8–10 mice/group). (C) Running capacity of Fl/Fl and MBKO mice during the exhaustive running test (*: P<0.05, Student’s t-test, n=8 mice/group). (D) Duration of wire hanging of Fl/Fl and MBKO mice during the 4-limb hanging test (*: P<0.05, Student’s t-test, n=5 mice/group). (E) Exercise performance of Fl/Fl and MBKO mice in two consecutive exhaustive running tests spaced 6 h apart (b: P<0.01, c: P<0.001 compared to the same genotype in the first test, **: P<0.01, ***: P<0.001 compared to Fl/Fl mice in the same test, two-way ANOVA, n=7 mice/group). (F) Expression of metabolic genes in the gastrocnemius muscle of sedentary (Sed) Fl/Fl and MBKO mice or mice that performed a single bout of endurance exercise (a: P<0.05, b: P<0.01 compared to the Sed group of the same genotype; *: P<0.05, **: P<0.01, ***: P<0.001 compared to Fl/Fl mice in the time interval, two-way ANOVA, n=5–10 mice/group). (G) The concentration of FFA and IMTG in the gastrocnemius muscle of sedentary (Sed) Fl/Fl and MBKO mice or mice that performed a single bout of endurance exercise (b: P<0.01 compared to the Sed group of the same genotype; *: P<0.05, ***: P<0.001 compared to Fl/Fl mice in the time interval, **:P<0.01, two-way ANOVA, n=5–6 mice/group).
Fig. 3.
Fig. 3.. BDNF controls the transcription of metabolic genes by inducing Ppard expression.
(A) Expression of metabolic genes in C2C12 myotubes stimulated with PBS or BDNF (100 ng/ml, 24 h) (**: P<0.01, ***: P<0.001 compared to PBS, Student’s t-test, n=3–4 biological replicates/group). (B) Expression of metabolic genes in C2C12 myotubes infected with control adenovirus (Ad-Ctr) or adenovirus expressing shRNA against Bdnf (Ad-shBDNF) (*: P<0.05, **: P<0.01, ***: P<0.001 compared to Ad-Ctr, Student’s t-test, n=3–4 biological replicates/group). (C) Fatty acid accumulation as determined by Oil Red O staining in Ad-Ctr- or Ad-shBDNF-infected myotubes stimulated with palmitic acid (PA) (c: P<0.001 compared to 0 µM, *: P<0.05, compared to different Ad-shBDNF-infected cells under the same PA treatment, Student’s t-test, n=5–6 biological replicates/group). (D) Expression of Ppard in the gastrocnemius muscle of sedentary (Sed) Fl/Fl and MBKO mice or mice that performed a single bout of endurance exercise (b: P<0.01 compared to the Sed group of the same genotype; *: P<0.05 compared to Fl/Fl mice in the same time period, two-way ANOVA, n=4–6 mice/group). (E) Expression of Ppar isoforms in C2C12 myotubes stimulated with BDNF (100 ng/ml) for the indicated times (**: P<0.01, ***: P<0.001 compared to 0 ng/ml, Student’s t-test, n=4 biological replicates/group). (F) Camkk2 knockdown as assessed by real-time PCR in C2C12 myotubes transfected with siCtr (Ctr) or siCamkk2 (si) for 24 h (*: P<0.05, Student’s t-test, n=3 biological replicates/group). (G) C2C12 myotubes were transfected with control siRNA (siCtr) or siRNA against Camkk2 (siCamkk2). Twenty four hours after transfection, myotubes were stimulated with BDNF (100 ng/ml) for 24 h. Ppard expression was assessed by real-time PCR (***: P<0.001 compared to PBS, b: P<0.01 compared to BDNF, two-way ANOVA, n=3 biological replicates/group). (H) C2C12 myotubes were pre-treated with DMSO, STO609 (10 μg/ml), or Wortmannin (1 μM) for 2 h, then with PBS or BDNF (100 ng/ml) for 24 h. Ppard expression was examined by real-time PCR (*: P<0.01, ***: P<0.001 compared to PBS, two-way ANOVA, n=4 biological replicates/group). (I) Expression of PPARδ-regulated genes in C2C12 myotubes pre-treated with DMSO or the PPARδ inhibitor GSK3787 (1µM) for 1 h before being stimulated with DMSO or BDNF (100 ng/ml, 24 h) (a: P<0.05, b: P<0.01, c: P<0.001 compared to DMSO pre-treatment; *: P<0.05, **: P<0.01, ***: P<0.001 compared to PBS control, two-way ANOVA, n=3 biological replicates/group). (J) C2C12 myotubes were treated with different combinations of GSK3787 (1µM) and BDNF (100 ng/ml) for 24 h and the amounts of various proteins involved in mitochondrial biogenesis and mitophagy were measured by Western blotting. Representative blots are shown and the bars graphs show quantification of band intensities (*: P<0.05, **: P<0.01, two-way ANOVA; n=3 biological replicates/group). (K) Metabolic phenotyping of Ad-Ctr- or Ad-shBDNF-infected myotubes was assessed by extracellular flux analysis (*: P<0.05, blue **: P<0.01, ***: P<0.001, two-way ANOVA, n=4 biological replicates/group). (L) OCR/ECAR ratio and change of ECAR of Ad-Ctr- or Ad-shBDNF-infected myotubes (b: P<0.01, c: P<0.001 compared to the basal group within the same infection group; **: P<0.01, ***: P<0.001 compared to stressed Ad-shBDNF, two-way ANOVA, n=4 biological replicates/group). (M) C2C12 myotubes were treated with different combinations of GSK3787 (1µM) and BDNF (100 ng/ml) and the OCR/ECAR ratio was assessed by extracellular flux analysis (*: P<0.05, two-way ANOVA, n=5 biological replicates/group).
Fig. 4.
Fig. 4.. Endurance exercise-promoted metabolic reprogramming in skeletal muscle requires the presence of BDNF
(A) The number of electrical shocks received by Fl/Fl and MBKO mice during exercise training (a: P<0.05, b: P<0.01 compared to day 0 of the same genotype; *: P<0.05, **: P<0.01, ***: P<0.001 compared to Fl/Fl mice in the time interval, two-way ANOVA, n=4–5 mice/group). (B) The running capacity of Fl/Fl and MBKO mice after exercise training (a: P<0.05, b: P<0.01 compared to week 0 of the same genotype; *: P<0.05, **: P<0.01 compared to Fl/Fl mice in the time interval, two-way ANOVA, n=5–7 mice/group). (C) Duration of wire hanging of Fl/Fl and MBKO mice after 4 weeks of exercise training (b: P<0.01 compared to week 0 of the same genotype; ***: P<0.001 compared to Fl/Fl mice in the time interval, two-way ANOVA, n=5 mice/group). (D) Schematic of genes involved in the glucose and lipid metabolism of skeletal muscle. (E) Expression of metabolic genes in the gastrocnemius muscle of Fl/Fl and MBKO mice after 4 weeks of exercise training (Exe) (a: P<0.05, b: P<0.01, c: P<0.001 compared to the Sed group of the same genotype; *: P<0.05, **: P<0.01, ***: P<0.001 compared to Fl/Fl mice of the same training group, two-way ANOVA, n=4–5 mice/group). (F) The concentration of glycogen, free fatty acids (FFA), and intramolecular triacylglycerides (IMTG) in the gastrocnemius muscle of Fl/Fl and MBKO mice after 4 weeks of endurance exercise training (Exe) (b: P<0.01 compared to the Sed group of the same genotype; *: P<0.05, **: P<0.01 compared to Fl/Fl mice of the same training group, two-way ANOVA, n=4–5 mice/group). (G) Palmitic acid (PA) oxidation rate of cell lysates prepared from the gastrocnemius muscle of Fl/Fl and MBKO mice after 4 weeks of exercise training (Exe) (b: P<0.01 compared to the Sed group of the same genotype, two-way ANOVA, n=4-mice/group).
Fig. 5.
Fig. 5.. Exercise-induced mitochondrial remodeling is impaired in the muscle of MBKO mice
(A) Immunoblotting analysis of signaling proteins in the gastrocnemius muscle of sedentary (Sed) Fl/Fl and MBKO mice or mice that performed 4 weeks of endurance exercise training (Exe). Bar graphs show quantification of immunoblot signals (a: P<0.05, b: P<0.01, c: P<0.001 compared to the Sed group of the same genotype; *: P<−0.05, **: P<0.01, ***: P<0.001 compared to Fl/Fl mice of the same training group, two-way ANOVA, n=3 mice per group). (B) Expression of genes involved in mitochondrial biogenesis in the gastrocnemius muscle of sedentary (Sed) Fl/Fl and MBKO mice or mice that performed 4 weeks of endurance exercise training (Exe) (a: p<0.05, c: P<0.001 compared to the Sed group of the same genotype; *: P<0.05, **: P<0.01, ***: P<0.001 compared to Fl/Fl mice of the same training group, two-way ANOVA, n=5 mice per group). (C) Representative immunofluorescence staining of Tom20 and 4’,6-diamidino-2-phenylindole (DAPI) in the gastrocnemius muscle of sedentary (Sed) Fl/Fl and MBKO mice or mice that performed 4 weeks of exercise training (Exe). Magnified views of the white dashed boxes are shown in the lower panels. The yellow arrows indicate examples of enlarged mitochondria. Scale bar: 20 μm. N=1 section from 3 mice per group. (D) Representative transmission electron microscopy images showing the mitochondria morphology in the gastrocnemius muscle of sedentary (Sed) Fl/Fl and MBKO mice or mice that performed 4 weeks of endurance exercise training (Exe). The asterisk indicates enlarged mitochondria. Scale bar: 500 nm. (E) Quantification of the average area of the mitochondria and the number of enlarged mitochondrial per image are also shown (c: P<0.001 compared to the Sed group of the same genotype; **: P<0.01, ***: P<0.001 compared to Fl/Fl mice of the same training group, two-way ANOVA, N=3–6 sections from 2 mice per group).
Fig. 6.
Fig. 6.. Consumption of BDNF mimetic 7,8-DHF enhances exercise performance
(A) The running capacity of mice that consumed 7,8-DHF for 12 weeks (*: P<0.05, Student’s t-test, n=10 mice per group). (B) Up-side down hanging time of mice that consumed 7,8-DHF for 12 weeks (*: P<0.01, n=5 mice per group). (C) Total muscle strength of mice that consumed 7,8-DHF for 12 weeks as determined by the grip-strength test (n=5 mice/group, Student’s t-test). (D) Immunoblotting analysis of signaling proteins in the gastrocnemius muscle of mice that consumed 7,8-DHF for 12 weeks. Bar graphs show quantification of immunoblot signals (*: P<0.05, **: P<0.01, Student’s t-test, n=4 mice per group). (E) Expression of genes involved in mitochondrial biogenesis in the gastrocnemius muscle of mice that consumed 7,8-DHF for 12 weeks (*: P<0.05, Student’s t-test, n=5 mice per group). (F) Expression of PPARδ-regulated genes in the gastrocnemius muscle of mice that consumed 7,8-DHF for 12 weeks (*: P<0.05, **: P<0.01, Student’s t-test, n=5 mice per group). (G) The running capacity of Fl/Fl and MBKO mice that consumed 7,8-DHF for 12 weeks (*: P<0.05 compared to H2O group of the same genotype; a: P<0.01, b: P<0.001 compared to Fl/Fl mice receiving the same treatment, two-way ANOVA, n=5 mice per group).
Fig 7.
Fig 7.. Proposed role of BDNF in reprogramming muscle metabolism during recovery from endurance exercise
Expression of Bdnf in skeletal muscle is induced during the late recovery phase to change fuel utilization preference and restock intramyocellular lipid reserves through PPARδ-induced gene expression. It also promotes mitochondrial biogenesis and recycling after repeated exercise training, leading to improvements in oxidative metabolism and muscle performance.

References

    1. Ehrenborg E, Krook A, Regulation of skeletal muscle physiology and metabolism by peroxisome proliferator-activated receptor delta. Pharmacol Rev 61, 373–393 (2009); published online EpubSep (10.1124/pr.109.001560). - DOI - PubMed
    1. Lundsgaard AM, Fritzen AM, Kiens B, The Importance of Fatty Acids as Nutrients during Post-Exercise Recovery. Nutrients 12, (2020); published online EpubJan 21 (10.3390/nu12020280). - DOI - PMC - PubMed
    1. Burke L, Fasting and recovery from exercise. Br J Sports Med 44, 502–508 (2010); published online EpubJun (10.1136/bjsm.2007.071472). - DOI - PubMed
    1. Betts JA, Williams C, Short-term recovery from prolonged exercise: exploring the potential for protein ingestion to accentuate the benefits of carbohydrate supplements. Sports Med 40, 941–959 (2010); published online EpubNov 1 (10.2165/11536900-000000000-00000). - DOI - PubMed
    1. van Loon LJ, Koopman R, Stegen JH, Wagenmakers AJ, Keizer HA, Saris WH, Intramyocellular lipids form an important substrate source during moderate intensity exercise in endurance-trained males in a fasted state. J Physiol 553, 611–625 (2003); published online EpubDec 1 (10.1113/jphysiol.2003.052431). - DOI - PMC - PubMed

LinkOut - more resources