. 2024 May;11(20):e2307319.
doi: 10.1002/advs.202307319. Epub 2024 Mar 19.

Morusin Alleviates Aortic Valve Calcification by Inhibiting Valve Interstitial Cell Senescence Through Ccnd1/Trim25/Nrf2 Axis

Affiliations

Morusin Alleviates Aortic Valve Calcification by Inhibiting Valve Interstitial Cell Senescence Through Ccnd1/Trim25/Nrf2 Axis

Zongtao Liu et al. Adv Sci (Weinh). 2024 May.

Abstract

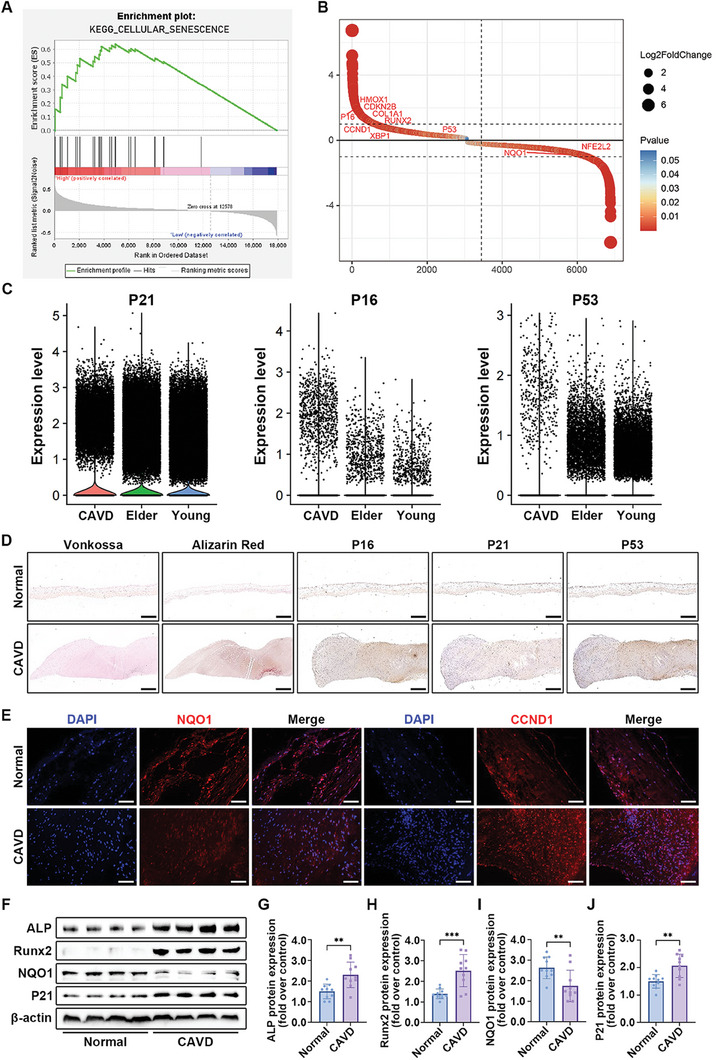
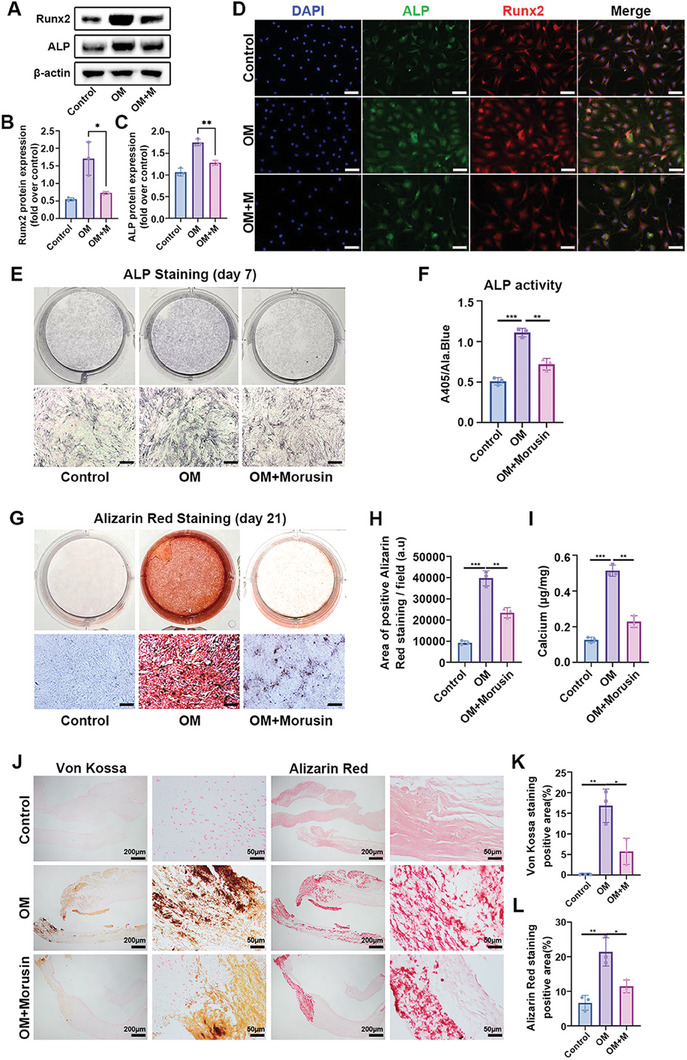
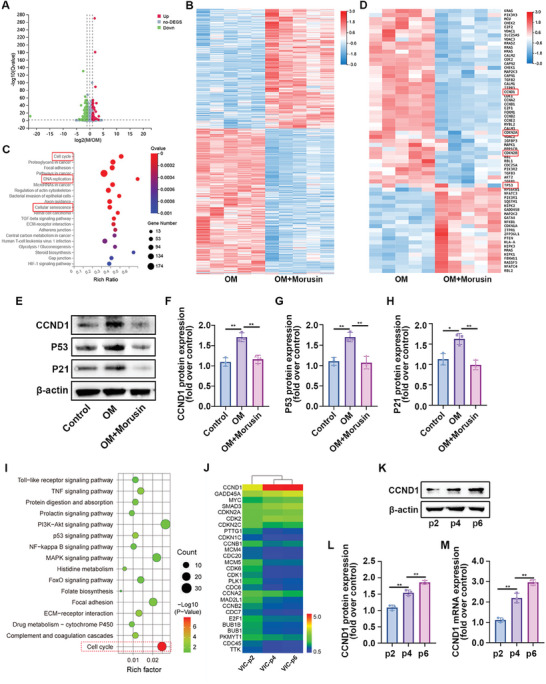
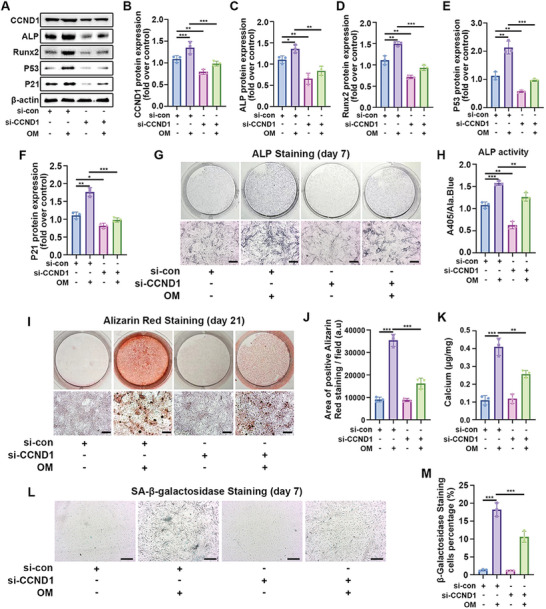
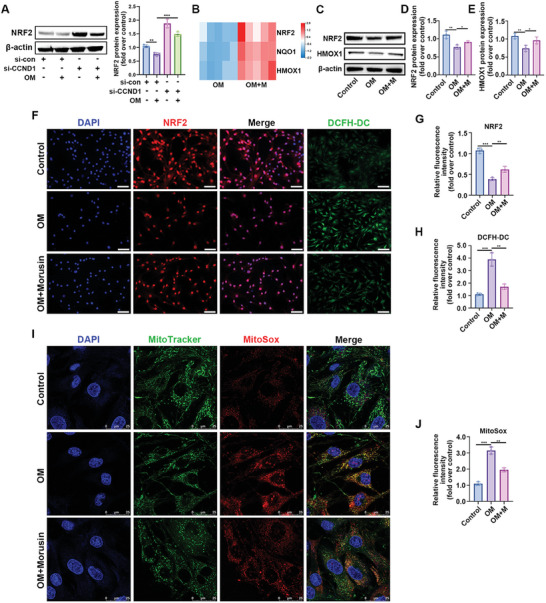
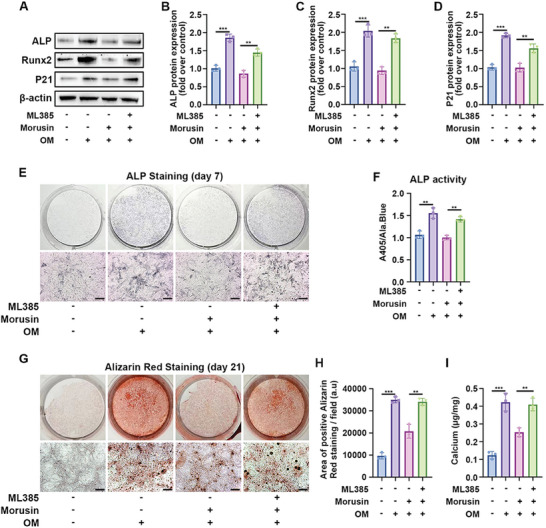
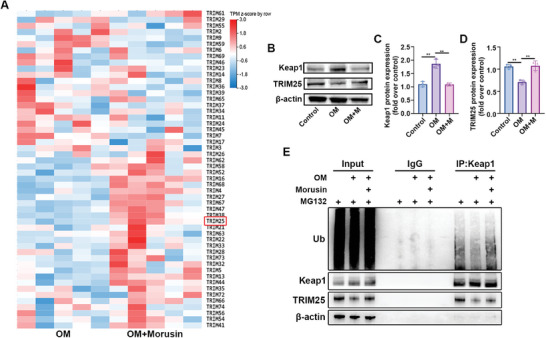
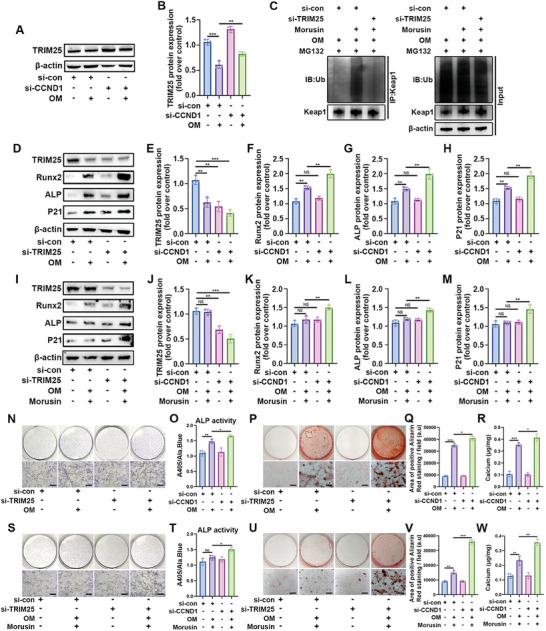
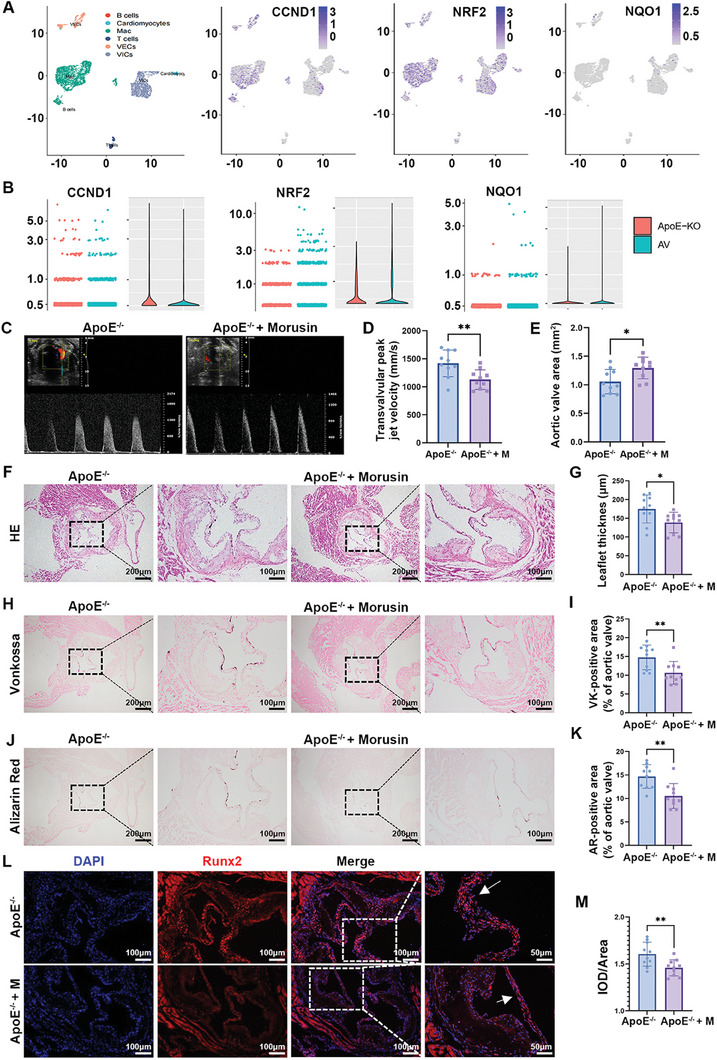
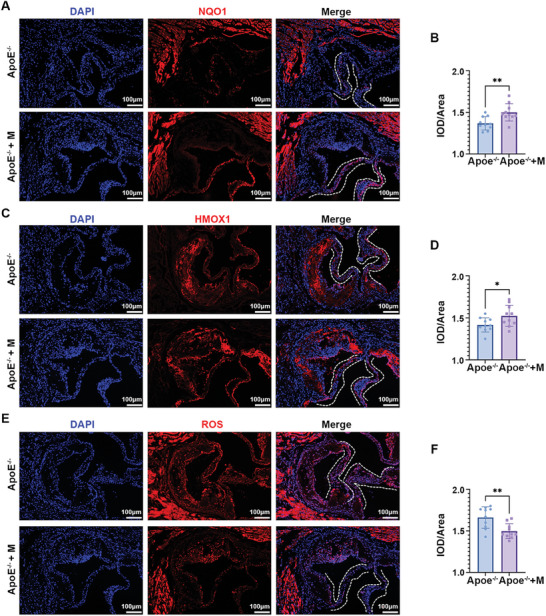
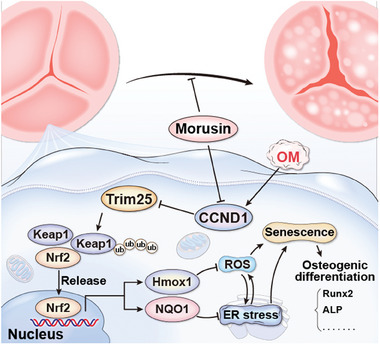
The senescence of aortic valve interstitial cells (VICs) plays a critical role in the progression of calcific aortic valve disease (CAVD). However, the precise mechanisms underlying the senescence of VICs remain unclear, demanding the identification of a novel target to mitigate this process. Previous studies have highlighted the anti-aging potential of morusin. Thus, this study aimed to explore the therapeutic potential of morusin in CAVD. Cellular experiments reveal that morusin effectively suppresses cellular senescence and cause a shift toward osteogenic differentiation of VICs in vitro. Mechanistically, morusin activate the Nrf2-mediated antiaging signaling pathway by downregulating CCND1 expression and aiding Keap1 degradation through Trim 25. This activation lead to the upregulated expression of antioxidant genes, thus reducing reactive oxygen species production and thereby preventing VIC osteogenic differentiation. In vivo experiments in ApoE-/- mice on a high-fat Western diet demonstrate the positive effect of morusin in mitigating aortic valve calcification. These findings emphasize the antiaging properties of morusin and its potential as a therapeutic agent for CAVD.

Keywords: antiaging; calcific aortic valve disease; molecular target; natural product.


Conflict of interest statement

The authors declare no conflict of interest.

Figures

Figure 1
Figure 1
Cellular senescence is associated with aortic valve calcification. A) GSEA plot showing differential expression of signature genes in the cellular senescence pathway in calcific valve and normal valvular tissue based on the RNA‐seq data sets from the GEO database. B) DEG plot showing the differential expression genes between the calcific valve and normal valvular tissue. C) Violin plots representing the expression of P21, P16, and P53 in the aortic valve from CAVD patients, elder and young individuals. D) Representative Vonkossa staining, Alizarin red staining, and immunohistochemical staining of P16, P21, and P53 in aortic valves from CAVD patients and controls. Scale bar 200 µm. E) Immunofluorescent staining of NQO‐1 (red), CCND1 (red), and DAPI (blue) in the aortic valve from CAVD patients and controls. Scale bar 100 µm. F) Protein expression of ALP, Runx2, NQO1, and P21 in the aortic valve from CAVD patients (n = 10) and controls (n = 10). Bar plots representing the fold change of specific protein expression over control. Data are means ± SD. ** p < 0.01; *** p < 0.001 (unpaired two‐tailed Student's t‐test).
Figure 2
Figure 2
Morusin inhibits OM‐induced osteogenic differentiation of VICs. A) Immunoblot analysis of Runx2 and ALP expression in VICs from indicated groups (n = 3, each group). B) Bar plot showing the fold change of Runx2 expression over control. C) Bar plot showing the fold change of ALP expression over control. D) Immunofluorescent staining of ALP (green), Runx2 (red), and DAPI (blue) in the VICs from indicated groups. Scale bar 50 µm. E,F) With OM induction for 7 days, representative ALP staining of VICs from indicated groups (n = 3, each group). Scale bar 50 µm. G–I) With OM induction for 21 days, representative Alizarin red staining showed the calcific nodules in VICs from indicated groups (n = 3, each group). Scale bar 50 µm. J) With OM induction for 21 days, representative Von Kossa and Alizarin Red staining of aortic valve leaflets. K) Bar plot showing the percentage of Von Kossa positive staining area of indicated groups (n = 3, each group). L) Bar plot showing the percentage of Alizarin Red positive staining area of indicated groups (n = 3, each group). Data are mean ± SD. * p < 0.05; ** p < 0.01; *** < 0.001 (ANOVA with Tukey's multiple comparisons test).
Figure 3
Figure 3
Gene expression profiles of VICs under the OM conditioned culturing with or without morusin. A) Volcano map of differentially expressed genes in OM + morusin versus OM (log2M/OM). B) Heatmap for all DEGs in OM + morusin versus OM groups. C) KEGG pathway enrichment of DEGs, bubble colors (deep) indicate the degree of enrichment, bubble size indicates gene counts matched the pathway enrichment, and rich ratio indicates the matched gene counts in the integrated pathway background genes. D) Heatmap for DEGs in cellular senescence pathway. E–H) Immunoblot analysis of CCND1, P53, and P21 expression in VICs from indicated groups (n = 3, each group). Bar plots showing the fold change of CCND1, P53, and P21 expression over control. I) KEGG pathway enrichment of DEGs in the second, fourth, and sixth passages of VICs. J) Heatmap for DEGs in cell cycle pathway. K,L) Immunoblot analysis of CCND1 in the second, fourth, and sixth passages of VICs (n = 3, each group). Bar plots showing the fold change of CCND1 expression over the second passage of VICs. M) RT‐PCR analysis of CCND1 mRNA level in the second, fourth, and sixth passages of VICs (n = 3, each group). Bar plots showing the fold change of CCND1 expression over the second passage of VICs. Data are means ± SD. * p < 0.05; ** < 0.01 (ANOVA with Tukey's multiple comparisons test).
Figure 4
Figure 4
CCND1 participates in the osteogenic differentiation of VICs following OM. A–F) VICs were transfected with CCND1 siRNA or scrambled siRNA, and then stimulated with OM for 7 days. Immunoblot analysis of CCND1, ALP, Runx2 P53, and P21 expression in VICs from indicated groups (n = 3, each group). Bar plots showing the semiquantitative analysis of indicated genes expression. G,H) With OM induction for 7 days, representative ALP staining of VICs from indicated groups (n = 3, each group). Scale bar 50 µm. I–K) With OM induction for 21 days, representative Alizarin red staining showed the calcific nodules in VICs from indicated groups (n = 3, each group). Scale bar 50 µm. L–M) Representative SA‐β‐gal staining of VICs from indicated groups (n = 3, each group). Bar plot showing the percentage of SA‐β‐gal staining positive cells. Scale bar 50 µm. Data are means ± SD. * p < 0.05; ** p < 0.01; *** p < 0.001 (ANOVA with Tukey's multiple comparisons test).
Figure 5
Figure 5
Morusin alleviates the senescence of VICs through CCND1/Nrf2 pathway. A) VICs were transfected with CCND1 siRNA or scrambled siRNA, and then stimulated with OM for 7 days. Immunoblot analysis of Nrf2 expression in VICs from indicated groups (n = 3, each group). Bar plots showing the semiquantitative analysis of Nrf2 expression. B) Heatmap for NRF2, NQO1, and HMXO‐1 in OM + morusin versus OM groups. C–E) Immunoblot analysis of NRF2 and HMXO‐1 expression in VICs from indicated groups (n = 3, each group). Bar plots showing the fold change of indicated genes expression over control. F–H) Immunofluorescent staining of NRF2 (red), DCFH‐DC (green), and DAPI (blue) in the VICs from indicated groups (n = 3, each group). Bar plots showing the semiquantitative analysis of fluorescence intensity. Scale bar 50 µm. I,J) Representative images showing MitoSOX (red) staining and quantification of the fluorescence intensity of MitoSOX fluorescence in VICs from indicated groups (n = 3, each group). Data are mean ± SD. * p < 0.05; ** p < 0.01; *** p < 0.001 (ANOVA with Tukey's multiple comparisons test).
Figure 6
Figure 6
Morusin attenuates VIC calcification by activating Nrf2 signaling pathway. A–D) ML385 was used to inhibit the activation of Nrf2 in VICs. Representative immunoblot images and quantification of the levels of ALP, Runx2, and P21 in VICs from indicated groups (n = 3, each group). E,F) With OM induction for 7 days, representative ALP staining of VICs from indicated groups (n = 3, each group). Scale bar 50 µm. G–I) With OM induction for 21 days, representative Alizarin red staining of VICs from indicated groups (n = 3, each group). Scale bar 50 µm. Data are means ± SD. ** p < 0.01; *** p < 0.001 (ANOVA with Tukey's multiple comparisons test).
Figure 7
Figure 7
Morusin increases the Trim25 expression and Keap1 ubiquitination level. A) The mRNA expression of TRIM family proteins in OM‐induced VICs treated with or without morusin. B–D) Representative immunoblot images and quantification of the levels of Keap1 and TRIM25 in VICs from indicated groups (n = 3, each group). E) Co‐IP analysis of the intercellular combination between Keap1 and TRIM25 and Keap1 ubiquitination level in VICs from indicated groups (n = 3, each group). Data are means ± SD. NS, not significant, * p < 0.05, ** p < 0.01, *** p < 0.001 (ANOVA with Tukey's multiple comparisons test.
Figure 8
Figure 8
Morusin attenuates VIC calcification depending on Trim25. A,B) VICs were transfected with CCND1 siRNA or scrambled siRNA, immunoblot analysis of Trim25 expression in VICs from indicated groups (n = 3, each group). Bar plots showing the semiquantitative analysis of Trim25 expression. C) VICs were transfected with Trim25 siRNA or scrambled siRNA. Co‐IP analysis of the Keap1 ubiquitination level in VICs from indicated groups (n = 3, each group). D–M) Representative immunoblot images and quantification of the levels of Trim25, ALP, Runx2, and P21 in VICs from indicated groups (n = 3, each group). N,S) VICs were transfected with Trim25 siRNA or scrambled siRNA, representative ALP staining of VICs from indicated groups (n = 3, each group). P,U) VICs were transfected with Trim25 siRNA or scrambled siRNA, representative Alizarin red staining of VICs from indicated groups (n = 3, each group). Scale bar 50 µm. Data are means ± SD. NS, not significant, * p < 0.05, ** p < 0.01, *** p < 0.001 (ANOVA with Tukey's multiple comparisons test).
Figure 9
Figure 9
Morusin prevents the aortic valve calcification in ApoE−/− mice. A) UMAP plot of cells from mouse aortic valve tissue, color‐coded by expression of marker genes. B) Violin plots representing the expression of CCND1, NRF2, and NQO1 in the VICs from mouse aortic valve tissue. C,D) Echocardiographic assessment showing morusin alleviates the aortic valve dysfunction (peak transvalvular velocity) induced by WD (n = 10, each group). E,F) Representative H&E stain images and quantitative analysis showing morusin alleviates aortic valve thickening induced by WD (n = 10, each group). G–H) Representative Vonkossa staining of mouse aortic valve from indicated groups (n = 10, each group). Bar plot showing the percentage of VK positive area. I,J) Representative Alizarin red staining of mouse aortic valve from indicated groups (n = 10, each group). Bar plot showing the percentage of AR‐positive area. K,L) Immunofluorescent staining of Runx2 (red) and DAPI (blue) in the mouse valvular tissue from indicated groups (n = 10, each group). Bar plot showing the semiquantitative analysis of fluorescence intensity. Data are means ± SD. * < 0.05; ** < 0.01 (unpaired two‐tailed Student's t‐test).
Figure 10
Figure 10
Morusin prevents the valvular calcification via its antioxidant effects in vivo. A,B) Immunofluorescent staining of NQO1 (red) and DAPI (blue) in the mouse valvular tissue from indicated groups (n = 10, each group). Bar plot showing the semiquantitative analysis of fluorescence intensity. C,D) Immunofluorescent staining of HMXO‐1 (red) and DAPI (blue) in the mouse valvular tissue from indicated groups (n = 10, each group). Bar plot showing the semiquantitative analysis of fluorescence intensity. E,F) Immunofluorescent staining of ROS (red) and DAPI (blue) in the mouse valvular tissue from indicated groups (n = 10, each group). Bar plot showing the semiquantitative analysis of fluorescence intensity. Bar plot showing the semiquantitative analyzes of fluorescence intensity. Data are mean ± SD. * < 0.05; ** < 0.01 (unpaired two‐tailed Student's t‐test).
Figure 11
Figure 11
Diagram of morusin‐mediated protective effect on CAVD progression.

Similar articles

Cited by

References

    1. Yadgir S., Johnson C. O., Aboyans V., Adebayo O. M., Adedoyin R. A., Afarideh M., Alahdab F., Alashi A., Alipour V., Arabloo J., Azari S., Barthelemy C. M., Benziger C. P., Berman A. E., Bijani A., Carrero J. J., Carvalho F., Daryani A., Duraes A. R., Esteghamati A., Farid T. A., Farzadfar F., Fernandes E., Filip I., Gad M. M., Hamidi S., Hay S. I., Ilesanmi O. S., Naghibi Irvani S. S., Jurisson M., Circulation 2020, 141, 1670 . - PubMed
    1. Peeters F., Meex S. J. R., Dweck M. R., Aikawa E., Crijns H., Schurgers L. J., Kietselaer B., Eur. Heart J. 2018, 39, 2618. - PMC - PubMed
    1. Kraler S., Blaser M. C., Aikawa E., Camici G. G., Luscher T. F., Eur. Heart J. 2022, 43, 683. - PMC - PubMed
    1. New S. E., Aikawa E., Circ. Res. 2011, 108, 1381. - PMC - PubMed
    1. Xu K., Xie S., Huang Y., Zhou T., Liu M., Zhu P., Wang C., Shi J., Li F., Sellke F. W., Dong N., Arterioscler Thromb Vasc Biol 2020, 40, 2910. - PubMed

MeSH terms

Supplementary concepts

LinkOut - more resources