

Optimizing competence in the service of collaboration
- PMID: 38503178
- PMCID: PMC11023779
- DOI: 10.1016/j.cogpsych.2024.101653
Optimizing competence in the service of collaboration
Abstract
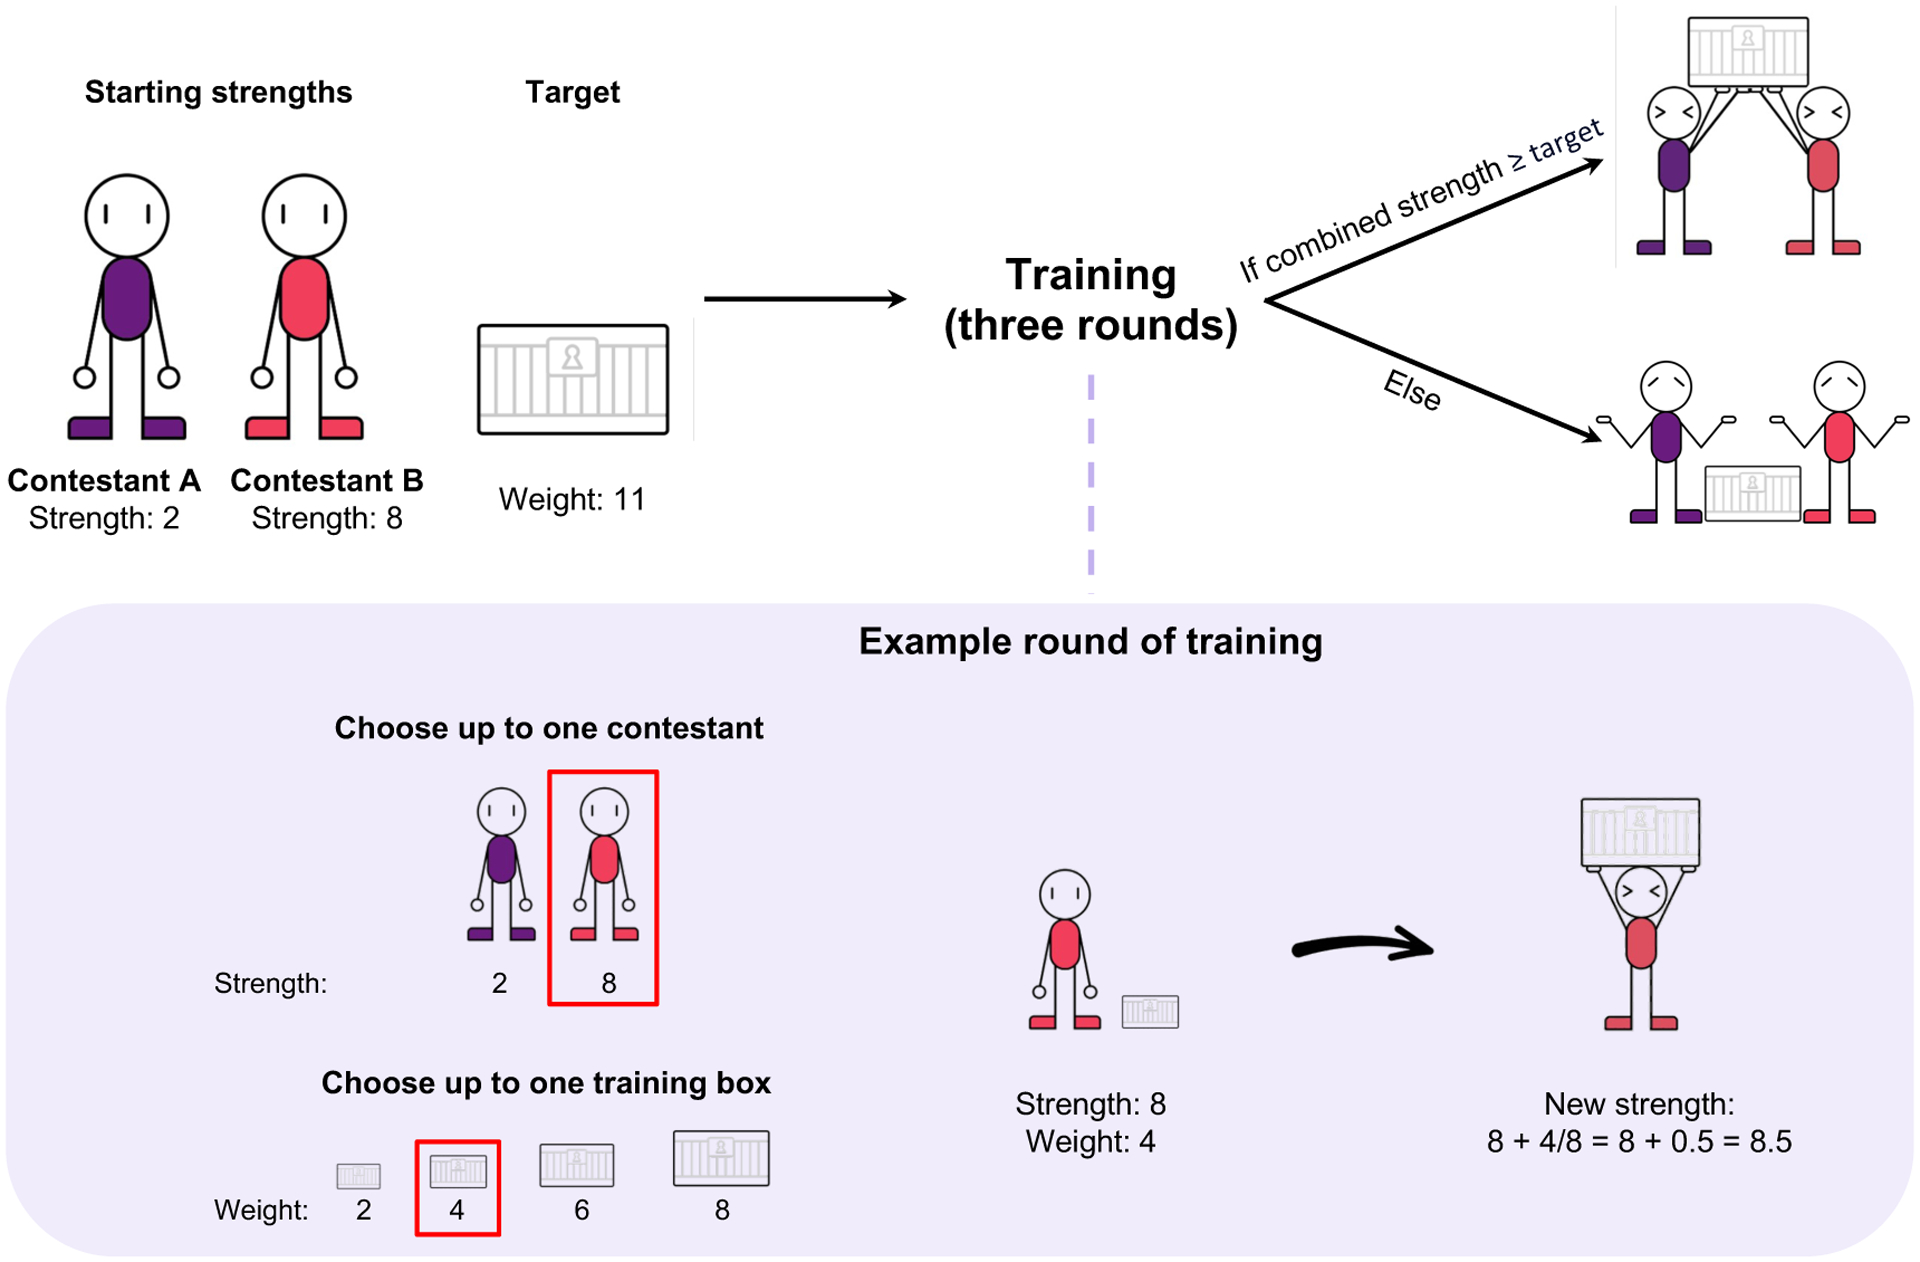
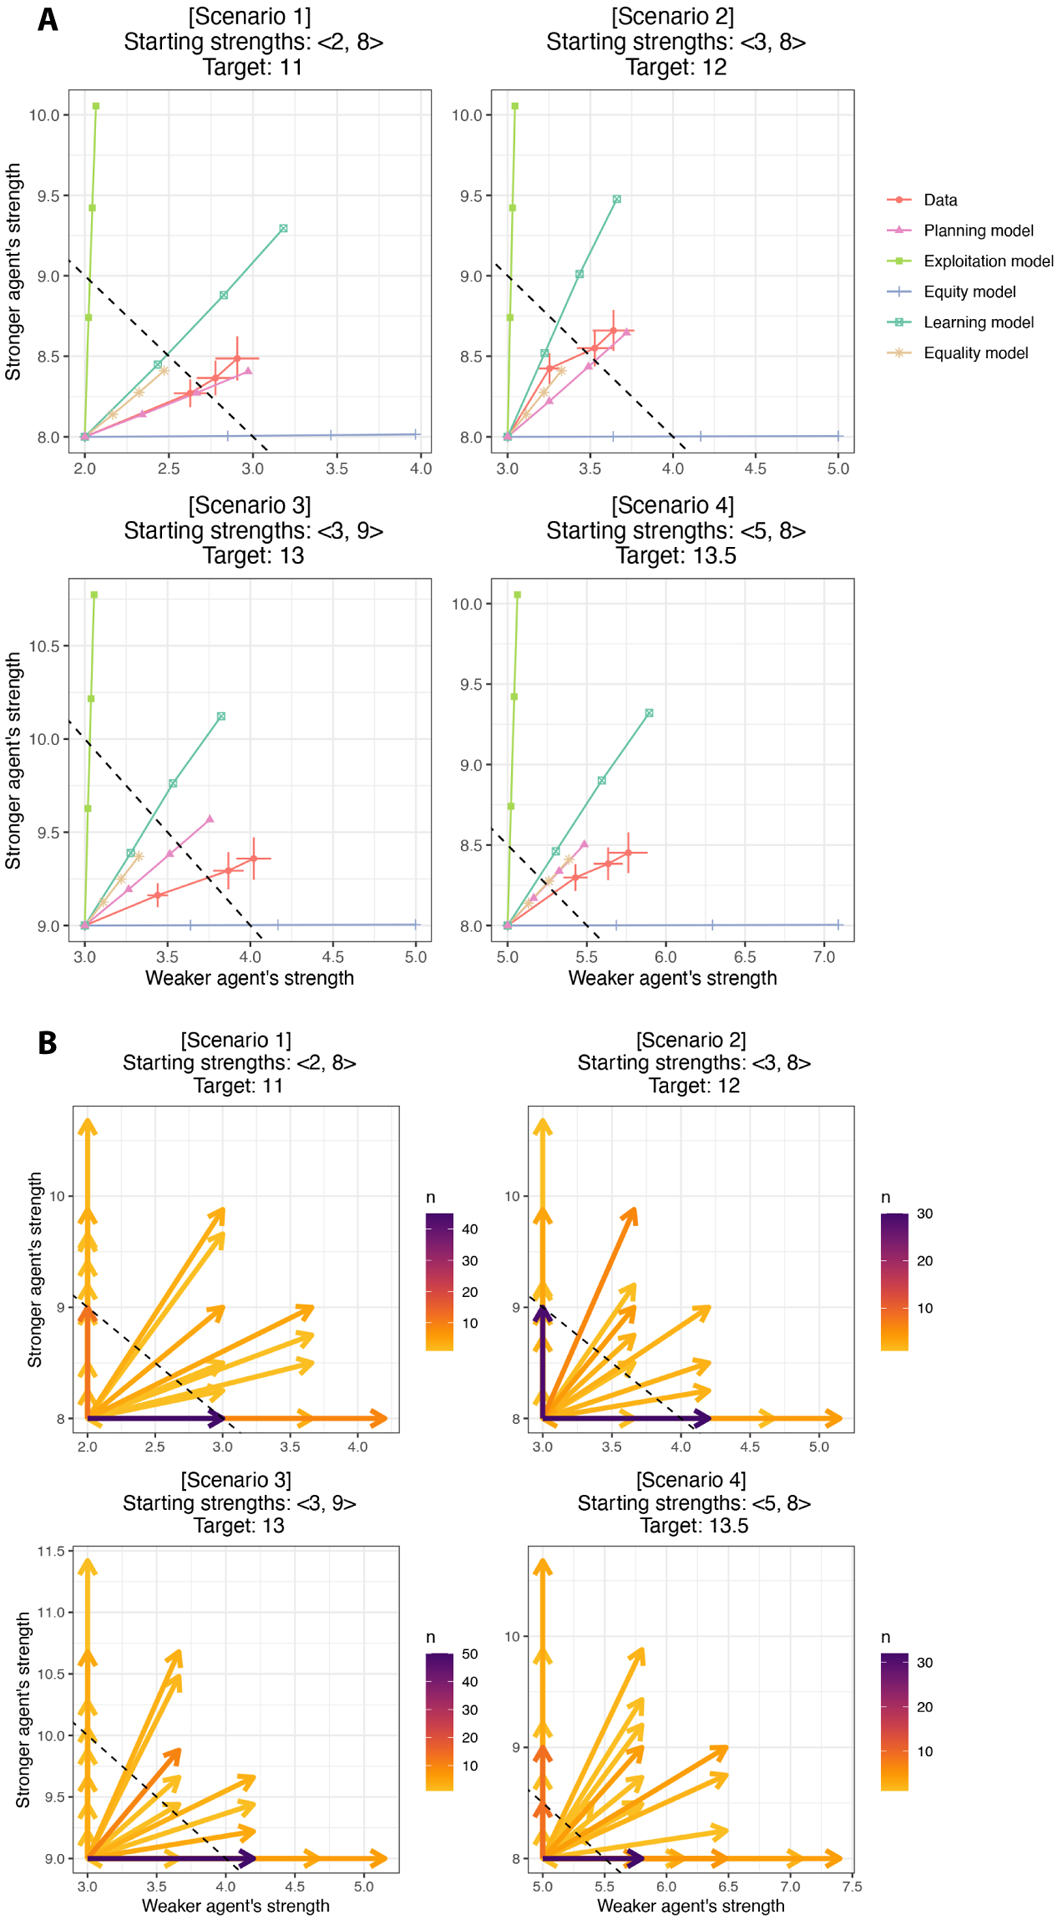
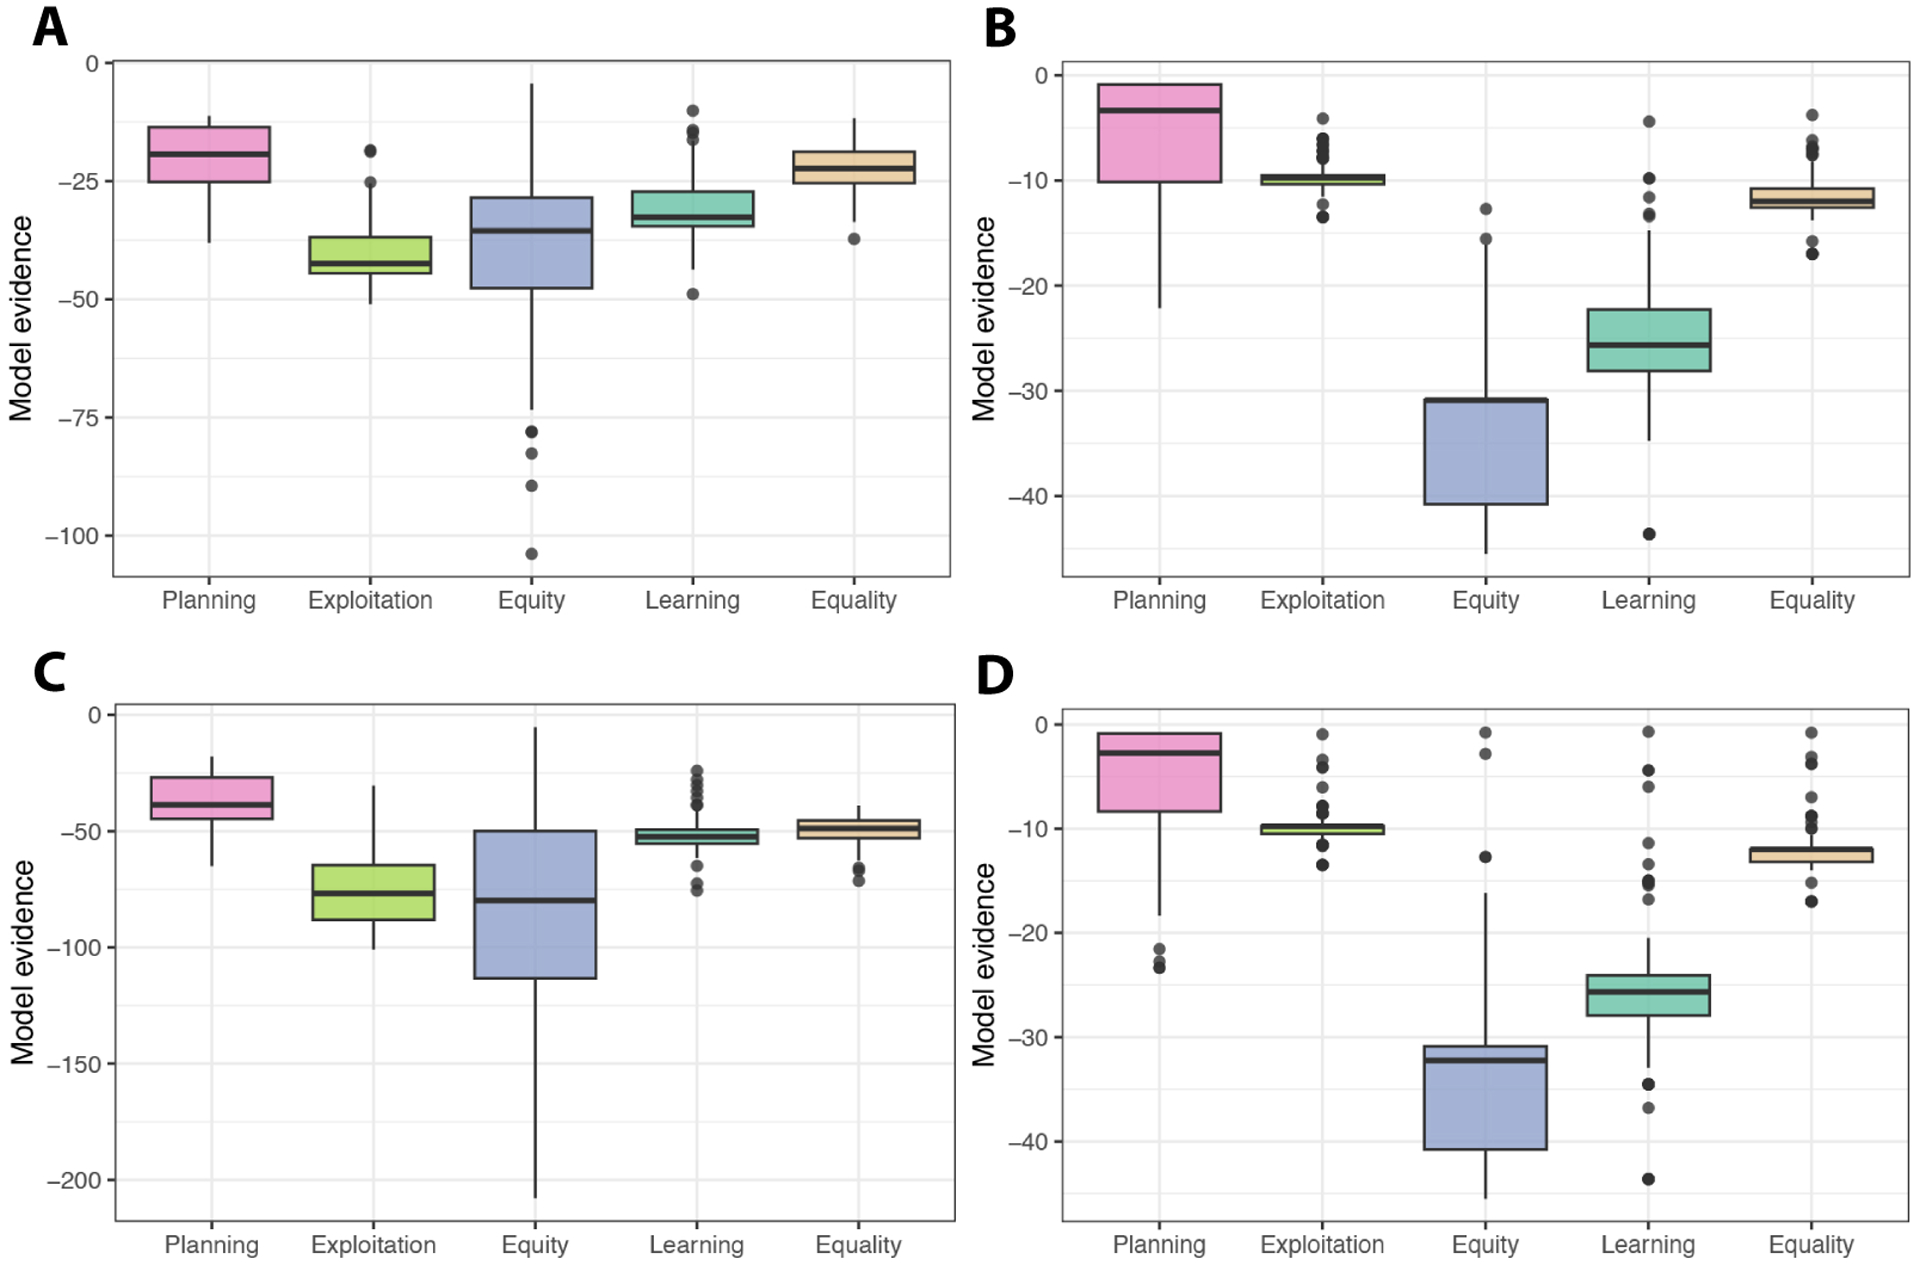
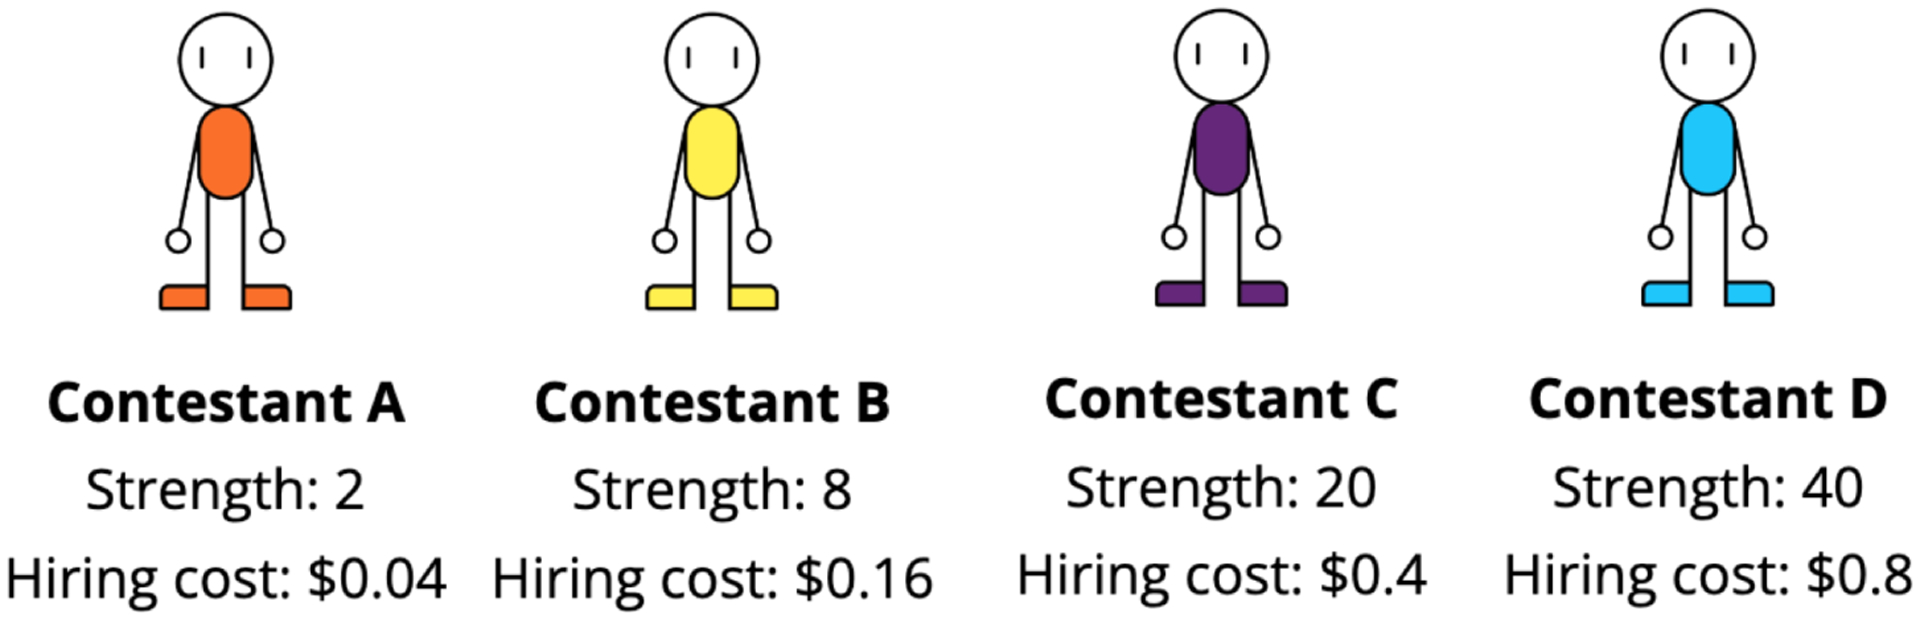
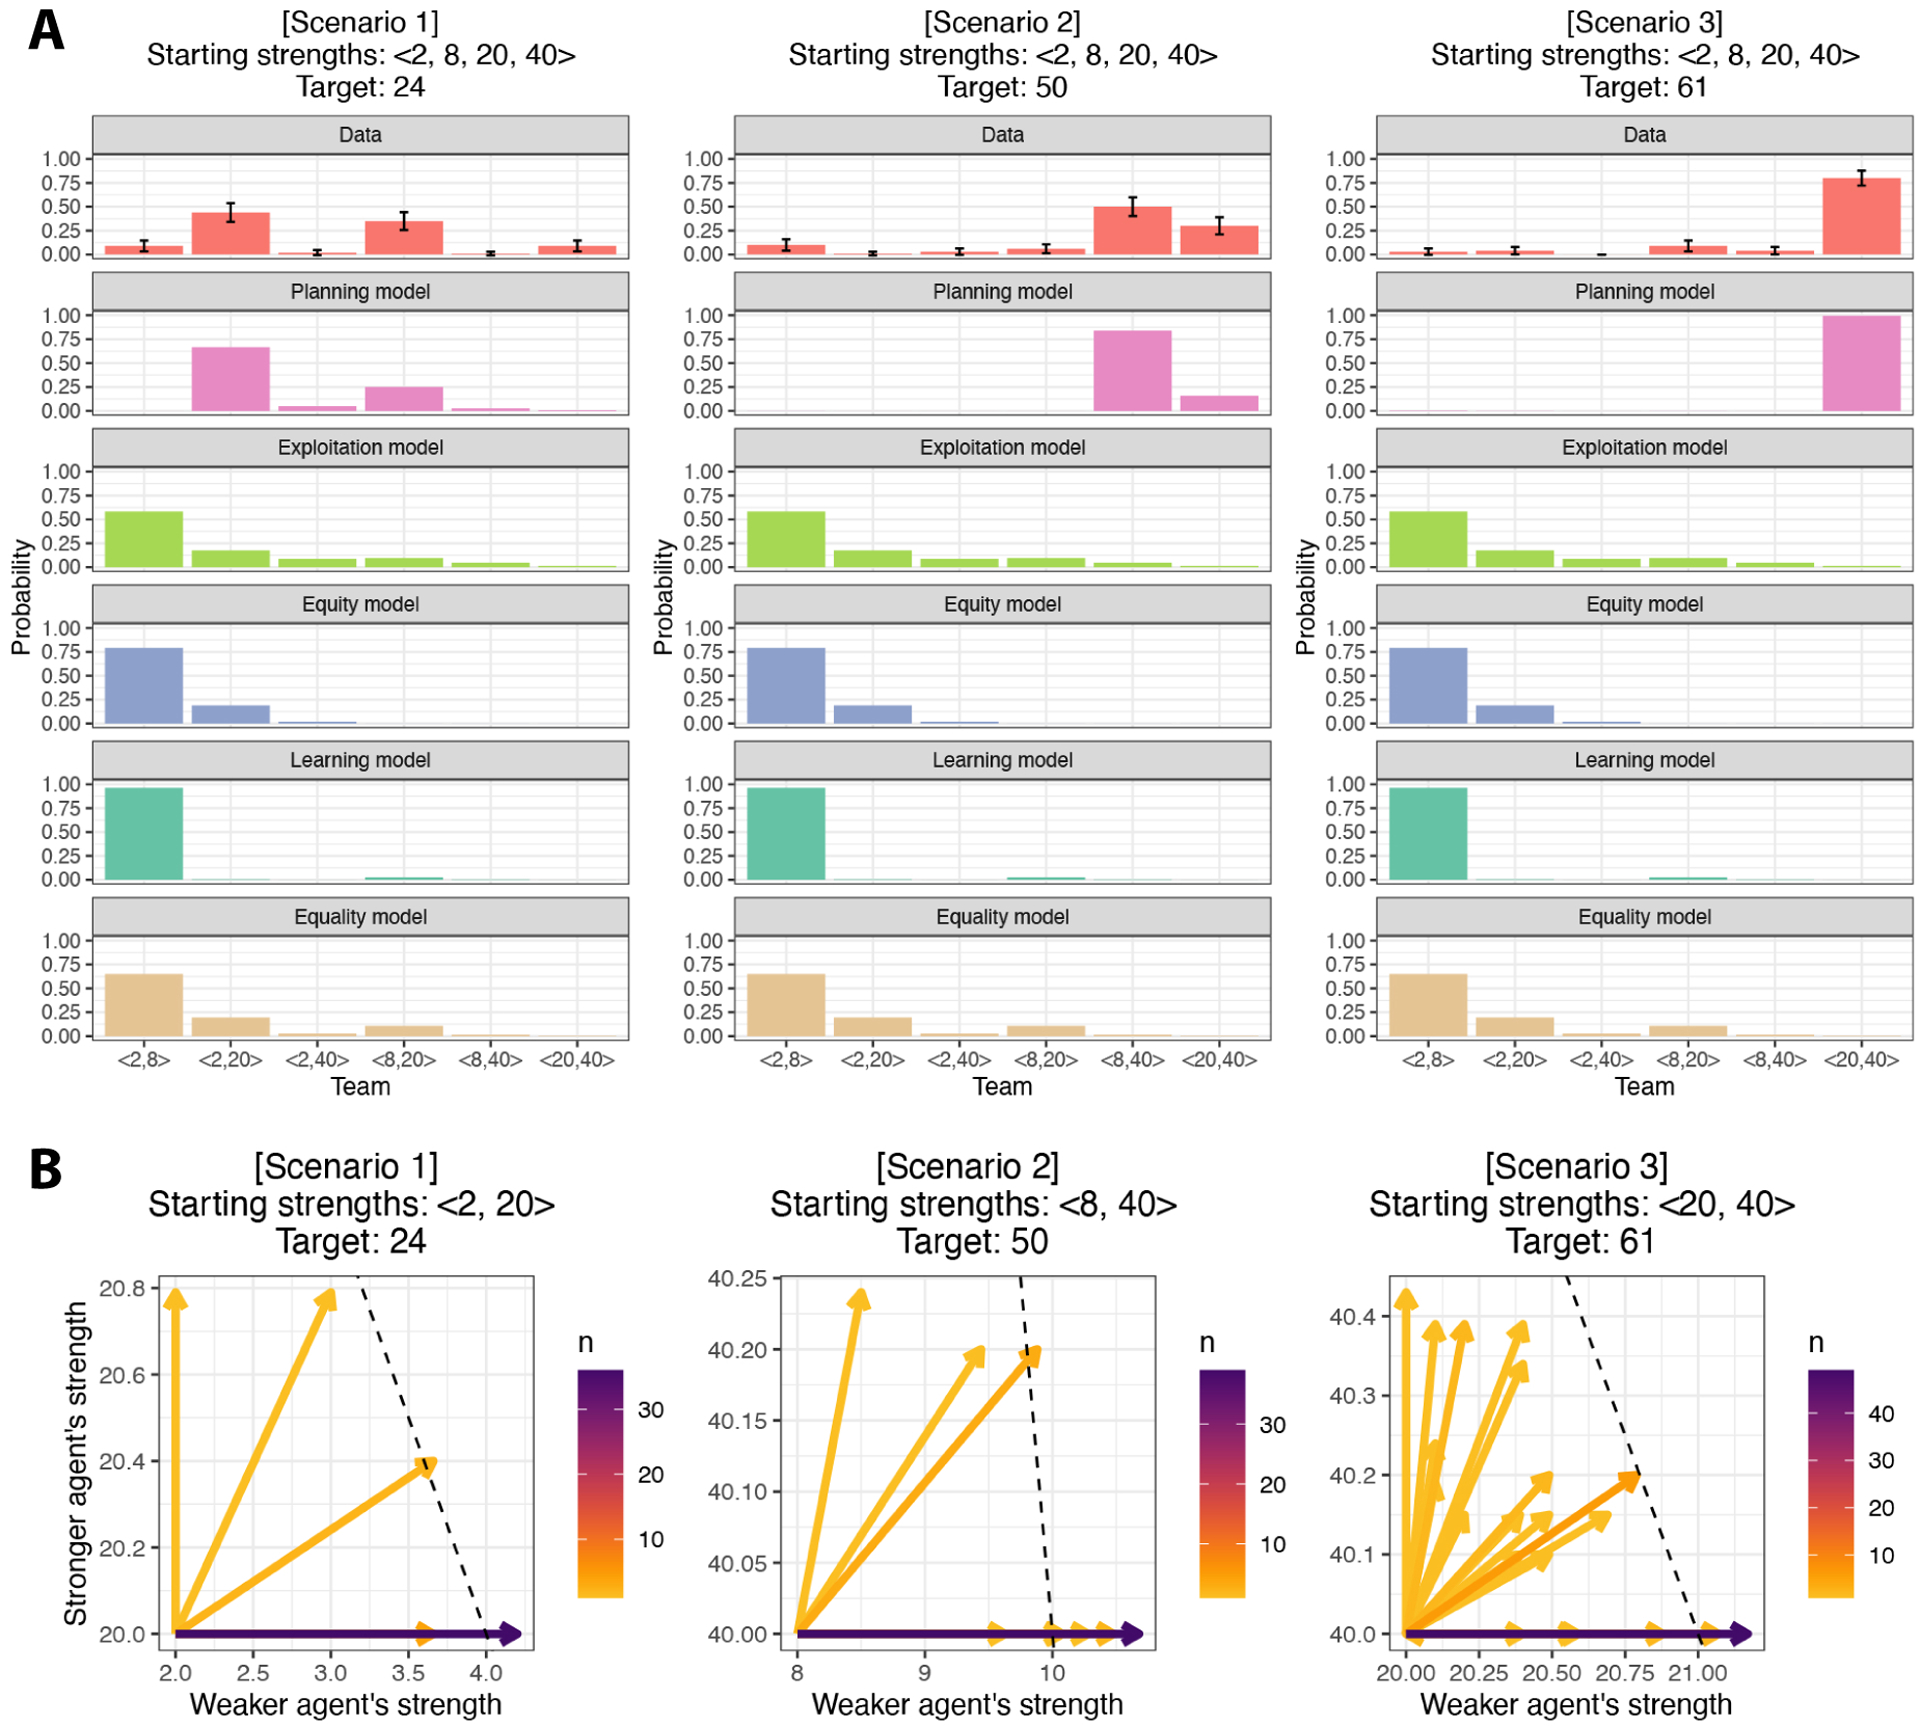
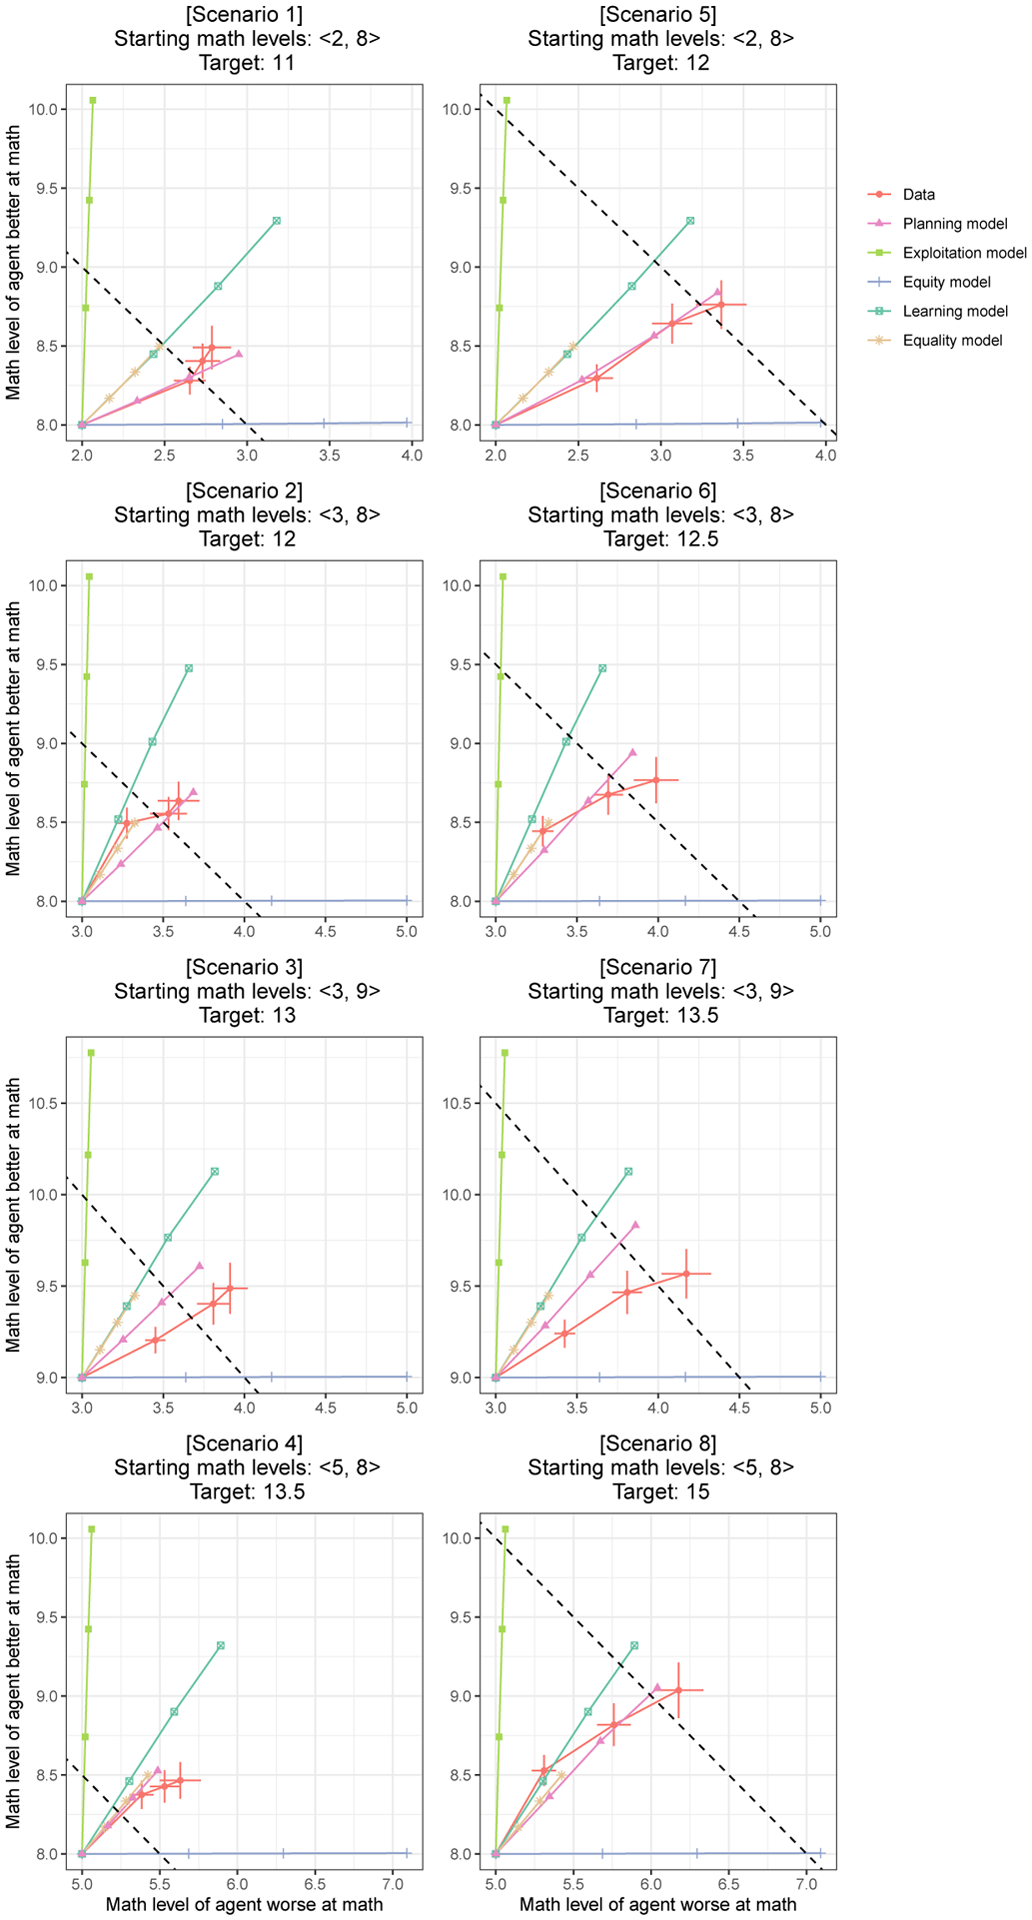
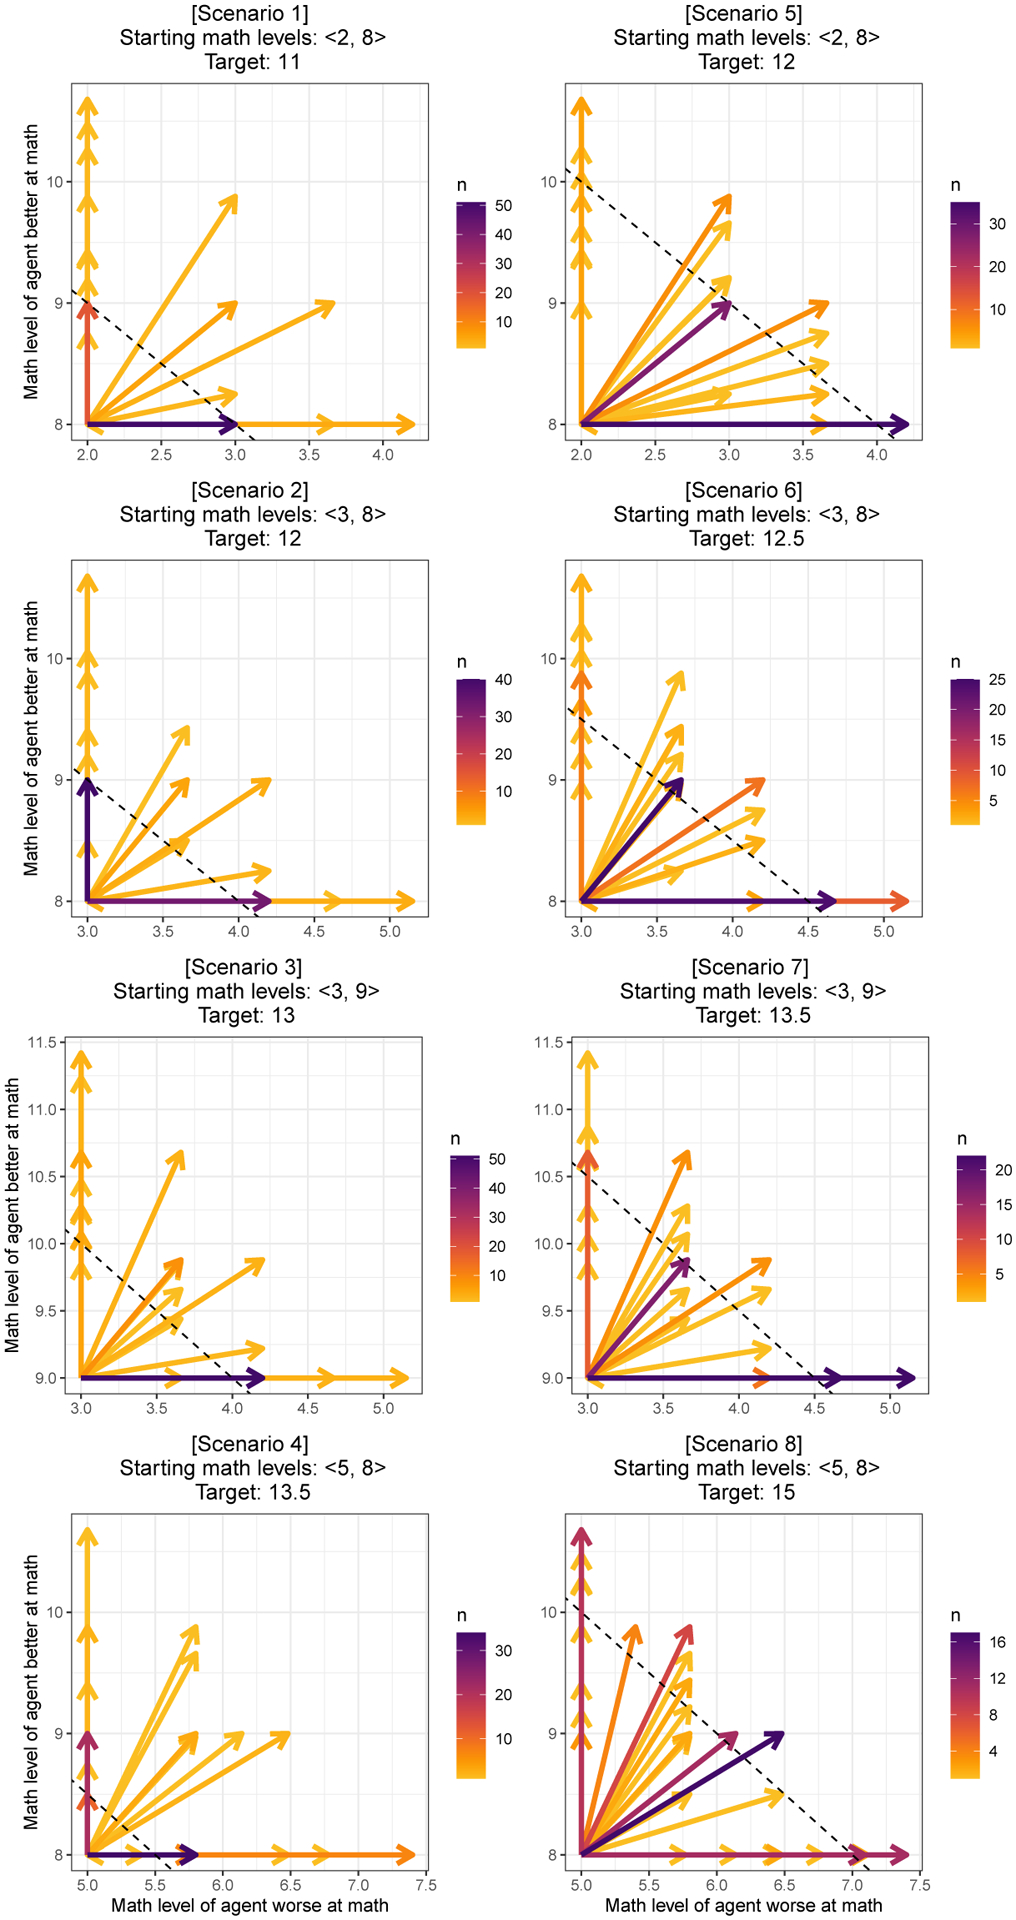
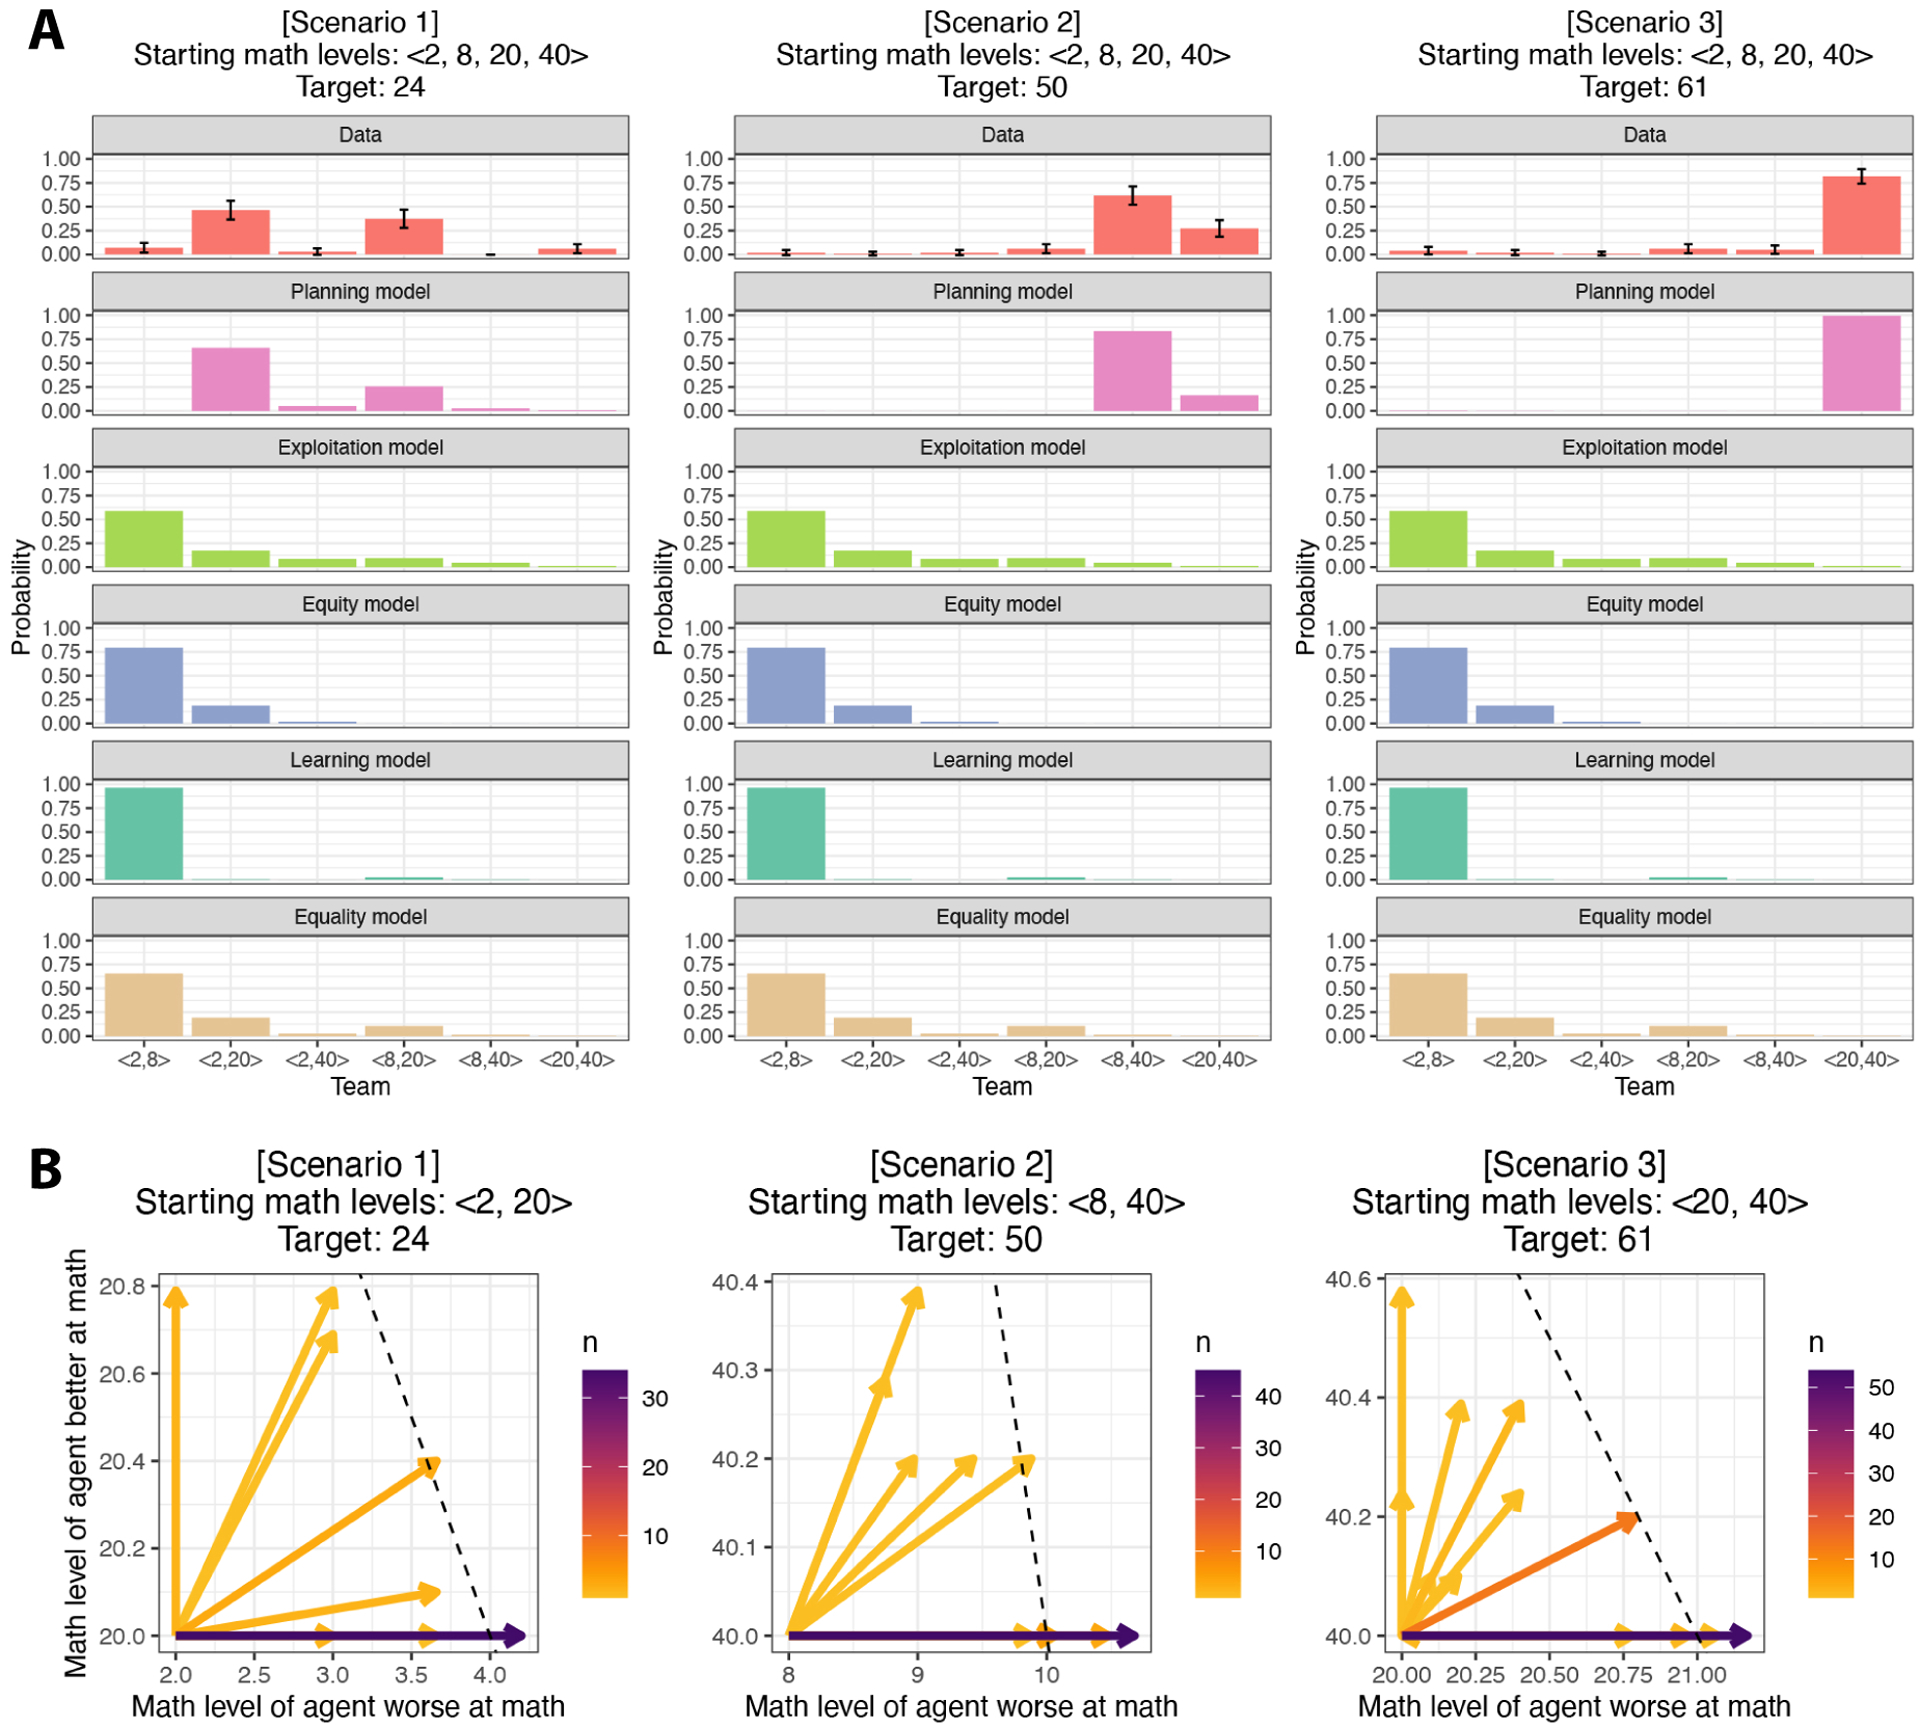
In order to efficiently divide labor with others, it is important to understand what our collaborators can do (i.e., their competence). However, competence is not static-people get better at particular jobs the more often they perform them. This plasticity of competence creates a challenge for collaboration: For example, is it better to assign tasks to whoever is most competent now, or to the person who can be trained most efficiently "on-the-job"? We conducted four experiments (N=396) that examine how people make decisions about whom to train (Experiments 1 and 3) and whom to recruit (Experiments 2 and 4) to a collaborative task, based on the simulated collaborators' starting expertise, the training opportunities available, and the goal of the task. We found that participants' decisions were best captured by a planning model that attempts to maximize the returns from collaboration while minimizing the costs of hiring and training individual collaborators. This planning model outperformed alternative models that based these decisions on the agents' current competence, or on how much agents stood to improve in a single training step, without considering whether this training would enable agents to succeed at the task in the long run. Our findings suggest that people do not recruit and train collaborators based solely on their current competence, nor solely on the opportunities for their collaborators to improve. Instead, people use an intuitive theory of competence to balance the costs of hiring and training others against the benefits to the collaboration.
Keywords: Collaboration; Competence; Planning; Plasticity; Social cognition; Teaching; Training.
Copyright © 2024 Elsevier Inc. All rights reserved.
Figures
Similar articles
-
People reward others based on their willingness to exert effort.J Exp Soc Psychol. 2025 Jan;116:104699. doi: 10.1016/j.jesp.2024.104699. Epub 2024 Nov 26. J Exp Soc Psychol. 2025. PMID: 39712555
-
[A proposal for reforming psychologists' training in France and in the European Union].Encephale. 2009 Feb;35(1):18-24. doi: 10.1016/j.encep.2007.11.008. Epub 2008 Apr 2. Encephale. 2009. PMID: 19250989 French.
-
Collaborative decision making is grounded in representations of other people's competence and effort.J Exp Psychol Gen. 2023 Jun;152(6):1565-1579. doi: 10.1037/xge0001336. Epub 2023 Mar 6. J Exp Psychol Gen. 2023. PMID: 36877460 Free PMC article.
-
Technology and the environment: supportive resource or barrier for people with developmental disabilities?Nurs Clin North Am. 2003 Jun;38(2):331-49. doi: 10.1016/s0029-6465(02)00053-1. Nurs Clin North Am. 2003. PMID: 12914311 Review.
-
Impact of summer programmes on the outcomes of disadvantaged or 'at risk' young people: A systematic review.Campbell Syst Rev. 2024 Jun 13;20(2):e1406. doi: 10.1002/cl2.1406. eCollection 2024 Jun. Campbell Syst Rev. 2024. PMID: 38873396 Free PMC article. Review.
Cited by
-
When Success Is Surprising: Children's Ability to Use Surprise to Infer Competence.Open Mind (Camb). 2025 Jul 7;9:825-843. doi: 10.1162/opmi.a.2. eCollection 2025. Open Mind (Camb). 2025. PMID: 40697897 Free PMC article.
-
People reward others based on their willingness to exert effort.J Exp Soc Psychol. 2025 Jan;116:104699. doi: 10.1016/j.jesp.2024.104699. Epub 2024 Nov 26. J Exp Soc Psychol. 2025. PMID: 39712555
References
-
- Baer C and Odic D (2022). Mini managers: Children strategically divide cognitive labor among collaborators, but with a self-serving bias. Child Development, 93(2):437–450. - PubMed
-
- Baker CL, Jara-Ettinger J, Saxe R, and Tenenbaum JB (2017). Rational quantitative attribution of beliefs, desires and percepts in human mentalizing. Nature Human Behaviour, 1(4):0064.
-
- Baker CL, Saxe R, and Tenenbaum JB (2009). Action understanding as inverse planning. Cognition, 113(3):329–349. - PubMed
-
- Bartel AP (1994). Productivity gains from the implementation of employee training programs. Industrial relations: a journal of economy and society, 33(4):411–425.
-
- Bentham J (1970). An introduction to the principles of morals and legislation (1789), ed. by Burns j. H and Hart HLA, London.
Grants and funding
LinkOut - more resources
Full Text Sources
