. 2024 Jun 4;84(11):1898-1914.
doi: 10.1158/0008-5472.CAN-23-2957.

Cigarette Smoking and E-cigarette Use Induce Shared DNA Methylation Changes Linked to Carcinogenesis

Affiliations

Cigarette Smoking and E-cigarette Use Induce Shared DNA Methylation Changes Linked to Carcinogenesis

Chiara Herzog et al. Cancer Res. .

Abstract

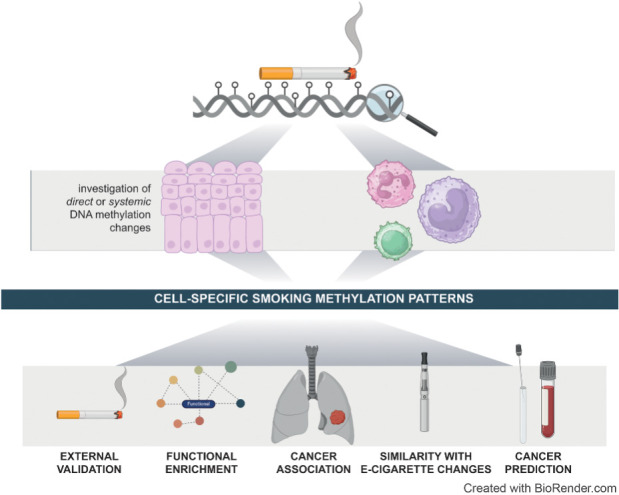
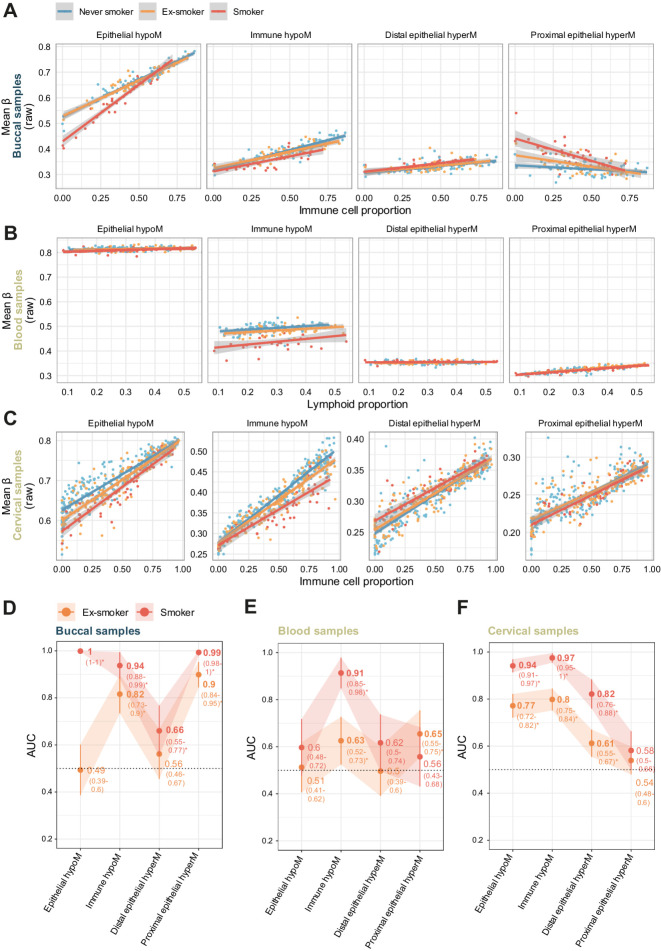
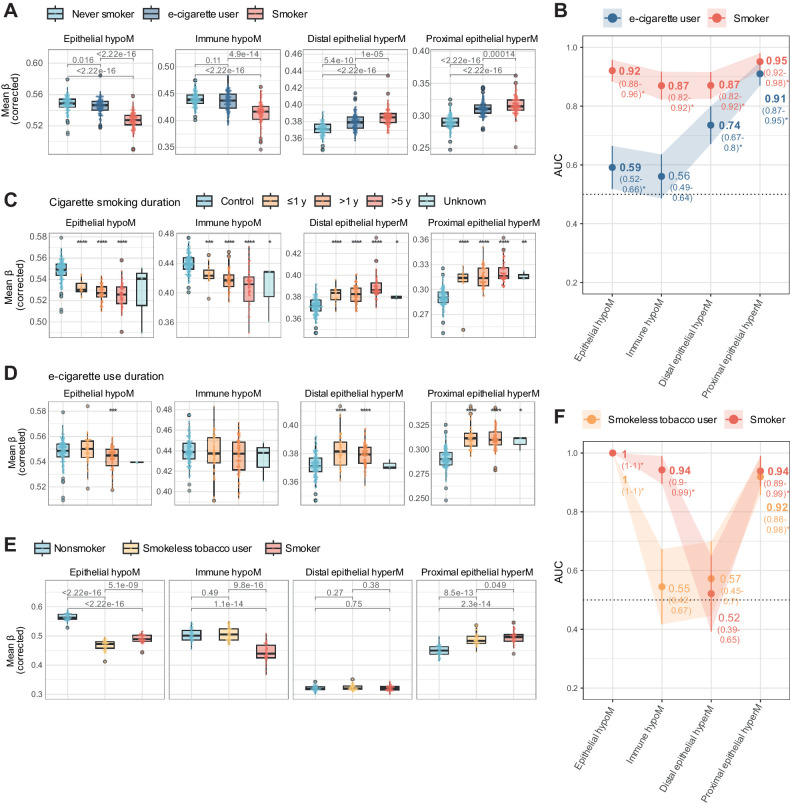
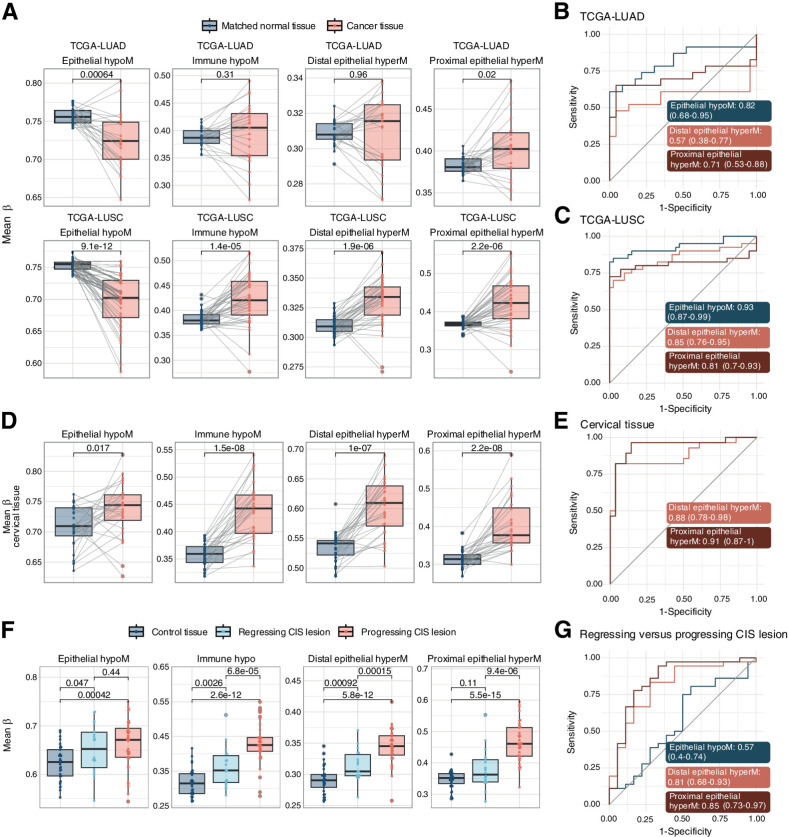
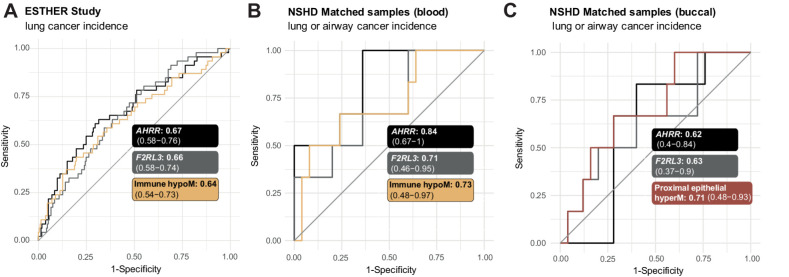
Tobacco use is a major modifiable risk factor for adverse health outcomes, including cancer, and elicits profound epigenetic changes thought to be associated with long-term cancer risk. While electronic cigarettes (e-cigarettes) have been advocated as harm reduction alternatives to tobacco products, recent studies have revealed potential detrimental effects, highlighting the urgent need for further research into the molecular and health impacts of e-cigarettes. Here, we applied computational deconvolution methods to dissect the cell- and tissue-specific epigenetic effects of tobacco or e-cigarette use on DNA methylation (DNAme) in over 3,500 buccal/saliva, cervical, or blood samples, spanning epithelial and immune cells at directly and indirectly exposed sites. The 535 identified smoking-related DNAme loci [cytosine-phosphate-guanine sites (CpG)] clustered into four functional groups, including detoxification or growth signaling, based on cell type and anatomic site. Loci hypermethylated in buccal epithelial cells of smokers associated with NOTCH1/RUNX3/growth factor receptor signaling also exhibited elevated methylation in cancer tissue and progressing lung carcinoma in situ lesions, and hypermethylation of these sites predicted lung cancer development in buccal samples collected from smokers up to 22 years prior to diagnosis, suggesting a potential role in driving carcinogenesis. Alarmingly, these CpGs were also hypermethylated in e-cigarette users with a limited smoking history. This study sheds light on the cell type-specific changes to the epigenetic landscape induced by smoking-related products.

Significance: The use of both cigarettes and e-cigarettes elicits cell- and exposure-specific epigenetic effects that are predictive of carcinogenesis, suggesting caution when broadly recommending e-cigarettes as aids for smoking cessation.


Figures

None
Graphical abstract
Figure 1. General overview of the study and identification of cell type–specific smoking-dependent epigenetic changes. A, Overview of the study. We aimed to identify cell- and tissue-specific epigenetic alterations and used a discovery set of buccal, cervical, and immune cells (all female). Findings were then validated in several independent sets to confirm the association with current and former smoking and explore association of cell-specific effects across smoking alternatives (e-cigarette use, moist tobacco use), lung cancer tissue and progression, and possibility to predict lung cancers in smokers using noninvasive samples. A detailed workflow of the analysis is shown in Supplementary Fig. S1. B, Scatterplots of methylation beta values in three CpGs located in the AHRR gene or intergenic region versus immune cell proportion (buccal and cervical samples) or lymphoid proportion (blood) indicate methylation differences may be derived from distinct cell types. C, Visualization of delta-beta values across four groups of CpGs identified in Supplementary Fig. S5A. A matrix of inferred delta-beta values across all tissues for all significant CpGs (i.e., significant in at least one tissue in the EWAS) was clustered using UMAP and the following clusters identified: epithelial hypomethylation (epithelial hypoM), immune hypomethylation (immune hypoM), distal epithelial hypermethylation (distal epithelial hyperM; effects in distal epithelium but not directly exposed epithelium), and proximal epithelial hypermethylation (proximal epithelial hypoM; effects in buccal/directly exposed samples only). (A, Created with BioRender.com.)
Figure 1.
General overview of the study and identification of cell type–specific smoking-dependent epigenetic changes. A, Overview of the study. We aimed to identify cell- and tissue-specific epigenetic alterations and used a discovery set of buccal, cervical, and immune cells (all female). Findings were then validated in several independent sets to confirm the association with current and former smoking and explore association of cell-specific effects across smoking alternatives (e-cigarette use, moist tobacco use), lung cancer tissue and progression, and possibility to predict lung cancers in smokers using noninvasive samples. A detailed workflow of the analysis is shown in Supplementary Fig. S1. B, Scatterplots of methylation beta values in three CpGs located in the AHRR gene or intergenic region versus immune cell proportion (buccal and cervical samples) or lymphoid proportion (blood) indicate methylation differences may be derived from distinct cell types. C, Visualization of delta-beta values across four groups of CpGs identified in Supplementary Fig. S5A. A matrix of inferred delta-beta values across all tissues for all significant CpGs (i.e., significant in at least one tissue in the EWAS) was clustered using UMAP and the following clusters identified: epithelial hypomethylation (epithelial hypoM), immune hypomethylation (immune hypoM), distal epithelial hypermethylation (distal epithelial hyperM; effects in distal epithelium but not directly exposed epithelium), and proximal epithelial hypermethylation (proximal epithelial hypoM; effects in buccal/directly exposed samples only). (A, Created with BioRender.com.)
Figure 2. Combined methylation scores of CpGs in the four sets and annotation. A, Association of mean methylation β values in each of the sets described in Fig. 1C with immune cell proportion in buccal and cervical samples and lymphoid proportion in blood samples in the discovery set. B, Venn Diagram of genes associated with CpGs in each of the four smoking-associated sets of CpG indicates little overlap between involved genes. C–F, Gene ontology (C–E) and Reactome pathway enrichment (F) for the four sets of smoking-associated CpGs reveals different pathways.
Figure 2.
Combined methylation scores of CpGs in the four sets and annotation. A, Association of mean methylation β values in each of the sets described in Fig. 1C with immune cell proportion in buccal and cervical samples and lymphoid proportion in blood samples in the discovery set. B, Venn Diagram of genes associated with CpGs in each of the four smoking-associated sets of CpG indicates little overlap between involved genes. C–F, Gene ontology (C–E) and Reactome pathway enrichment (F) for the four sets of smoking-associated CpGs reveals different pathways.
Figure 3. Evaluation of scores in independent validation sets. Independent dataset comprising 304 matched blood and buccal samples (n = 152 each) and 442 cervical samples was used to validate the findings. A–C, Mean beta values (uncorrected) in each of the four sets of CpGs in buccal (A), blood (B), and cervical (C) samples of never smokers, ex-smokers, and current smokers versus immune cell proportion (A and C) or lymphoid proportion (B). D–F, AUC of corrected values in each of the four sets of CpG comparing never smokers with current or former smokers in buccal (D), blood (E), and cervical (F) samples. Mean methylation scores in this figure only include sites present on the 450K array for comparability between datasets.
Figure 3.
Evaluation of scores in independent validation sets. Independent dataset comprising 304 matched blood and buccal samples (n = 152 each) and 442 cervical samples was used to validate the findings. A–C, Mean beta values (uncorrected) in each of the four sets of CpGs in buccal (A), blood (B), and cervical (C) samples of never smokers, ex-smokers, and current smokers versus immune cell proportion (A and C) or lymphoid proportion (B). D–F, AUC of corrected values in each of the four sets of CpG comparing never smokers with current or former smokers in buccal (D), blood (E), and cervical (F) samples. Mean methylation scores in this figure only include sites present on the 450K array for comparability between datasets.
Figure 4. Impact of e-cigarette and smokeless use on cell type–specific epigenetic smoking signatures. A, Mean beta values (corrected) in each of the four sets in saliva samples of never or current smokers or e-cigarette users, corrected for cell type–specific effects. B, AUC of corrected values in each of the four sets comparing smokers or e-cigarette users with controls in the e-cigarette use dataset. C, Mean beta values in each of the four sets in never smokers (control) or smokers, stratified by categorial smoking duration information. D, Mean beta values in each of the four sets in never smokers (control) or e-cigarette users, stratified by categorial e-cigarette duration information. The legend is identical to C. E, Mean beta values (corrected) in each of the four sets in saliva samples of current nonsmokers (prior smoking history not known), smokeless tobacco users, or smokers in the smokeless tobacco use set. F, AUC of corrected values in each of the four sets of CpGs comparing nonsmokers with smokeless tobacco users or smokers in the smokeless tobacco use set. *, P < 0.05; **, P < 0.01; ***, P < 0.001; ****, P < 0.0001 in Wilcoxon test compared with relevant controls (never or nonsmokers, respectively, for A, C, D, and E).
Figure 4.
Impact of e-cigarette and smokeless use on cell type–specific epigenetic smoking signatures. A, Mean beta values (corrected) in each of the four sets in saliva samples of never or current smokers or e-cigarette users, corrected for cell type–specific effects. B, AUC of corrected values in each of the four sets comparing smokers or e-cigarette users with controls in the e-cigarette use dataset. C, Mean beta values in each of the four sets in never smokers (control) or smokers, stratified by categorial smoking duration information. D, Mean beta values in each of the four sets in never smokers (control) or e-cigarette users, stratified by categorial e-cigarette duration information. The legend is identical to C. E, Mean beta values (corrected) in each of the four sets in saliva samples of current nonsmokers (prior smoking history not known), smokeless tobacco users, or smokers in the smokeless tobacco use set. F, AUC of corrected values in each of the four sets of CpGs comparing nonsmokers with smokeless tobacco users or smokers in the smokeless tobacco use set. *, P < 0.05; **, P < 0.01; ***, P < 0.001; ****, P < 0.0001 in Wilcoxon test compared with relevant controls (never or nonsmokers, respectively, for A, C, D, and E).
Figure 5. Mean methylation beta of smoking-associated CpG sets in cancer tissue and progressing versus regressing CIS lesions. A, Mean methylation beta values in each set in TCGA LUAD and LUSC projects. Only samples with matched normal control tissue were included to control for smoking exposure. P values are derived from a paired Wilcoxon test. B and C, AUC plots for mean methylation levels in epithelial hypoM, distal epithelial hyperM, and proximal epithelial hyperM, comparing matched control tissue versus lung cancer tissue in TCGA-LUAD (B) and TCGA-LUSC (C). D, Mean methylation beta values in each set in cervical cancer or matched normal tissue (GSE211668). Only samples with matched normal control tissue were included to control for smoking exposure. P values are derived from a paired Wilcoxon test. E, AUC plots for mean methylation levels in epithelial hypoM, distal epithelial hyperM, and proximal epithelial hyperM, comparing matched control tissue versus cervical cancer tissue (GSE211668). F, Mean methylation beta values in the smoking-associated CpG sets in control lung tissue, regressing CIS lesions, or progressing CIS lesions. P values are derived from paired Wilcoxon tests. G, AUC plots for mean methylation levels in epithelial hypoM, distal epithelial hyperM, and proximal epithelial hyperM, comparing matched regressing CIS versus progressing CIS lesions.
Figure 5.
Mean methylation beta of smoking-associated CpG sets in cancer tissue and progressing versus regressing CIS lesions. A, Mean methylation beta values in each set in TCGA LUAD and LUSC projects. Only samples with matched normal control tissue were included to control for smoking exposure. P values are derived from a paired Wilcoxon test. B and C, AUC plots for mean methylation levels in epithelial hypoM, distal epithelial hyperM, and proximal epithelial hyperM, comparing matched control tissue versus lung cancer tissue in TCGA-LUAD (B) and TCGA-LUSC (C). D, Mean methylation beta values in each set in cervical cancer or matched normal tissue (GSE211668). Only samples with matched normal control tissue were included to control for smoking exposure. P values are derived from a paired Wilcoxon test. E, AUC plots for mean methylation levels in epithelial hypoM, distal epithelial hyperM, and proximal epithelial hyperM, comparing matched control tissue versus cervical cancer tissue (GSE211668). F, Mean methylation beta values in the smoking-associated CpG sets in control lung tissue, regressing CIS lesions, or progressing CIS lesions. P values are derived from paired Wilcoxon tests. G, AUC plots for mean methylation levels in epithelial hypoM, distal epithelial hyperM, and proximal epithelial hyperM, comparing matched regressing CIS versus progressing CIS lesions.
Figure 6. Prediction of lung cancer using immune hypoM in blood and proximal epithelial hyperM in buccal samples compared with previously described predictors. A, Comparison of the AUCs of AHRR (cg05575921), F2RL3 (cg03636183), and mean methylation at immune hypoM to identify any lung cancer cases within 17 years in 259 current smokers in the ESTHER study. B, Comparison of the AUCs of AHRR (cg05575921), F2RL3 (cg03636183), and mean methylation at immune hypoM (corrected for immune cell proportion) to identify any lung or airway cancer cases within 22 years in 31 blood samples (n = 6 cancer cases) of the validation set (same individuals as in C). C, Comparison of the AUCs of AHRR (cg05575921), F2RL3 (cg03636183), and mean methylation at proximal epithelial hyperM (corrected for immune cell proportion) to identify any lung or airway cancer cases within 22 years in 31 buccal samples (n = 6 cancer cases) of the validation set (same individuals as in B).
Figure 6.
Prediction of lung cancer using immune hypoM in blood and proximal epithelial hyperM in buccal samples compared with previously described predictors. A, Comparison of the AUCs of AHRR (cg05575921), F2RL3 (cg03636183), and mean methylation at immune hypoM to identify any lung cancer cases within 17 years in 259 current smokers in the ESTHER study. B, Comparison of the AUCs of AHRR (cg05575921), F2RL3 (cg03636183), and mean methylation at immune hypoM (corrected for immune cell proportion) to identify any lung or airway cancer cases within 22 years in 31 blood samples (n = 6 cancer cases) of the validation set (same individuals as in C). C, Comparison of the AUCs of AHRR (cg05575921), F2RL3 (cg03636183), and mean methylation at proximal epithelial hyperM (corrected for immune cell proportion) to identify any lung or airway cancer cases within 22 years in 31 buccal samples (n = 6 cancer cases) of the validation set (same individuals as in B).

Comment in

References

    1. United States Public Health Service Office of the Surgeon General, Centers for Disease Control and Prevention (U.S.), National Center for Chronic Disease Prevention and Health Promotion (U.S.) Office on Smoking and Health. How tobacco smoke causes disease: the biology and behavioral basis for smoking-attributable disease : a report of the surgeon general. Atlanta (GA): Centers for Disease Control and Prevention; 2010. - PubMed
    1. Lushniak BD, Samet JM, Pechacek TF, Norman LA, Taylor PA. The health consequences of smoking—50 years of progress : a report of the surgeon general. Atlanta (GA): Centers for Disease Control and Prevention; 2014.
    1. GBD 2019 Tobacco Collaborators. Spatial, temporal, and demographic patterns in prevalence of smoking tobacco use and attributable disease burden in 204 countries and territories, 1990–2019: a systematic analysis from the global burden of disease study 2019. Lancet 2021;397:2337–60. - PMC - PubMed
    1. Rodu B, Godshall WT. Tobacco harm reduction: an alternative cessation strategy for inveterate smokers. Harm Reduct J 2006;3:37. - PMC - PubMed
    1. Notley C, Ward E, Dawkins L, Holland R. The unique contribution of e-cigarettes for tobacco harm reduction in supporting smoking relapse prevention. Harm Reduct J 2018;15:31. - PMC - PubMed