. 2024 Apr 11;187(8):1955-1970.e23.
doi: 10.1016/j.cell.2024.02.025. Epub 2024 Mar 18.

Contrasting somatic mutation patterns in aging human neurons and oligodendrocytes

Affiliations

Contrasting somatic mutation patterns in aging human neurons and oligodendrocytes

Javier Ganz et al. Cell. .

Abstract

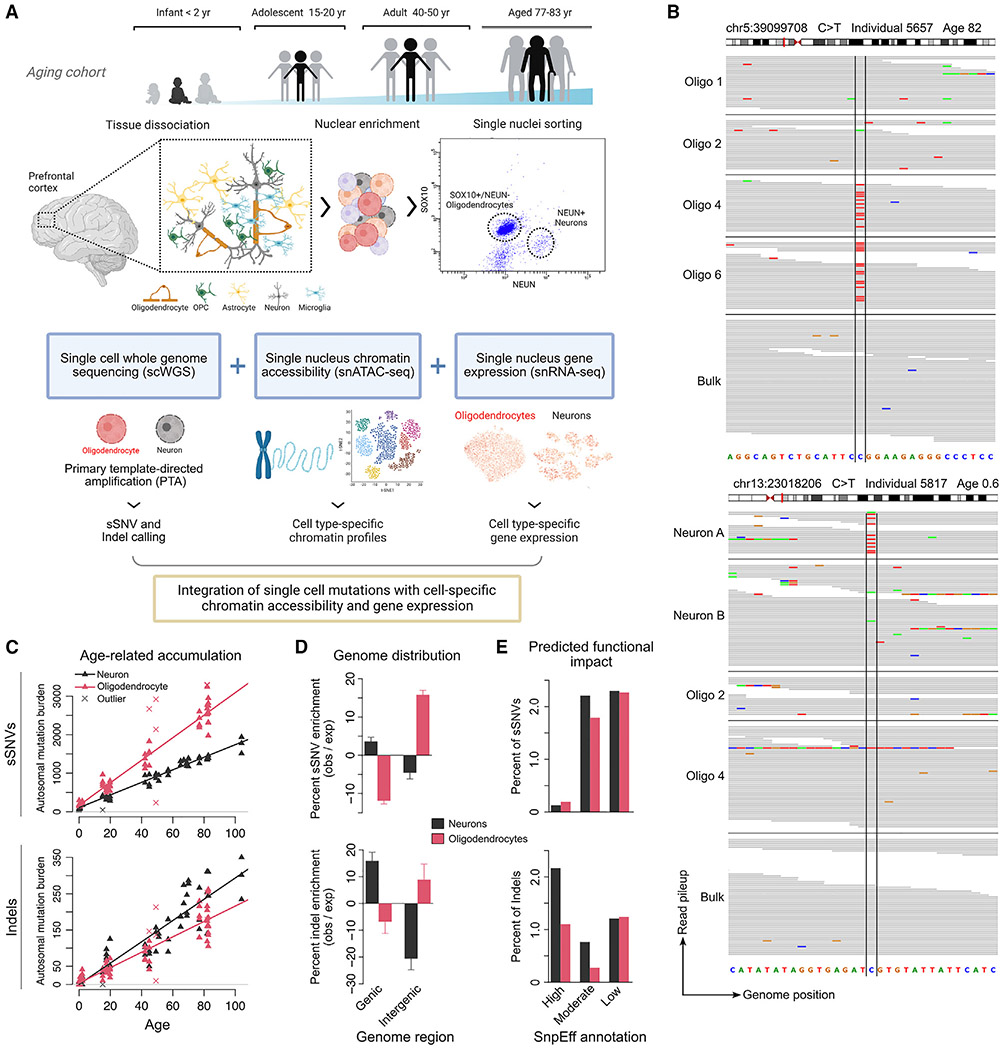
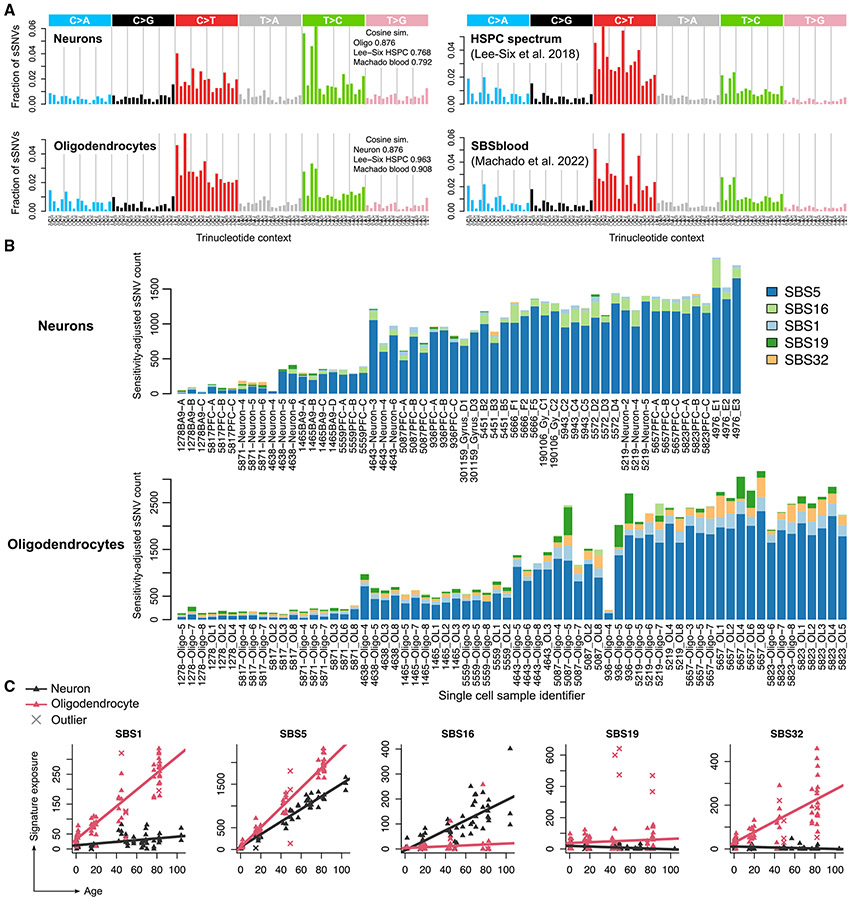
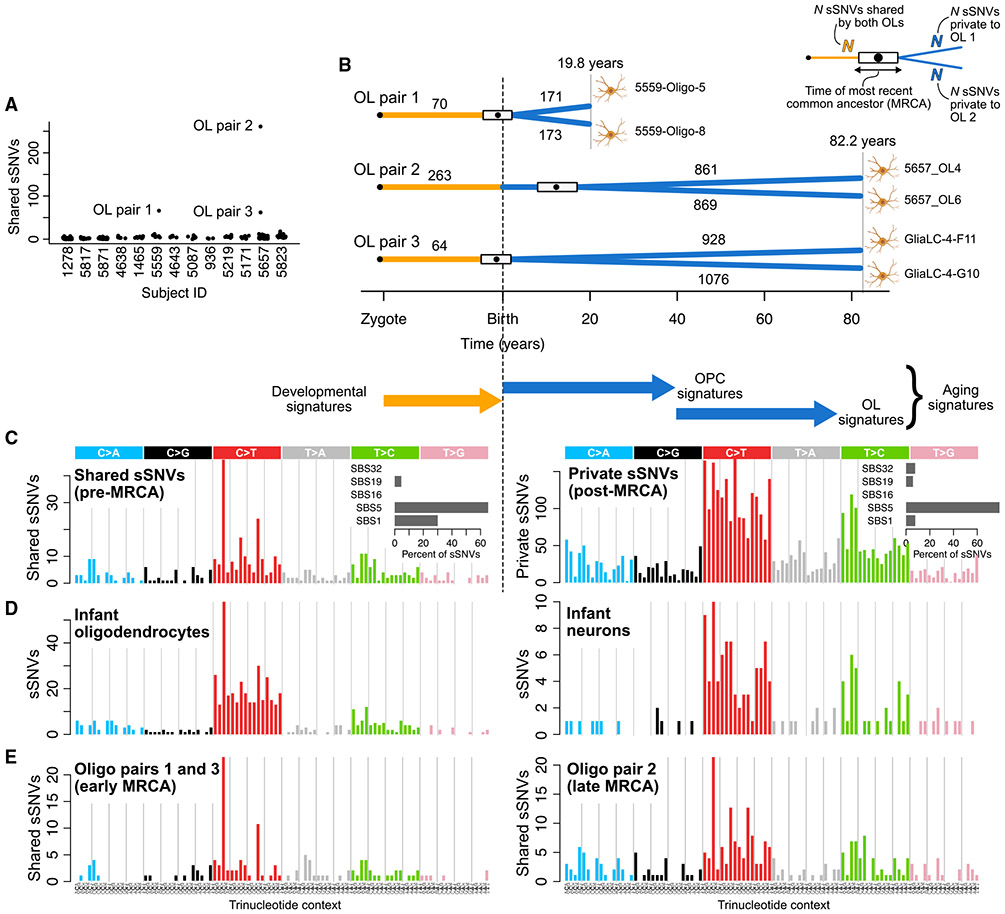
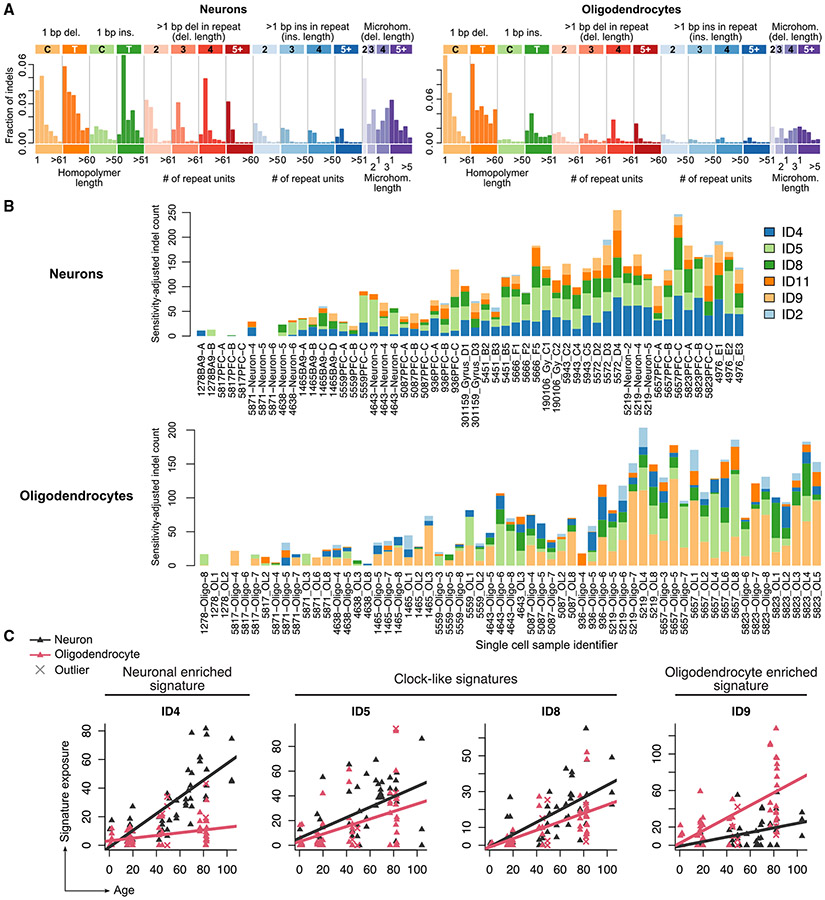
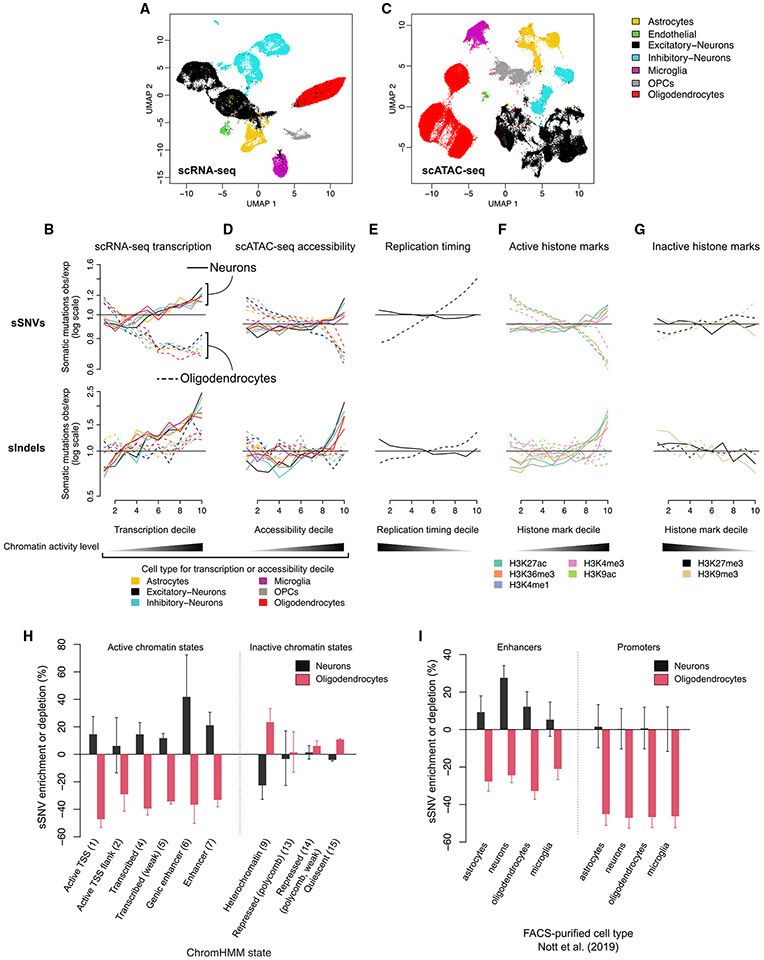
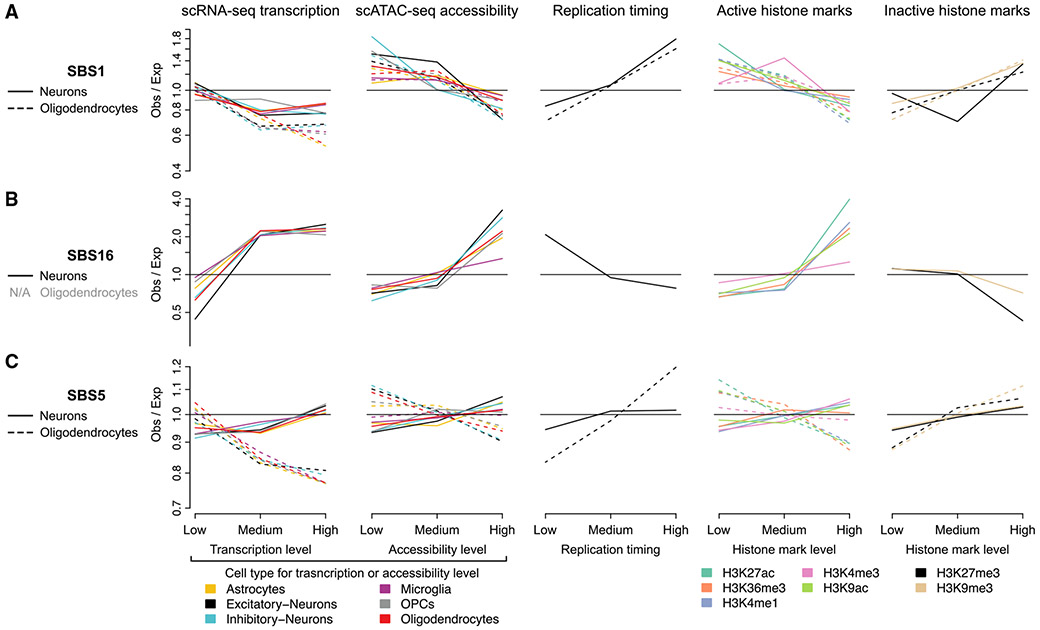
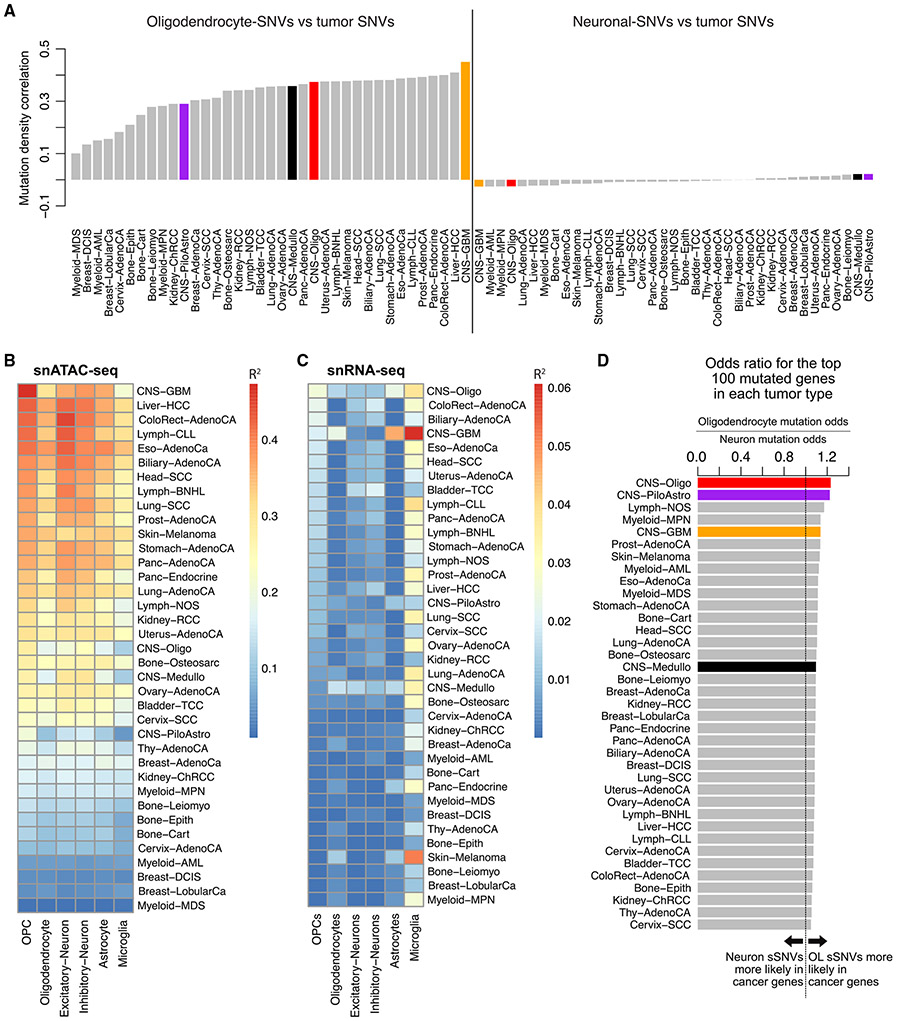
Characterizing somatic mutations in the brain is important for disentangling the complex mechanisms of aging, yet little is known about mutational patterns in different brain cell types. Here, we performed whole-genome sequencing (WGS) of 86 single oligodendrocytes, 20 mixed glia, and 56 single neurons from neurotypical individuals spanning 0.4-104 years of age and identified >92,000 somatic single-nucleotide variants (sSNVs) and small insertions/deletions (indels). Although both cell types accumulate somatic mutations linearly with age, oligodendrocytes accumulated sSNVs 81% faster than neurons and indels 28% slower than neurons. Correlation of mutations with single-nucleus RNA profiles and chromatin accessibility from the same brains revealed that oligodendrocyte mutations are enriched in inactive genomic regions and are distributed across the genome similarly to mutations in brain cancers. In contrast, neuronal mutations are enriched in open, transcriptionally active chromatin. These stark differences suggest an assortment of active mutagenic processes in oligodendrocytes and neurons.

Keywords: aging; brain cancer; brain disorders; glial cells; glioma; gliomagenesis; oligodendrocyte precursor cells; oligodendrocytes; somatic mutations.


Conflict of interest statement

Declaration of interests J.G. is now a Merck Research Laboratories (MRL) employee, and no work related to this manuscript was performed at MRL. P.J.P. is a member of the scientific advisory board for Bioskryb Genomics, Inc.

Figures

Figure 1.
Figure 1.. Somatic mutations in neurons and oligodendrocytes accumulate at different rates and in different genomic regions
(A) Experimental strategy. Oligodendrocytes (OL; n = 66 PTA, n = 20 MDA) and neurons (n = 56 PTA) were obtained from the brains of 20 neurotypical individuals (0–104 years of age) through FANS using NEUN (neurons) and SOX10 (OL) antibodies. Single genomes were amplified using PTA or MDA and non-clonal somatic SNVs (sSNVs) and indels were called using SCAN2. Mutation distributions were compared with snATAC-seq and snRNA-seq data obtained from a subset of the 20 individuals. (B) Integrated Genomics Viewer screenshots of two sSNVs identified by SCAN2. Top, an sSNV shared by two oligodendrocytes; bottom, a private sSNV in a neuron. (C) Extrapolated genome-wide sSNV and indel burdens for OLs and neurons as a function of age. SCAN2 estimates mutation burdens for each single cell individually by adjusting for sensitivity. Trend lines are mixed-effects linear regression models; outlier single cells with abnormally high or low mutation burdens, indicated by crosses, were excluded from the linear regressions (see STAR Methods). (D) Distribution of OL and neuronal sSNVs and indels in annotated gene regions. Enrichment/depletion levels are calculated by comparison with a null distribution obtained by randomly shuffling mutations across the genome followed by correction for somatic mutation detection sensitivity; error bars represent bootstrapped 95% CIs (see STAR Methods). Percentages give the observed mutation count divided by the expected mutation count from the null distribution in each region. (E) Percent of somatic mutations in the total mutation catalog with HIGH, MODERATE, and LOW impact on genes, as determined by SnpEff. See also Figures S1, S2, S3, and S4 and Tables S1, S2, and S3.
Figure 2.
Figure 2.. The composition of somatic SNVs, reflected in exposure to COSMIC mutational signatures, also differs between neurons and oligodendrocytes
(A) SBS mutational spectra of neuronal and oligodendrocyte sSNVs identified in this study (left column); the spectrum of hematopoietic stem and progenitor cells (HSPCs) identified in Lee-Six et al., and a signature derived from an analysis of human lymphocytes (Machado et al.). Cosine similarities are shown for each pair of spectra. (B) The number of somatic mutations, after extrapolation to genome-wide burdens, attributed to each COSMIC SBS signature by SigProfilerExtractor for each PTA single OL and neuron. Subjects are ordered from young (left) to elderly (right). (C) Same signature exposure values in (B) plotted against age. Each point represents one single cell. Crosses indicate the outlier cells, in terms of total mutation burden, as identified in Figure 1C. Trend lines are linear regression models from which outliers were excluded (see STAR Methods). See also Figure S4.
Figure 3.
Figure 3.. Shared somatic sSNVs of oligodendrocyte pairs reveal mutational characteristics of oligodendrocyte precursor cells (OPCs)
(A) Number of sSNVs shared between every pair of OLs for each individual in this study. (B) Schematic of three pairs of related OLs and estimates of the time of division for each pair’s most recent common ancestor (MRCA), with the box providing a range (not a confidence interval) derived from the 95% confidence intervals on the OL aging accumulation model and the point providing a single best estimate (see STAR Methods). (C) The SBS mutational spectrum and contributions of COSMIC signatures (insets) for sSNVs acquired before division of the MRCA (shared sSNVs) and sSNVs acquired after division of the MRCA (private sSNVs) shows greater contribution of SBS1 at earlier stages. (D) SBS mutational spectra for high-confidence mutations from infant (0–2 years of age) PTA OLs and neurons (STAR Methods). (E) SBS mutational spectra for shared sSNVs from OL pairs with early (pairs 1 and 3) and late (pair 2) MRCAs.
Figure 4.
Figure 4.. Insertion and deletion COSMIC signatures in human oligodendrocytes and neurons suggest differing mutagenic mechanisms
(A) Spectra of somatic indels from human OLs and neurons using the 83-dimensional indel classification scheme from COSMIC. (B) Contribution of COSMIC indel signatures to each single OL and neuron. One bar represents one single cell; cells are ordered according to age, with the youngest individuals on the left and eldest individuals on the right. (C) Same as (B), but signature exposure is plotted against age for each single cell; each point represents one cell and crosses represent total mutational burden outliers. Trend lines are linear regression models from which outliers are excluded (see STAR Methods). ID5 and ID8 are annotated as clock-like signatures in COSMIC.
Figure 5.
Figure 5.. Oligodendrocyte somatic mutations are associated with inactive chromatin, while neuronal mutations associate with active chromatin
(A) Uniform manifold approximation and projection (UMAP) plot of integrated snRNA-seq from three subjects (UMB1465, UMB4638, and UMB4643) with cell type annotations. (B) Enrichment analysis of somatic mutations vs. snRNA-seq transcription level. The genome is divided into 1 kb, non-overlapping windows, and each window is annotated with an average gene expression level per cell type; windows that are <20% covered by a gene are discarded. The remaining windows are classified into 10 deciles, with 1 representing the least transcribed and 10 representing the most transcribed. In each decile, the observed number of somatic SNVs and indels is compared with a null distribution of mutations obtained by randomly shuffling mutation positions followed by correction for somatic mutation detection sensitivity (see STAR Methods). Each line shows somatic mutation density vs. transcription level from one cell type identified in our snRNA-seq; solid lines indicate mutation density measured in PTA neurons and dashed lines indicate PTA oligodendrocytes. (C and D) Same as (A) and (B) for snATAC-seq from the brains of 10 subjects from this cohort. (E) Enrichment analysis of replication timing, as measured by ENCODE RepliSeq; lines represent average enrichment across 15 cell lines. (F and G) Enrichment analysis of 5 epigenetic marks related to gene activity (F) and two repressive epigenetic marks (G) measured in dorsolateral prefrontal cortex tissue (Roadmap Epigenomic Project, reference epigenome E073). (H and I) Enrichment analysis of functional genomic regions identified by ChromHMM in reference epigenome E073 (H) or active enhancers and promoters identified in Nott et al. for several brain cell types (I). Numbers in parentheses indicate the ChromHMM state number (H). Error bars represent bootstrapped 95% CIs (see STAR Methods). See also Figure S5.
Figure 6.
Figure 6.. Distinct mutational signatures show cell-type-specific enrichment in active or inactive chromatin
(A–C) Enrichment analysis of somatic mutations attributed to SBS1 (A), SBS16 (B), or SBS5 (C)—rather than total mutation density—vs. the decile-based genomic covariates presented in Figure 5. The genome was divided into three quantiles—rather than ten—to reduce noise in signature fitting caused by the smaller number of mutations attributed to each signature. OLs are not plotted for SBS16 due to near-complete lack of SBS16, leading to highly noisy measurements. See also Figure S6.
Figure 7.
Figure 7.. Patterns of oligodendrocyte sSNVs correlate with somatic mutation density in cancer
(A) Correlation of OL and neuronal sSNV mutation density with cancer mutation density. For each cell type and cancer type, the genome was tiled with non-overlapping 1 MB bins and numbers of mutations per bin were tabulated. Somatic mutations from PTA neurons and PTA OLs were tabulated for the same regions and corrected for mutation detection sensitivity. CNS tumors are colored: CNS-Oligo, oligodendroglioma, red; CNS-PiloAstro, pilocytic astrocytoma, purple; CNS-GBM, glioblastoma multiforme, orange; CNS-Medullo, medulloblastoma, black. (B and C) Mutation density for each tumor type was fit using a linear regression to cell-type-specific single-cell chromatin accessibility signals from our snATAC-seq (B) and single-cell expression levels from our snRNA-seq (C) using the same 1 MB bins described in (A). For each tumor type and cell type, the fraction of variance in tumor mutation density explained (R2) by each cell type is shown. (D) Comparison of OL and neuron somatic mutation rates in frequently mutated cancer genes. For each tumor type in PCAWG (y axis), the 100 most-frequently mutated genes were determined. For each tumor-specific set of 100 cancer genes (GT), an odds ratio (OR) is computed such that OR > 1 indicates that OL mutations are more likely to occur in GT and OR < 1 indicates that neuronal mutations are more likely to occur in GT. Formally, OR = (# OL sSNVs in GT/# genic OL sSNVs not in GT)/(# neuron sSNVs in GT/# genic neuron sSNVs not in GT). See also Figure S7.

References

    1. Genovese G, Kähler AK, Handsaker RE, Lindberg J, Rose SA, Bakhoum SF, Chambert K, Mick E, Neale BM, Fromer M, et al. (2014). Clonal hematopoiesis and blood-cancer risk inferred from blood DNA sequence. N. Engl. J. Med 371, 2477–2487. - PMC - PubMed
    1. Jaiswal S, Fontanillas P, Flannick J, Manning A, Grauman PV, Mar BG, Lindsley RC, Mermel CH, Burtt N, Chavez A, et al. (2014). Age-related clonal hematopoiesis associated with adverse outcomes. N. Engl. J. Med 371, 2488–2498. - PMC - PubMed
    1. Lee-Six H, Olafsson S, Ellis P, Osborne RJ, Sanders MA, Moore L, Georgakopoulos N, Torrente F, Noorani A, Goddard M, et al. (2019). The landscape of somatic mutation in normal colorectal epithelial cells. Nature 574, 532–537. - PubMed
    1. Lodato MA, Rodin RE, Bohrson CL, Coulter ME, Barton AR, Kwon M, Sherman MA, Vitzthum CM, Luquette LJ, Yandava CN, et al. (2018). Aging and neurodegeneration are associated with increased mutations in single human neurons. Science 359, 555–559. - PMC - PubMed
    1. Martincorena I, Fowler JC, Wabik A, Lawson ARJ, Abascal F, Hall MWJ, Cagan A, Murai K, Mahbubani K, Stratton MR, et al. (2018). Somatic mutant clones colonize the human esophagus with age. Science 362, 911–917. - PMC - PubMed

LinkOut - more resources