. 2024 Apr 5;16(4):mfae015.
doi: 10.1093/mtomcs/mfae015.

ESI-MS analysis of Cu(I) binding to apo and Zn7 human metallothionein 1A, 2, and 3 identifies the formation of a similar series of metallated species with no individual isoform optimization for Cu(I)

Affiliations

ESI-MS analysis of Cu(I) binding to apo and Zn7 human metallothionein 1A, 2, and 3 identifies the formation of a similar series of metallated species with no individual isoform optimization for Cu(I)

Adyn Melenbacher et al. Metallomics. .

Abstract

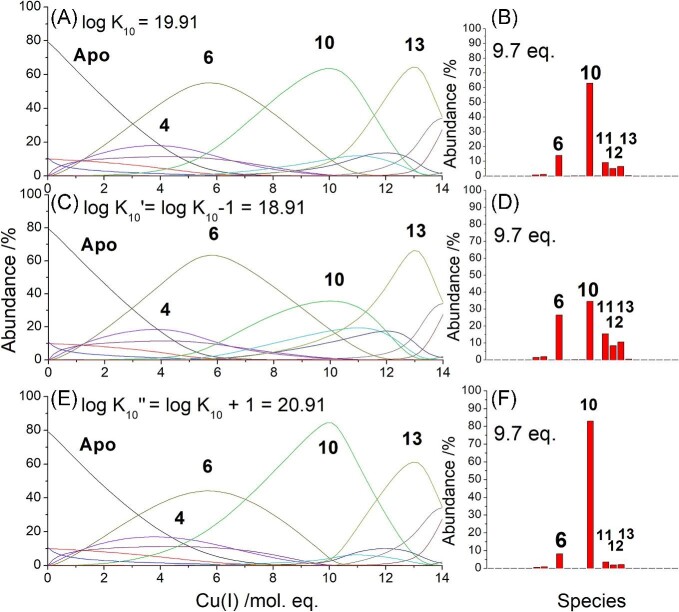
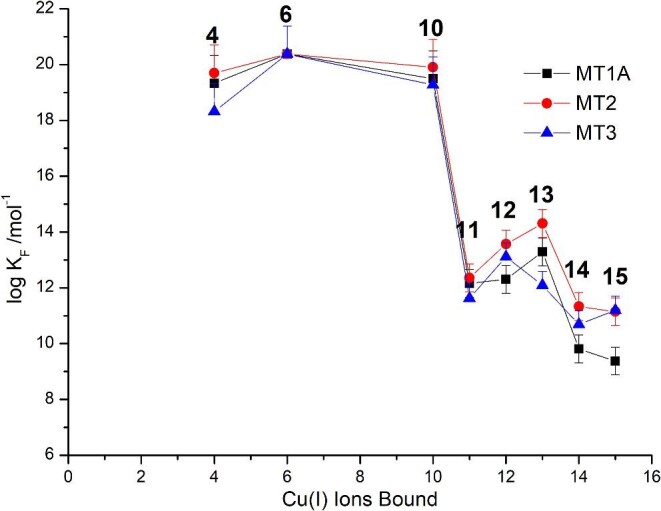
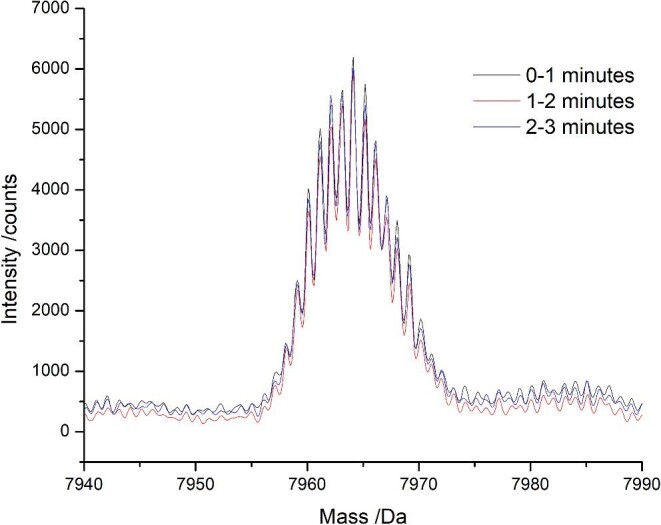
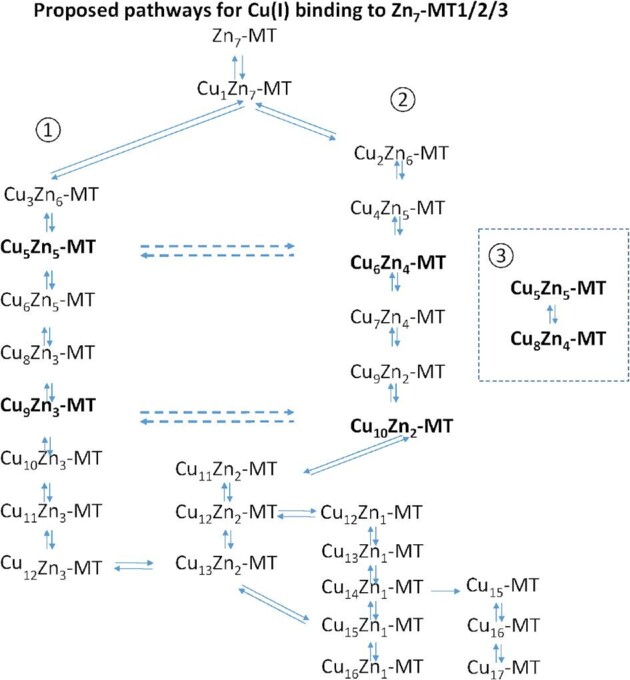
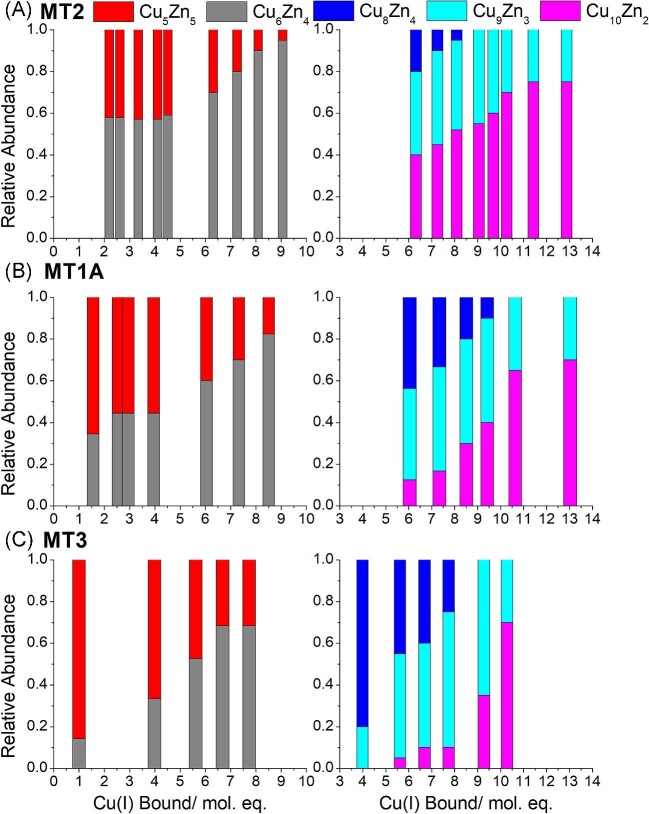
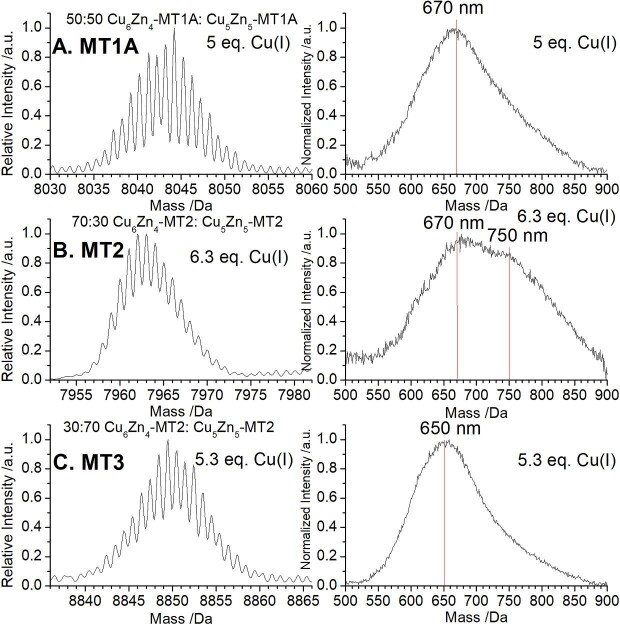
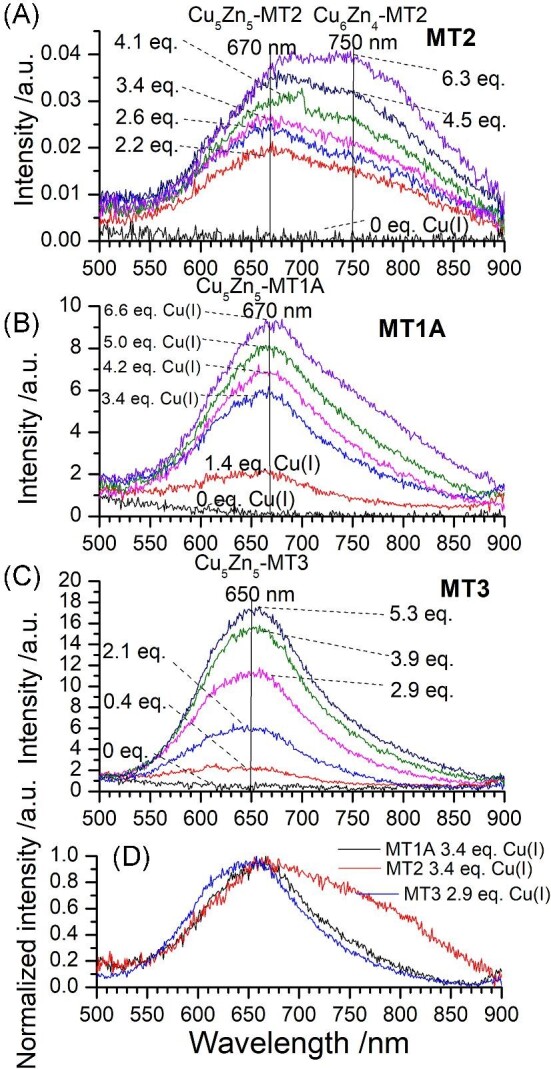
Metallothioneins (MTs) are cysteine-rich proteins involved in metal homeostasis, heavy metal detoxification, and protection against oxidative stress. Whether the four mammalian MT isoforms exhibit different metal binding properties is not clear. In this paper, the Cu(I) binding properties of the apo MT1A, apo MT2, and apo MT3 are compared and the relative Cu(I) binding affinities are reported. In all three isoforms, Cu4, Cu6, and Cu10 species form cooperatively, and MT1A and MT2 also form a Cu13 species. The Cu(I) binding properties of Zn7-MT1A, Zn7-MT2, and Zn7-MT3 are compared systematically using isotopically pure 63Cu(I) and 68Zn(II). The species formed in each MT isoform were detected through electrospray ionization-mass spectrometry and further characterized using room temperature phosphorescence spectroscopy. The mixed metal Cu, Zn species forming in MT1A, MT2, and MT3 have similar stoichiometries and their emission spectral properties indicate that analogous clusters form in the three isoforms. Three parallel metallation pathways have been proposed through analysis of the detailed Cu, Zn speciation in MT1A, MT2, and MT3. Pathway ① results in Cu5Zn5-MT and Cu9Zn3-MT. Pathway ② involves Cu6Zn4-MT and Cu10Zn2-MT. Pathway ③ includes Cu8Zn4-MT. Speciation analysis indicates that Pathway ② is the preferred pathway for MT2. This is also evident in the phosphorescence spectra with the 750 nm emission from Cu6Zn4-MT being most prominent in MT2. We see no evidence for different MT isoforms being optimized or exhibiting preferences for certain metals. We discuss the probable stoichiometry for MTs in vivo based on the in vitro determined binding constants.

Keywords: Cu homeostasis; Cu-thiolate clusters; ESI–MS; Zn homeostasis; metallothionein; phosphorescence.


Conflict of interest statement

There are no conflicts of interest.

Figures

Graphical Abstract
Graphical Abstract
Species with the same stoichiometry and similar emission wavelengths form in MT1A, MT2, and MT3.
Fig. 1
Fig. 1
Comparison of human MT1A (Uniprot #P04731), MT2 (Uniprot #P02795), MT3 (Uniprot #P25713), and MT4 (sequence from Moleirinho et al.) amino acid sequences. Amino acids labeled in red are different compared to the corresponding amino acid in MT1A. Amino acids labeled in blue are similar amino acids to the corresponding amino acid in MT1A.
Fig. 2
Fig. 2
ESI–mass spectral data for the titration of Cu(I) into 50.1 μMapo MT2 at pH 7.4. The full MT2 protein is observed at 7325 Da in the mass spectrum. The main species forming after the addition of Cu(I) are Cu4-MT2, Cu6-MT2, Cu10-MT2, Cu13-MT2, and Cu15-MT2. A fraction of the protein has had the first “GSM” amino acids cleaved from the protein and is seen at 6795 Da (denoted Apo*). These amino acids are not part of the native protein sequence and do not affect metal binding. The Cu(I) metallation of this cleaved MT2 protein mirrors that of the full MT2 protein and the main species that form are Cu4*, Cu6*, Cu10*, Cu13*, and Cu15*. The masses of these species are 531 Da lower than the corresponding species in the full MT2 protein. The metal equivalences noted on the figure refer to the amount of Cu(I) bound to the protein.
Fig. 3
Fig. 3
Speciation resulting from Cu(I) addition to apo MT1A, MT2, and MT3. (A) Experimental speciation (symbols) and simulated HySS speciation (lines) for Cu(I) binding to apo MT1A. Data originally published in Melenbacher et al. (B) Experimental speciation (symbols) and simulated HySS speciation (lines) for Cu(I) binding to apo MT2. (C) Experimental speciation (symbols) and simulated HySS speciation (lines) for Cu(I) binding to apo MT3. Data originally published in Melenbacher and Stillman. Log KF values for key species shown in Fig. 6 and Table 3.
Fig. 4
Fig. 4
Simulated speciation for two values of log K9. Solid lines: Overall speciation if log K= 4.93 and log K10 = 29.31. Dashed lines: Overall speciation if log K= 14.09 and log K10 = 19.91. Remaining log KF values are as reported in Table 3.
Fig. 5
Fig. 5
Simulated speciation and mass spectral profiles for varying log K10 values. (A) Simulated speciation where log K10 = 19.91, the value found to best simulate the experimental data in Fig. 3B. (B) Simulated mass spectral profile for the speciation in A with 9.7 mol. eq. Cu(I). (C) Simulated speciation where log K10ʹ = 18.91(i.e. log K10 − 1). (D) Simulated mass spectral profile for the speciation in C with 9.7 mol. eq. Cu(I). (E) Simulated speciation where log K10ʺ = 20.91 (i.e. log K10 + 1). (F) Simulated mass spectral profile for the speciation in E with 9.7 mol. eq. Cu(I).
Fig. 6
Fig. 6
Log KF values for observed species in the Cu(I) titration of MT1A (black squares), MT2 (red circles), and MT3 (blue triangles). Values listed in Table 3.
Fig. 7
Fig. 7
Deconvoluted Cu5Zn5/Cu6Zn4-MT2 peak calculated from the total ion chromatogram averaged over three separate times points.
Fig. 8
Fig. 8
Speciation resulting from 63Cu(I) addition to 68Zn7-MT1A (A), 68Zn7-MT2 (B), and 68Zn7-MT3 (C) as determined from the corresponding ESI–mass m/z data (reported in Melenbacher et al. and Melenbacher and Stillman,). Only key species are shown for clarity. Full speciation shown in Supplementary Fig. S1.
Fig. 9
Fig. 9
Abundance of Zn7-MT (black squares), Cu1Zn7-MT (red circles), and Cu2Zn6-MT (blue triangles) in MT1A (A), MT2 (B), and MT3 (C). Abundances calculated from ESI–MS data as first reported in Melenbacher et al. and Melenbacher and Stillman.,
Scheme 1
Scheme 1
Proposed pathway of species forming from human Zn7-MT for MT1A, MT2, and MT3 adapted from the pathway proposed for MT2 by Melenbacher and Stillman.
Fig. 10
Fig. 10
Comparison of species abundance for each of MT1A, MT2, and MT3 for the three proposed pathways. Abundance of each of the species detected through ESI–MS as shown in Melenbacher et al. and Melenbacher and Stillman., Red numbers indicate the total number of metals bound to the protein. (A–E) Pathway 1 species formed in MT1A (black), MT2 (red), and MT3 (blue). (F–J) Pathway 2 species formed in MT1A (black), MT2 (red), and MT3 (blue). (K) Pathway 3 species formed in MT1A (black), MT2 (red), and MT3 (blue). Isoform-dependent differences in the abundance of Zn7-MT, Cu1Zn7-MT, and Cu2Zn6-MT shown in Fig. 9.
Fig. 11
Fig. 11
Fraction of different M10 and M12 species forming in MT1A, MT2, and MT3 as a function of Cu(I) bound to the protein. Fractions determined from the ESI–mass spectral data reported in Melenbacher et al. and Melenbacher and Stillman., (A) Left: Fraction of Cu5Zn5-MT2 (red) and Cu6Zn4-MT2 (gray). Right: Fraction of Cu8Zn4-MT2 (blue), Cu9Zn3-MT2 (cyan), and Cu10Zn2-MT2 (pink). (B) Left: Fraction of Cu5Zn5-MT1A (red) and Cu6Zn4-MT1A (gray). Right: Fraction of Cu8Zn4-MT1A (blue), Cu9Zn3-MT1A (cyan), and Cu10Zn2-MT1A (pink). (C) Left: Fraction of Cu5Zn5-MT3 (red) and Cu6Zn4-MT3 (gray). Right: Fraction of Cu8Zn4-MT3 (blue), Cu9Zn3-MT3 (cyan), and Cu10Zn2-MT3 (pink).
Fig. 12
Fig. 12
ESI–mass spectra and emission spectra of Cu5Zn5-MT and Cu6Zn4-MT forming following stepwise Cu(I) metallation of Zn7-MT1A, Zn7-MT2, and Zn7-MT3.The x-axis for the mass spectra shows a 60 Da range centered on the mass of Cu6Zn4-MT for each of MT1A, MT2, and MT3. (A) ESI–mass spectrum (left) and emission spectrum (right) for 5.0 mol. eq. Cu(I) bound to Zn7-MT1A. (B) ESI–mass spectrum (left) and emission spectrum (right) for 6.3 mol. eq. Cu(I) bound to Zn7-MT2. (C) ESI–mass spectrum (left) and emission spectrum (right) for 5.3 mol. eq. Cu(I) bound to Zn7-MT3. Data originally reported in Melenbacher et al. and Melenbacher and Stillman.,
Fig. 13
Fig. 13
Room temperature emission for the addition of 63Cu(I) to 68Zn7-MT1A/2/3. (A) Emission spectra measured for the addition of 63Cu(I) to 68Zn7-MT2 at pH 7.4. (B) Emission spectra measured for the addition of 63Cu(I) to 68Zn7-MT1A at pH 7.4. (C) Emission spectra measured for the addition of 63Cu(I) to 68Zn7-MT3 at pH 7.8. (D) Normalized emission spectra for MT1A (black), MT2 (red), and MT3 (blue) when 2.9–3.4 mol. eq. Cu(I) is bound to the protein. Data originally reported in Melenbacher et al., and Melenbacher and Stillman.,

Similar articles

Cited by

References

    1. Robbins A., McRee D., Williamson M., Collett S., Xuong N., Furey W., Wang B., Stout C., Refined crystal structure of Cd, Zn metallothionein at 2.0 Åresolution, J. Mol. Biol., 1991, 221(4), 1269–1293. - PubMed
    1. Moleirinho A., Carneiro J., Matthiesen R., Silva R. M., Amorim A., Azevedo L., Gains, Losses and Changes of Function after gene duplication: study of the metallothionein family, PLoS One, 2011, 6(4), e18487. 10.1371/journal.pone.0018487 - DOI - PMC - PubMed
    1. Ding Z.-C., Ni F.-Y., Huang Z.-X. Neuronal growth-inhibitory factor (metallothionein-3): structure—function relationships, FEBS J., 2010, 277(14), 2912–2920. 10.1111/j.1742-4658.2010.07716.x - DOI - PubMed
    1. Quaife C. J., Findley S. D., Erickson J. C., Froelick G. J., Kelly E. J., Zambrowicz B. P., Palmiter R. D. Induction of a new metallothionein isoform (MT-IV) occurs during differentiation of stratified squamous epithelia, Biochemistry, 1994, 33(23), 7250–7259. 10.1021/bi00189a029 - DOI - PubMed
    1. Miles A., Hawksworth G., Beattie J., Rodilla V. Induction, regulation, degradation, and biological significance of mammalian metallothioneins, Crit. Rev. Biochem. Mol. Biol., 2000, 35(1), 35–70. 10.1080/10409230091169168 - DOI - PubMed

Publication types