. 2024 Mar 19;15(1):2458.
doi: 10.1038/s41467-024-46594-0.

The bone ecosystem facilitates multiple myeloma relapse and the evolution of heterogeneous drug resistant disease

Affiliations

The bone ecosystem facilitates multiple myeloma relapse and the evolution of heterogeneous drug resistant disease

Ryan T Bishop et al. Nat Commun. .

Abstract

Multiple myeloma (MM) is an osteolytic malignancy that is incurable due to the emergence of treatment resistant disease. Defining how, when and where myeloma cell intrinsic and extrinsic bone microenvironmental mechanisms cause relapse is challenging with current biological approaches. Here, we report a biology-driven spatiotemporal hybrid agent-based model of the MM-bone microenvironment. Results indicate MM intrinsic mechanisms drive the evolution of treatment resistant disease but that the protective effects of bone microenvironment mediated drug resistance (EMDR) significantly enhances the probability and heterogeneity of resistant clones arising under treatment. Further, the model predicts that targeting of EMDR deepens therapy response by eliminating sensitive clones proximal to stroma and bone, a finding supported by in vivo studies. Altogether, our model allows for the study of MM clonal evolution over time in the bone microenvironment and will be beneficial for optimizing treatment efficacy so as to significantly delay disease relapse.


Conflict of interest statement

K.H.S. reports honoraria from Bristol Myers Squibb, Janssen, Adaptive Biotechnology, Sanofi, GlaxoSmithKline, Takeda, Amgen, and Sebia as well as research funding to the institution from AbbVie and Karyopharm. All the other authors have no competing interests.

Figures

Fig. 1
Fig. 1. Development of a hybrid HCA of the naïve and myeloma bone microenvironment.
a Bone-lining osteoblast lineage cells release RANKL inducing fusion and maturation of osteoclasts (1). Osteoclasts resorb the bone, releasing stored bone-derived factors (BDFs) such as TGF-β (2). TGF-β recruits local MSCs and stimulates asymmetric division in to preosteoblasts (2). When TGF-β levels remain high, preosteoblasts rapidly proliferate. Following osteoclast apoptosis, release of TGF-β falls and preosteoblasts differentiate to mature bone producing osteoblasts (3). While TGF-β levels remain low, osteoblasts produce new bone (4). As bone returns to normal, a fraction of the osteoblasts is buried within the matrix becoming terminally differentiated osteoblasts (5), the remaining osteoblasts undergo apoptosis, or become quiescent bone-lining cells (6). Myeloma cells enhance the formation of osteoclasts (7), enhanced bone resorption produces higher levels of BDFs which fuel myeloma growth (8) and inhibit osteoblast differentiation (8) and activity (9). Created with biorender.com. b Interaction diagram between cell types in the HCA and factors such as BDFs and RANKL (created with biorender.com). A more detailed interaction diagram with references can be found in supplementary fig. 1. c Flowcharts describing the sequence of steps followed by preosteoclasts, osteoclasts, MSCs, preosteoblasts, osteoblasts, and myeloma cells.
Fig. 2
Fig. 2. The HCA model captures all stages of bone homeostasis.
a Images from simulations at initial conditions (left) and after 4 years (right). Legend depicts colors of cell types in the model. b BMU is initiated in response to release of RANKL from bone lining cells (1). Preosteoclasts migrate to RANKL and fuse to form an osteoclast under highest concentrations (2). Osteoclasts resorb bone and stored BDFs are released which recruits MSCs. MSCs divide asymmetrically producing preosteoblasts which proliferate rapidly under high TGF-β conditions. Upon completion of resorption, BDF levels fall allowing for preosteoblast differentiation to osteoblasts, osteoblasts form new bone (4) and ultimately undergo apoptosis or become quiescent bone lining cells (5).
Fig. 3
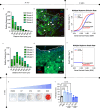
Fig. 3. Multiple myeloma cells receive proliferative and survival advantages from the bone marrow microenvironment.
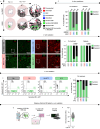
a Quantification of the distance of phosphorylated histone H3 positive (pHH3+; red) myeloma cells (green) to the nearest trabecular or cortical bone in U266GFP-bearing mice 100 days post inoculation. N = 5 tibia. b Representative images from experiment in a, DAPI (blue) was used as a nuclear counterstain. White dotted line indicates tumor bone interface. White scale bar, 50 microns. c Quantification of the distance of TUNEL+ (red) myeloma cells (green) to the nearest trabecular or cortical bone in U266GFP-bearing mice 100 days post inoculation. N = 5 tibia. d Representative image from experiment described in c, DAPI (blue) was used as a nuclear counterstain. White dotted line indicates tumor bone interface. White scale bar, 50 microns. e Images of huMSCs differentiated to different stages of the osteoblast lineage. Cells were stained with Alizarin Red to identify mineralization. f Mean proliferation index of CM-DiL stained U266 cells 7 days after growth in 50% conditioned medium from control wells or cells of the osteoblast lineage. Results are displayed as means of 3 independent biological replicates. Values are mean ± SD. g Plot of functional form used to represent the division rate of myeloma cells in the presence and absence of preosteoblasts/MSCs. h Plot of functional form used to represent the death of myeloma cells when BDF is above and below a threshold. Statistical significance was derived by ordinary one-way ANOVA with a Dunnett’s test for multiple comparisons (f). Source data are provided as a Source Data file for a, c and f. Source data for g and h can be accessed at DOI 10.17605/OSF.IO/TNAX9.
Fig. 4
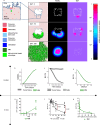
Fig. 4. Computational and biological model outputs of myeloma growth and bone dynamics.
a HCA model images showing single myeloma cell (Day 5), colonization of the marrow by MM cells (Day 75), increased osteoclastogenesis (Day 75, RANKL), bone resorption (Day 75; BDF) and eventual takeover of the marrow by MM cells (Day 350). Light green myeloma cells indicate MM cells with proliferative or survival advantage. b Myeloma growth dynamics in HCA model in the absence of treatment. Values are mean ± SD. c Myeloma induced loss of trabecular bone in HCA model compared to normal bone homeostasis. Values are mean ± SD. d Bone loss decreases rapidly with myeloma expansion in silico. Values are mean ± SD. e Mean Myeloma growth in bone marrow of mice inoculated with U266-GFP cells over time. N = 3–5 tibia per time point. f Trabecular bone volume fraction (BV/TV) was assessed ex vivo with high-resolution microCT. N = 3–5 tibia per time point. g Biological model shows rapid myeloma-induced bone loss. Statistical significance was derived by two-way ANOVA with a Šídák’s test for multiple comparisons (f). Source data are provided as a Source Data file for eg. Source data for bd can be accessed at DOI 10.17605/OSF.IO/TNAX9.
Fig. 5
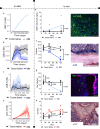
Fig. 5. Computational and biological model outputs of cell types in the myeloma bone microenvironment.
Computational model outputs of increasing MSC percentage of the marrow area (%MA) (a), loss of osteoblasts (b) rise and fall of preosteoblast percentage (c) and increasing osteoclast percentage due to growth of MM (d) Values are mean ± SD. Ex vivo analysis of histological sections from the U266-GFP myeloma model (N = 3-5 tibia per time point) demonstrates increasing presence of αSMA+ MSCs (e), loss of ALP+ cuboidal osteoblasts (f), early increase and subsequent reduction of OSX+ preosteoblasts (g) and increasing numbers of TRAcP+ multinucleated osteoclasts (h) compared to tumor naïve mice. Scale bars are 50 microns (e, g) 100 microns (f, h). Statistical significance was determined by two-way ANOVA with a Šídák’s test for multiple comparisons (eh). Source data are provided as a Source Data file for e–h. Source data for ad can be accessed at DOI 10.17605/OSF.IO/TNAX9.
Fig. 6
Fig. 6. EMDR contributes to minimal residual disease and relapse.
a GFP + U266 MM were plated alone or with huMSCs in the presence or absence of BTZ; MM burden was measured after 72 h by area covered by GFP+ cells. n = 3 biological independent samples. Values are mean ± SD. b Interaction diagram showing the cell types and factors in the HCA that are affected by BTZ or contribute to EMDR. c In vivo growth of MM cells with and without BTZ treatment, data was taken from. Model outputs of MM growth with continuous BTZ treatment, +/− EMDR when MM cells do not develop resistance (d) or with a probability to develop resistance (10−4, e or 10−3, f) and develop resistance. gi, Kaplan-Meier plot of relapse-free survival from simulations described in df. Error bands represent 95% confidence intervals. j Nuclear-eYFP+ U266 were cultured alone or with huMSCs in the presence or absence of 10 nM of BTZ. Mean MM growth (n = 6 biologically independent samples per group) was tracked by eYFP over 60 days. Values are mean ± SD.Yellow shading indicates periods when treatment was on. k Kaplan-Meier plot of ‘relapse’ (wells reaching >20% MM confluency) from experiment described in j. l Mean MM cell numbers (initial seeding 90% U266- Nuclear-eYFP+ and 10% PSR-RFP+; n = 6 biologically independent samples per group) were cultured alone or with huMSCs in the presence or absence of 10 nM of BTZ. m Kaplan-Meier plot of ‘relapse’ (wells reaching >20% MM confluency) from experiment described in l. Values are mean ± SD. n = 6 biologically independent samples per group. n Median U266 growth by BLI after MM cells (90% U266-GFP+Luc+, 10% PSR-RFP) were tail vein injected into NSG mice. Values are median ± 95% confidence intervals. Mice were divided into two groups and pre-treated with vehicle or Zol (30 μg/kg) for 1 week prior to mice being randomized and treated with either vehicle (n = 5 mice), Zol (n = 5 mice), Zol+BTZ (n = 7 mice), or BTZ (0.5 mg/kg; n = 4 mice). Pink and green arrows indicate days of Zol or BTZ treatment respectively. o, Representative BLI IVIS images from the day 28 of the experiment described in n. Statistical significance was determined by two-way ANOVA with Bonferroni correction (a), Šídák’s (j, l and n), Tukey’s test for multiple comparison (n) and log-rank test (gi, k, and m). Source data are provided as a Source Data file for a, jn and f. Source data for di can be accessed at DOI 10.17605/OSF.IO/TNAX9.
Fig. 7
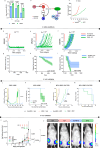
Fig. 7. EMDR contributes protection of sensitive MM and tumor heterogeneity.
a HCA images from simulations with continuous BTZ application, with no resistance probability (pΩ = 0) or high resistance probability (pΩ = 10−3) in the presence or absence of EMDR. Gray resistant myeloma cells are near MSCs or BDFs but not protected by EMDR. b Computational outputs of the proportion of BTZ-sensitive and BTZ-resistant MM cells 1 year on treatment (left) and at relapse (right) with p = 10−3. Values are mean ± SD. Related to Figs. 6f and i. c Representative images of U266-nuclear eYFP+ and PSR-RFP+ cells at relapse when cultured alone or huMSCs, with or without BTZ in vitro. Related to Fig. 6j, k. d The proportion of BTZ-sensitive (U266-nuclear eYFP+) and BTZ-resistant (PSR-RFP + MM cells cultured alone or with huMSCs with and without BTZ on treatment (left) and at relapse (right). Related to Figs. 6l, m and 7d. Values are mean ± SD. e Representative flow plots of BTZ-sensitive (U266 GFP+Luc+; green) and BTZ-resistant (PSR-RFP+; black) from the bone marrow (gray) of NSG mice treated with vehicle, Zol, Zol+BTZ or BTZ. Vehicle = 10 femur, Zol = 10 femur, Zol+BTZ = 12 femur, BTZ = 8 femur. f Proportion of BTZ-sensitive (U266 GFP+Luc+) and BTZ-resistant (PSR-RFP+) MM cells in the bone marrow of NSG mice treated with Vehicle = 10 femur, Zol = 10 femur, Zol+BTZ = 12 femur, BTZ = 8 femur. Values are mean ± SD. g Schematic of the EMMA platform. CD138 + MM cells and stroma are isolated from MM patients and co-cultured with test compounds. Live cell imaging is used to assess viability. Created with biorender.com. h The AUC of MM cells from RRMM patients (n = 86 patient samples), whose last relapse was to a PI-containing treatment (last TX) in response to BTZ treatment ex vivo. Data are presented as a box plot (centre line at the median, upper bound at 75th percentile, lower bound at 25th percentile with whiskers at minimum and maximum values). Each dot represents one MM sample. Green dots identify sensitive MM samples (quartile 1). White dots identify samples in quartiles 2−4. Statistical significance was determined by two-way ANOVA Šídák’s multiple comparison (d, f). Source data are provided as a Source Data file for d, f, h. Source data for a, b can be accessed at DOI 10.17605/OSF.IO/TNAX9.
Fig. 8
Fig. 8. EMDR contributes to tumor heterogeneity upon relapse.
a Muller plots of sensitive and individual BTZ resistant (Res) sub-clones from simulations described in a-c. Colors denote different subclones. Red arrow indicates start of BTZ treatment. b Images of GFP + U266 (green) and RFP + PSR (red) MM cells and cell nuclei (DAPI; blue) in tibial sections of mice from in vivo study described in Fig. 7. Magnification 20X. Scale bar 50 microns. c Relative quantification of GFP + U266 and PSR MM in tibial sections described in Fig. 8b. Vehicle = 5 tibia, Zol = 5 tibia, Zol+BTZ = 7 tibia, BTZ = 4 tibia. Values are mean ± SD. d Mean number of resistant sub-clones arising following BTZ treatment tumors that reached 20% with resistant subclones and the locations within the bone marrow microenvironment where each subclone originated, with/without EMDR from simulations described in a. The n number represents the number of simulations that developed resistance out of the 25 independent simulations. n = 13/25 (No Treatment), n = 10/25 (No EMDR + BTZ), n = 24/25 (EMDR + BTZ). Values are mean ± SD. Statistical significance was determined by two-way ANOVA with a Šídák’s multiple comparison (c) or Tukey’s test (d). Source data are provided as a Source Data file for c and d. Source data for a can be accessed at DOI 10.17605/OSF.IO/TNAX9.

References

    1. Howlader N. N. A., et al. SEER Cancer Statistics Review, 1975-2016, National Cancer Institute. (2019).
    1. Galson DL, Silbermann R, Roodman GD. Mechanisms of multiple myeloma bone disease. Bonekey Rep. 2012;1:135. doi: 10.1038/bonekey.2012.135. - DOI - PMC - PubMed
    1. Roodman GD. Pathogenesis of myeloma bone disease. J. Cell Biochem. 2010;109:283–291. doi: 10.1002/jcb.22403. - DOI - PubMed
    1. Cowan AJ, et al. Diagnosis and Management of Multiple Myeloma: A review. JAMA. 2022;327:464–477. doi: 10.1001/jama.2022.0003. - DOI - PubMed
    1. Abdi J, Chen G, Chang H. Drug resistance in multiple myeloma: latest findings and new concepts on molecular mechanisms. Oncotarget. 2013;4:2186–2207. doi: 10.18632/oncotarget.1497. - DOI - PMC - PubMed