Clinical Trial
. 2024 Mar 19;15(1):2446.
doi: 10.1038/s41467-024-45835-6.

Exemestane plus everolimus and palbociclib in metastatic breast cancer: clinical response and genomic/transcriptomic determinants of resistance in a phase I/II trial

Affiliations
Clinical Trial

Exemestane plus everolimus and palbociclib in metastatic breast cancer: clinical response and genomic/transcriptomic determinants of resistance in a phase I/II trial

Jorge Gómez Tejeda Zañudo et al. Nat Commun. .

Abstract

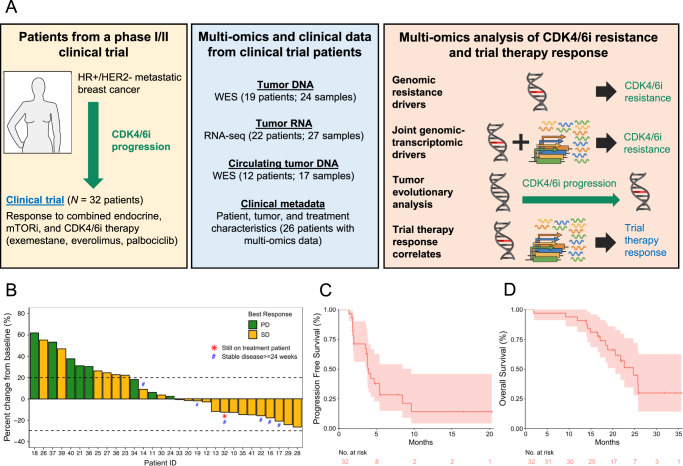
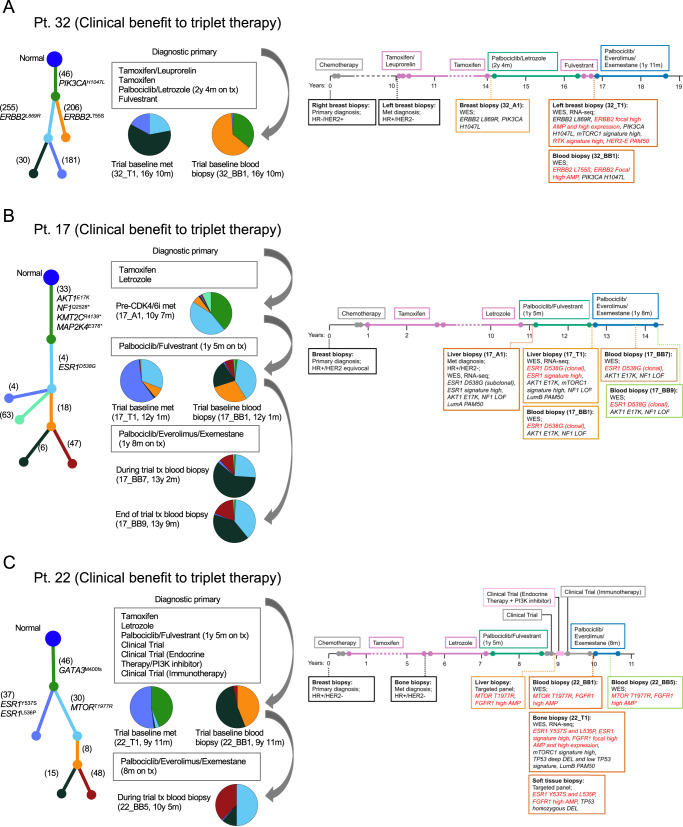
The landscape of cyclin-dependent kinase 4/6 inhibitor (CDK4/6i) resistance is still being elucidated and the optimal subsequent therapy to overcome resistance remains uncertain. Here we present the final results of a phase Ib/IIa, open-label trial (NCT02871791) of exemestane plus everolimus and palbociclib for CDK4/6i-resistant metastatic breast cancer. The primary objective of phase Ib was to evaluate safety and tolerability and determine the maximum tolerated dose/recommended phase II dose (100 mg palbociclib, 5 mg everolimus, 25 mg exemestane). The primary objective of phase IIa was to determine the clinical benefit rate (18.8%, n = 6/32), which did not meet the predefined endpoint (65%). Secondary objectives included pharmacokinetic profiling (phase Ib), objective response rate, disease control rate, duration of response, and progression free survival (phase IIa), and correlative multi-omics analysis to investigate biomarkers of resistance to CDK4/6i. All participants were female. Multi-omics data from the phase IIa patients (n = 24 tumor/17 blood biopsy exomes; n = 27 tumor transcriptomes) showed potential mechanisms of resistance (convergent evolution of HER2 activation, BRAFV600E), identified joint genomic/transcriptomic resistance features (ESR1 mutations, high estrogen receptor pathway activity, and a Luminal A/B subtype; ERBB2/BRAF mutations, high RTK/MAPK pathway activity, and a HER2-E subtype), and provided hypothesis-generating results suggesting that mTOR pathway activation correlates with response to the trial's therapy. Our results illustrate how genome and transcriptome sequencing may help better identify patients likely to respond to CDK4/6i therapies.


Conflict of interest statement

J.G. owns stocks in the biotechnology exchange-traded funds CNCR, IDNA, IBB, and XBI, and owned stocks in Adaptive Biotechnologies, 2seventy bio, and bluebird bio. R.B.-S. has received consulting fees from AstraZeneca, Eli Lilly, Libbs, Merck, Roche, and Zodiac; non-CME fees from Bard Access, BMS, Eli Lilly, Libbs, Merck, Novartis, Pfizer, and Roche; has carried out contracted research for Roche; and has received travel, accommodation and expenses from Eli Lilly, Roche, Daichi Sankyo, and Merck. E.J. is a current employee of Repare Therapeutics. J.E.B.-B. is a current employee of Cellarity. A.R.F. has received honoraria from Bayer, Daiichi Sankyo, Novartis, and Roche; and has received travel grants from Roche. N.U.L. has received consulting fees from Puma, Seattle Genetics, Daichii-Sankyo, AstraZeneca, Denali Therapeutics, Prelude Therapeutics, Olema Pharmaceuticals, Aleta BioPharma, Affinia Therapeutics, Voyager Therapeutics, Janssen, and Blueprint Medicines; has received institutional research support from Genentech, Pfizer, Merck, Seattle Genetics, Zion Pharmaceuticals, Olema Pharmaceuticals, and AstraZeneca; and has stocks and other ownership interests in Artera Inc. (<$50k and <5% as it relates to consulting activities—options are not currently valued or in-hand); and royalties from UptoDate (book). N.W. is a current employee of Genentech; has been a consultant/advisor for Eli Lilly; has been in the scientific advisory board for Relay Therapeutics and Flare Therapeutics; has received grant support from AstraZeneca and Puma Biotechnologies. S.M.T. reports consulting or advisory roles for Novartis, Pfizer, Merck, Eli Lilly, AstraZeneca, Genentech/Roche, Eisai, Sanofi, Bristol Myers Squibb, Seattle Genetics, CytomX Therapeutics, Daiichi Sankyo, Gilead, Ellipses Pharma, 4D Pharma, OncoSec Medical Inc., BeyondSpring Pharmaceuticals, OncXerna, Zymeworks, Zentalis, Blueprint Medicines, Reveal Genomics, ARC Therapeutics, Infinity Therapeutics, Myovant, Zetagen, Umoja Biopharma, Artios Pharma, Menarini/Stemline, Aadi Biopharma, Bayer, and Incyte Corp; and research funding from Genentech/Roche, Merck, Exelixis, Pfizer, Lilly, Novartis, Bristol Myers Squibb, Eisai, AstraZeneca, Gilead, NanoString Technologies, Gilead, Seattle Genetics, and OncoPep. The remaining authors declare no competing interests.

Figures

Fig. 1
Fig. 1. Methodological overview of this work and plots for the phase II portion of the clinical trial.
A Graphical methodological overview. B Waterfall plot of best percentage change from baseline of tumor lesions. Patients 15 and 31, who stopped treatment before tumor response could be evaluated, were excluded from this plot. C Progression-free survival (PFS) Kaplan–Meier curve. The median PFS is 3.94 months (95% confidence interval (CI): 3.68–9.63). D Overall survival (OS) Kaplan–Meier curve. The median OS is 24.7 months (95% CI: 20.6 – N/A). n = 32 patients were included in the phase II portion of the trial.
Fig. 2
Fig. 2. Genomic landscape of resistance to CDK4/6 inhibitors in clinical trial baseline biopsies.
The genomic landscape recapitulates known driver genes and pathways of CDK4/6i resistance and putative driver genes and mutations (BRAFV600E, MTORT1977R, PIK3CAE545K,G1007R). A Cohort of tumor and blood biopsies used for multi-omics analysis and their timing. Patients received triplet therapy (palbociclib + everolimus + exemestane) as part of the clinical trial, and had progressed on a prior CDK4/6i and a prior endocrine therapy. BD Comutation plots (CoMut) representing the genomic landscape of baseline tumor and blood biopsies from the clinical trial. All baseline tumor biopsies are shown in (B) (n = 18 samples from n = 18 patients); paired baseline tumor and blood biopsies from patients with distinct co-existing tumor lineages are shown in (C) (n = 4 samples from n = 2 patients); baseline blood biopsies from patients with no paired tumor biopsy are shown in (D) (n = 1 sample from n = 1 patient). In each panel, biopsies are ordered by treatment duration on triplet therapy. Copy-number alterations and nonsynonymous mutations from selected genes (including all from Wander et al.) are shown. Genes are arranged based on their pathway and include all genes with 2 or more known oncogenic mutations in the cohort. Clinical parameters shown include trial treatment information (trial treatment duration, clinical benefit and best response by RECIST 1.1, reason for discontinuation of treatment), prior CDK4/6i treatment information (CDK4/6i received, anti-estrogen agent used in combination, phenotype based on prior CDK4/6i response), receptor status (biopsy-level, at primary diagnosis, and at metastatic diagnosis), timing of biopsy relative to metastatic diagnosis, and biopsy site. Research-based PAM50 subtype (when RNA-seq data is available) and tumor mutational burden of each biopsy are also shown. Source data are provided as a Source Data file.
Fig. 3
Fig. 3. Consistency between genomic and transcriptomic features in genes associated with CDK4/6 inhibitors and antiestrogen treatment resistance.
Joint genomic and transcriptomic analysis was performed on all baseline trial tumor biopsies with both WES and RNA-seq and a non-Normal PAM50 subtype (n = 12 samples and patients). A A comutation plot (CoMut) shows the consistency between the presence of oncogenic alterations and the activity of transcriptional signatures of their associated signaling pathway. Distinct genes and signatures are displayed, depending on the pathway (ER, PI3K/AKT/mTOR, RTK/MAPK, and P53). For each pathway, only genes from Fig. 2 with at least one known oncogenic mutation in the samples with transcriptomic data are shown. Biopsies are ordered based on the combined activity of the pathway signatures. B A CoMut displays the association between the presence of oncogenic mutations in ERBB2 or BRAF and a HER2-enriched subtype, and oncogenic mutations in ESR1 and a Luminal A or B subtype. Biopsies are ordered based on their correlation to the HER2-enriched centroid. Additional features shown are clinical and RNA-seq-based measures of ER and HER2 activity (HR and HER2 receptor status, ER percentage by IHC, HER2 IHC score, ESR1 and ERBB2 gene expression, and activity of the RTK ACT and estrogen response early transcriptional signatures) and biopsy site. An expanded version of (A) and (B) with additional clinical, genomic, and transcriptomic features is included in Supplementary Fig. 2. C A CoMut shows the concordance between high-grade CNA and gene expression levels. Cases with CNA and gene expression concordance (high amplification or focal high amplification and upper quartile or decile expression; deep deletion and lower quartile or decile expression) are indicated with a black dot. Quantiles for transcriptional signature activity and gene expression levels are derived from MBCProject. Statistically significant associations between signature activities and known oncogenic mutations in (B) and (C) are denoted with asterisks (one-sided Mann–Whitney test). ESR1 activating mutations vs estrogen response early (AUC = 1.00, P = 1.08 × 10−3), ESR1 activating mutations vs estrogen response late (AUC = 0.86, P = 2.06 × 10−2), one-sided Mann–Whitney test), PI3K/AKT/mTOR activating pathway mutations vs combined activity of mTORC1 signaling and PI3K/AKT/mTOR signaling (AUC = 0.83, P = 3.25 × 10⁻²), grouped ERBB2 or BRAF activating mutations vs RTK ACT signature (AUC = 0.96, P = 9.09 × 10−3), grouped ERBB2 or BRAF activating mutations vs HER2 MUT signature (AUC = 0.96, P = 9.09 × 10−3), grouped TP53 biallelic inactivation and deep deletions vs P53 pathway signature (AUC = 0.93, P = 1.81 × 10−2), grouped ERBB2 and BRAF activating mutations vs HER2-E PAM50 centroid (AUC = 0.93, P = 1.82 × 10−2), and activating ESR1 mutations vs HER2-E PAM50 centroid (AUC = 0.92, P = 7.58 × 10−3). (*) P < 0.05, (**) P < 0.01. Source data are provided as a Source Data file.
Fig. 4
Fig. 4. Clinical, genomic, and transcriptomic features can explain resistance to CDK4/6 inhibitors and antiestrogen treatment in patient’s tumors.
n = 23 patients. GOF gain of function mutation, LOF loss of function mutation, AMP high amplification, Pt patient. Source data are provided as a Source Data file.
Fig. 5
Fig. 5. Tumor evolutionary analysis and clinical vignettes for patients who derived clinical benefit from palbociclib, everolimus, and exemestane triplet therapy.
Analysis of tumor phylogeny and clonal dynamics following CDK4/6i and anti-ER therapy revealed convergent (HER2 activation) and divergent (ER or PI3K/AKT/mTOR activation) paths to treatment resistance in tumors with distinct lineages (A, B). Evolutionary analysis, acquired genomic alterations to prior CDK4/6i, and treatment history is shown for patients with pre-CDK4/6i and post-CDK4/6i (trial baseline) biopsies. A shows convergent evolution of ERBB2 activation in two distinct co-existing tumor lineages (an activating clonal ERBB2L869R mutation and an acquired ERBB2 focal high amplification in 32_T1; an acquired activating high-clonality ERBB2L755S mutation in 32_BB1). B shows an increase in the clonality of an activating ESR1D538G mutation (from subclonal to clonal). C shows a case with two distinct co-existing tumor lineages in its post-CDK4/6i biopsies, each with clonal drivers mutations in divergent pathways (ER pathway with an activating clonal ESR1Y537S,L536P mutation in 22_T1; PI3K/AKT/mTOR pathway with an activating clonal MTORT1977R mutation in 22_BB1). Even though no pre-CDK4/6i biopsy was available for this patient, targeted panel data from other post-CDK4/6i biopsies confirmed the existence of these tumor lineages. In a patient’s tumor phylogenic tree, each subclone is associated with a branch and a color, and this color matches the color in the pie chart that quantifies the relative abundance of each subclone in the tumor. The number of mutations unique to each subclone and known oncogenic mutations are shown next to each branch. Data shown in the clinical vignettes includes the timing of treatments and biopsies, and selected clinical, genomic, and transcriptomic features. Time on treatment for CDK4/6i-containing therapies is included in the figure. Acquired genomic alterations (in A, B) or putatively acquired genomic alterations (in C) following CDK4/6i therapy are shown in red, together with their associated transcriptomic features.
Fig. 6
Fig. 6. Tumor evolutionary analysis and clinical vignettes for patients who did not derive clinical benefit from palbociclib, everolimus, and exemestane triplet therapy.
Evolutionary analysis, acquired genomic alterations to prior CDK4/6i, and treatment history are shown for these patients. A shows acquired clonal activating BRAFV600E mutation concurrent with ER loss. Transcriptomic features (low ESR1 expression, HER2-enriched PAM50, high RTK signature activity) are concordant with these acquired events. B shows clonal activating AKTE17K and ESR1D538G mutations. C shows clonal ESR1H524L mutation (variant of unknown significance), an acquired subclonal GATA3−412fs truncating mutation, and an increased ESR1 amplification (from amplification to high amplification). In a patient’s tumor phylogenic tree, each subclone is associated with a branch and a color, and this color matches that in the pie chart that quantifies the relative abundance of subclones. The number of mutations unique to each subclone and known oncogenic mutations are shown next to each branch. Data shown in the clinical vignettes includes the timing of treatments and biopsies, and selected clinical, genomic, and transcriptomic features. Time on treatment for CDK4/6i-containing therapies is included in the figure. Acquired genomic alterations following CDK4/6i therapy are shown in red, together with their associated transcriptomic features.
Fig. 7
Fig. 7. Correlation between mTOR pathway activity and response to triplet therapy in baseline tumor samples.
A A comutation plot (CoMut) displays the putative association between clinical benefit to triplet therapy and the presence of genomic or transcriptomic features associated with PI3K/AKT/mTOR pathway activation. n = 23 patients. Each tumor and blood biopsy sample from patients that derived clinical benefit had either a known oncogenic mutation in AKT1, PIK3CA, or MTOR, or high activity of the mTORC1 signaling signature. Notably, two out of four patients with AKT1E17K mutations discontinued treatment because of toxicity. PI3K/AKT/mTOR pathway genes with at least one known oncogenic mutation are shown. Baseline tumor samples with either WES or RNA-seq are shown. Baseline blood biopsies were included when they were from a distinct lineage than the tumor biopsy (22_BB1, 32_BB2) or when there were no sequenced tumor biopsies (19_BB1). Biopsies are ordered by treatment duration on triplet therapy. (B-D) show top results from comparing Hallmark signature activity in baseline tumor biopsies, with or without clinical benefit. The mTORC1 signaling signature is one of the top signatures associated with clinical benefit. B, C show Welch’s t-test (two-sided) results and Hallmark signature activity for mTORC1 signaling, respectively (clinical benefit, n = 3 samples and patients; no clinical benefit, n = 12 samples and patients). D displays Fisher exact test (two-sided) results, comparing enrichment of tumors with a Hallmark signature activity in the upper or lower quartiles (clinical benefit, n = 3 samples and patients; no clinical benefit, n = 12 samples and patients). The Hallmark signatures contain 50 gene sets in total. Quantiles for transcriptional signature activity are derived from MBCProject. Boxplots span the interquartile range (IQR: 25–75th percentile) and have a center line denoting the median. Boxplot whiskers indicate the 1.5 × IQR below or above the boxplot span. Source data are provided as a Source Data file.

References

    1. Spring LM, et al. Cyclin-dependent kinase 4 and 6 inhibitors for hormone receptor-positive breast cancer: past, present, and future. Lancet. 2020;395:817–827. doi: 10.1016/S0140-6736(20)30165-3. - DOI - PubMed
    1. Condorelli R, et al. Polyclonal RB1 mutations and acquired resistance to CDK 4/6 inhibitors in patients with metastatic breast cancer. Ann. Oncol. 2018;29:640–645. doi: 10.1093/annonc/mdx784. - DOI - PubMed
    1. O’Leary B, et al. The genetic landscape and clonal evolution of breast cancer resistance to palbociclib plus fulvestrant in the PALOMA-3 trial. Cancer Discov. 2018;8:1390–1403. doi: 10.1158/2159-8290.CD-18-0264. - DOI - PMC - PubMed
    1. Li Z, et al. Loss of the FAT1 tumor suppressor promotes resistance to CDK4/6 inhibitors via the hippo pathway. Cancer Cell. 2018;34:893–905.e898. doi: 10.1016/j.ccell.2018.11.006. - DOI - PMC - PubMed
    1. Wander SA, et al. The genomic landscape of intrinsic and acquired resistance to cyclin-dependent kinase 4/6 inhibitors in patients with hormone receptor–positive metastatic breast cancer. Cancer Discov. 2020;10:1174–1193. doi: 10.1158/2159-8290.CD-19-1390. - DOI - PMC - PubMed

Publication types