. 2024 Mar 19;15(1):2456.
doi: 10.1038/s41467-024-46484-5.

The influence of cortical activity on perception depends on behavioral state and sensory context

Affiliations

The influence of cortical activity on perception depends on behavioral state and sensory context

Lloyd E Russell et al. Nat Commun. .

Abstract

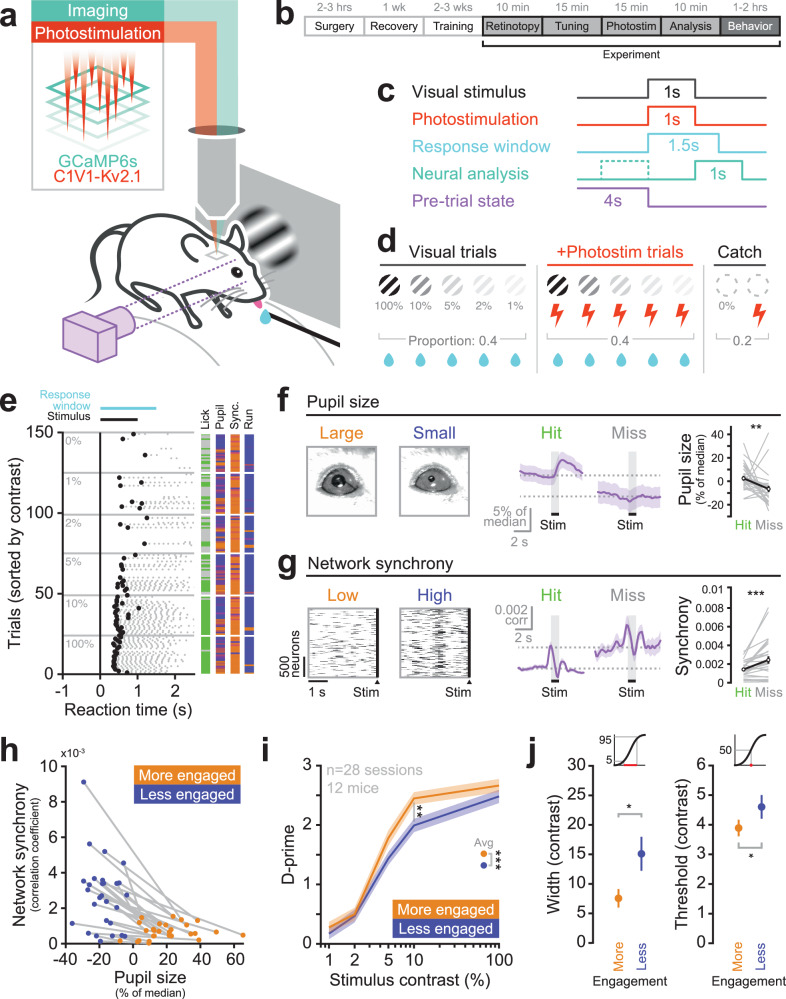
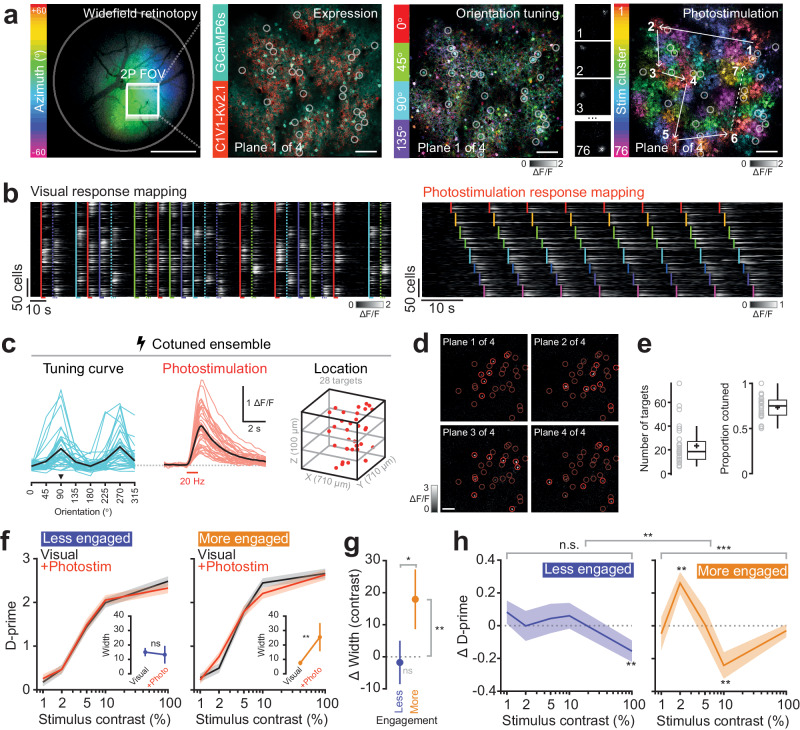
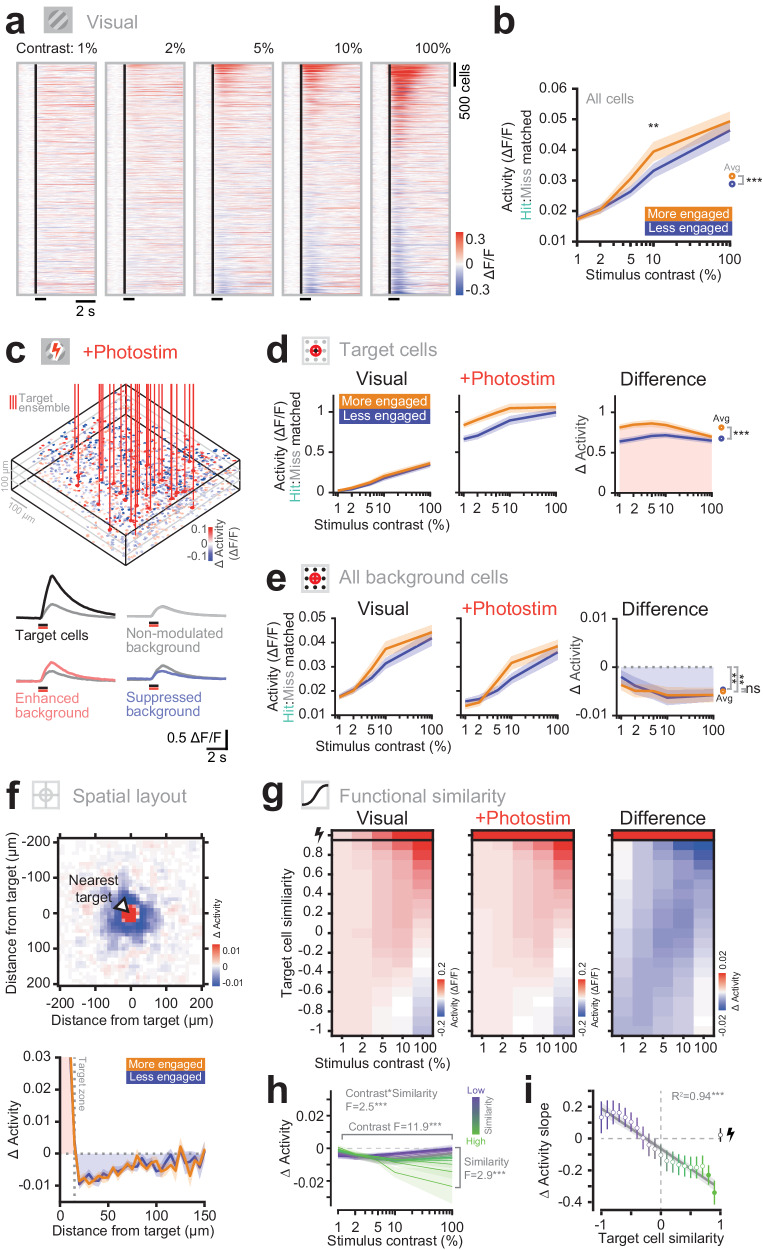
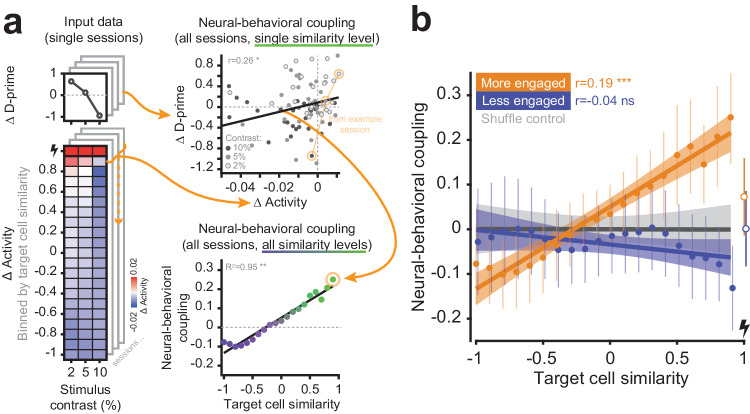
The mechanistic link between neural circuit activity and behavior remains unclear. While manipulating cortical activity can bias certain behaviors and elicit artificial percepts, some tasks can still be solved when cortex is silenced or removed. Here, mice were trained to perform a visual detection task during which we selectively targeted groups of visually responsive and co-tuned neurons in L2/3 of primary visual cortex (V1) for two-photon photostimulation. The influence of photostimulation was conditional on two key factors: the behavioral state of the animal and the contrast of the visual stimulus. The detection of low-contrast stimuli was enhanced by photostimulation, while the detection of high-contrast stimuli was suppressed, but crucially, only when mice were highly engaged in the task. When mice were less engaged, our manipulations of cortical activity had no effect on behavior. The behavioral changes were linked to specific changes in neuronal activity. The responses of non-photostimulated neurons in the local network were also conditional on two factors: their functional similarity to the photostimulated neurons and the contrast of the visual stimulus. Functionally similar neurons were increasingly suppressed by photostimulation with increasing visual stimulus contrast, correlating with the change in behavior. Our results show that the influence of cortical activity on perception is not fixed, but dynamically and contextually modulated by behavioral state, ongoing activity and the routing of information through specific circuits.


Conflict of interest statement

The authors declare no competing interests.

Figures

Fig. 1
Fig. 1. Visual stimulus detection is modulated by behavioral state.
a Experiment schematic. Mice coexpress GCaMP6s and C1V1-Kv2.1 in excitatory neurons of L2/3 V1 enabling simultaneous two-photon calcium imaging and two-photon holographic stimulation. Mice are head-fixed and trained to perform a visual stimulus detection task. Pupil size is recorded with a camera. b Timeline of animal preparation, training, and experiment. c Behavioral trial structure. After withholding licks for a randomized interval (4 ± 3 s) a stimulus (visual and/or optogenetic) is presented to the mouse. When a visual stimulus is presented the mouse has 1.5 s to lick the lickometer in order to receive a water reward. Neural analysis is performed in the 1 s immediately following stimulus offset (to avoid photostimulation artifact) using the 1 s immediately prior to the stimulus as baseline. The state of the animal is measured in the 4 s preceding the delivery of the stimulus. d Behavioral session structure. 12 different trial types are presented to the mouse in a pseudorandom blocked structure. Visual-only trials (40% of session) of varying contrast (1%, 2%, 5%, 10% and 100%) are interleaved with Visual+Photostimulation trials (40% of session) where a 1 s 20 Hz photostimulation is delivered coincident with the visual stimulus. Catch trials (20% of session) with and without photostimulation are delivered to assess chance licking probabilities. Any trial with a visual stimulus is rewarded if the mouse responds during the response window. e Example lick raster plot. Trials were delivered pseudorandomized but are shown sorted by stimulus contrast. Gray dots indicate lick responses, with the first lick (reaction time) highlighted in black. Right: the simultaneously recorded pre-trial pupil size, neuronal synchrony and running speed are shown for each trial. Orange indicates large values, blue indicates small values. f Pupillometry is performed throughout the behavioral session. Large and small pupil sizes are seen (left) reflecting different behavioral states. Stimulus triggered average pupil traces are averaged across all hit or miss trials of threshold stimuli, and then averaged across sessions (middle). On visual-only threshold trials hits (mice licked within response window) are associated with a larger pupil prior to the stimulus delivery (right). Error bars show mean ± SEM across sessions, n = 28 sessions, 12 mice. g Neuronal synchrony in the pre-trial period is computed as the average pairwise correlation between all pairs of cells’ deconvolved activity traces. Periods of low and high synchrony are seen (left) reflecting different behavioral states. Stimulus triggered average correlation traces are averaged across all hit or miss threshold trials, and then averaged across sessions. Note the traces are made with a 4 s sliding window hence the synchrony appears to increase before the stimulus is delivered (middle). On threshold contrast visual-only trials hits are associated with a lower level of synchrony prior to the stimulus delivery (right). Error bars show mean ± SEM across sessions, n = 28 sessions, 12 mice. h Each session is median-split into two collections of interspersed trials, based on pupil size (normalized relative to the median size in the session) and network synchrony (average pairwise Pearson’s correlation coefficient between all recorded neurons) on each trial preceding stimulus delivery. The more engaged state contains trials with the largest pupil sizes and lowest neuronal synchrony. The less engaged state contains trials with the smallest pupil sizes and highest neuronal synchrony. Each dot represents the average pupil size and synchrony for that state of a given session. Gray lines connect the two states in a given session (n = 28 sessions, 12 mice). i The behavior of the mice differs in the two states. The “more engaged” state, the state with large pupil size and low neuronal synchrony, is associated with higher stimulus detection rates, as expressed by higher d-prime values. Error bars show mean ± SEM across sessions. j The psychometric function is steeper (left) and more sensitive (right) when the animal is engaged. Error bars show mean ± SEM across sessions, n = 28 sessions, 12 mice. The insets above the plots illustrate the measurement of psychometric curve width (left) and threshold (right).
Fig. 2
Fig. 2. Targeted photostimulation of stimulus coding neurons in L2/3 V1 bidirectionally modulates stimulus detection when mice are engaged in the task.
a From left to right, first panel: One-photon widefield imaging is performed while presenting drifting bars to the mouse to locate primary visual cortex. The two-photon FOV is positioned in a region with good GCaMP and opsin expression. The task visual stimuli are positioned in the retinotopically appropriate location. Scale bar represents 1 mm. Second panel: Example FOV (one plane from a 4-plane volume) showing construct expression in L2/3 mouse primary visual cortex. GCaMP6s is expressed transgenically and C1V1-Kv2.1 is expressed virally through injection. Third panel: Visual stimulus orientation preference map. 4 different orientations of drifting gratings are presented to the mouse. Pixel intensity is dictated by the stimulus triggered average response magnitude. Hue corresponds to preferred stimulus orientation. Fourth panel: Photostimulation responsivity of the FOV to clustered randomized photostimulation. The majority of recorded cells were grouped into 76 different clusters of 50 cells each (distributed across 4 planes) and targeted for sequential photostimulation to confirm responsivity prior to the experiment. Pixel intensity indicates the change in fluorescence caused by photostimulation. Color corresponds to the photostimulation cluster which caused the largest change in activity. White circles indicate example targets within this plane ultimately selected for targeted photostimulation of a co-tuned ensemble. All scale bars 100 μm. Examples shown are from one representative experiment but were repeated for each experiment in this study (n = 28 sessions, 12 mice). b Left: Example traces from the visual response mapping block of the experiment (prior to the behavioral task). Vertical lines indicate stimulus onsets with color indicating orientation (dashed lines for orientations over 135 degrees). Right: Example traces from the photostimulation response mapping block. Vertical lines indicate clusters of cells stimulated as a group. Cells are sorted by photostimulation cluster (in this experiment clusters were determined by orientation preference). c Example co-tuned stimulation ensemble. In this experiment 28 neurons were selected based on their responsivity to visual and optogenetic stimuli in b. Left: average responses to the drifting gratings of various orientations. Single lines represent individual neurons, thick black line indicates ensemble average. This ensemble shares a preference for 90 and 270 degree stimuli. Black triangle indicates the orientation of visual stimulus chosen for the remainder of this session. Middle: The ensemble response to photostimulation. Right: The spatial configuration of the neurons selected for stimulation. d Pixel-wise stimulus-triggered average (STA) showing the response of the FOV to the stimulation pattern from c. Red circles indicate target neurons on that imaging plane. Fade circles show all targets collapsed across planes. Scale bar represents 100 μm. e Boxplots showing the number and co-tuning of the photostimulated neurons across all experiments. Box shows the interquartile range (IQR), the plus sign shows the mean, solid line the median, and the whiskers denote 1.5 times the IQR (n = 28 sessions, 12 mice). f Photostimulation of co-tuned ensembles was paired with visual stimuli. Sessions are split into two states as in Fig. 1, here renamed to a ‘less engaged’ and a ‘more engaged’ state. Black lines indicate performance on visual-only trials. Red lines indicate performance on visual+photostimulation trials. Inset: Width of fitted psychometric curve. Error bars and shading show mean ± SEM across sessions, n = 28 sessions, 12 mice. Statistical test was two-sided Wilcoxon sign rank test, ** denotes P < 0.01. g The effect of photostimulation manifests as an increase in the width of fitted psychometric curves (n = 28 sessions, 12 mice). There was no change to the threshold of the psychometric functions. Error bars show mean ± SEM across sessions. Statistical tests were two-sided Wilcoxon sign rank, ** denotes P < 0.01, * denotes P < 0.05. h Photostimulation has a consistent effect on the detectability of visual stimuli in the ‘more engaged’ state and not in the ‘less engaged’ state. Photostimulation enhances detection of low (2%) contrast stimuli and suppressed the detection of higher (10%) contrast stimuli. Significance across each full curve indicates results of a one-way ANOVA within state. Significance across the two curves indicates the results of a repeated measures ANOVA. Significance above individual curve points indicates results of two-sided Wilcoxon signed-rank tests with Bonferroni (number of contrasts) correction. Error bars show mean ± SEM across sessions, n = 28 sessions, 12 mice. We use * to denote a P-value < 0.05, ** for P < 0.01 and *** for P < 0.001.
Fig. 3
Fig. 3. Targeted photostimulation elicits a suppressive network response that scales with the strength of coincident sensory stimuli and the functional identity of neurons.
a Example STA traces to visual only trials across contrasts in one experiment. Neurons are sorted by their average response across all contrasts. Black line indicates visual stimulus presentation. b The neural responses across the whole population in the more engaged state are significantly larger than in the less engaged state (n = 28 sessions, 12 mice). The ratio of hits and misses within each contrast have been matched across states. The line and shading represents the mean ± SEM. Individual points across the two curves were tested with two-sided Wilcoxon sign rank test with multiple comparison (Bonferroni) correction for number of contrasts. The average pooled responses were compared with a two-sided Wilcoxon sign rank test. *** denotes P < 0.001 and ** P < 0.01. c Top: example experimental volume. ROIs are colored by the change in activity caused by photostimulation during spontaneous gray screen periods. Vertical red lines indicate the directly stimulated cells. Bottom: example types of responses seen when the visual stimulus is paired with photostimulation. d Target cell responses. Left: responses to visual only trials across contrasts. Middle: responses to paired visual and photostimulation. Right: the change in activity caused by photostimulation. Target cells are strongly activated by photostimulation. The level of activation is significantly higher in the engaged state. The ratio of hits and misses within each contrast have been matched across states. The line and shading represents the mean ± SEM (n = 28 sessions, 12 mice). Comparisons were made with a two-sided Wilcoxon sign rank test. *** denotes P < 0.001. e Background cell responses. Left: The responses of all background neurons to visual only trials. Middle: The response of background neurons to paired visual and photo-stimulation. Right: The change in activity of background cells caused by photostimulation. The background cells are suppressed on average, across all contrasts. No difference is seen in the level of suppression between behavioral states. The line and shading represents the mean ± SEM (n = 28 sessions, 12 mice). Comparisons were made with a two-sided Wilcoxon sign rank test. ** denotes P < 0.01. f Top: the 2D spatial profile of photostimulation influence. All neurons are aligned relative to their nearest target spot (at 0,0), collapsed across z-planes. Spatially binned (5 ×5 µm), and Gaussian filtered (SD = 10 µm) for display only. A central hotspot of activity corresponds to directly targeted neurons. Surrounding the targeted neurons the predominant effect of photostimulation is suppression of neighboring cells (n = 28 sessions, 12 mice). Bottom: the 1D spatial profile of photostimulation influence. No difference is seen between the two states. The line and shading represents the mean ± SEM (n = 28 sessions, 12 mice). g Presenting the average network responses across all sessions on two axes; visual stimulus contrast and similarity to the target cells (quantified as the Pearson’s correlation of a given cell’s contrast response curve to that of the average target neuron). The top row corresponds to the directly targeted neurons. Left: responses to visual stimuli of increasing contrast alone. Note cells positively correlated with the target cells respond positively to increasing contrast. Middle: The responses to paired visual and photo-stimulation. Right: The difference reveals the change in activity caused by photostimulation. Note that cells similar to the target cells are more strongly suppressed at higher contrasts (n = 28 sessions, 12 mice). h The change in activity of background cells. Background neurons most similar to the target neurons show the strongest levels of suppression mediated by the photostimulation (green line). The level of suppression recruited increases as the visual contrast increases. (2-way ANOVA grouped by state and contrast. Effect of contrast F(4) = 11.9, P < 0.001. Effect of similarity F(19) = 2.9, P < 0.001. Interaction of contrast and similarity F(76) = 2.5, P < 0.001, n = 28 sessions, 12 mice). Lines show the mean and shading shows the SEM. i The relationship between the slope of suppression recruited by increasing visual contrasts, versus the functional similarity to the photostimulated neurons. Neurons within a similarity group are pooled across experiments and the slope of suppression versus contrast is computed. Error bars indicate the standard error of the fit, obtained by resampling animals/sessions with replacement. Neurons most similar to the target neurons are increasingly suppressed as contrast increases, which corresponds to a negative slope. Filled individual points indicate individually significant fits with Bonferroni multiple comparison correction. The line of best fit indicates the relationship across functional similarity groups of all the background cells, shading represents the CI of the fit. The directly stimulated neurons are shown at the far right and are excluded from the fit (n = 28 sessions, 12 mice).
Fig. 4
Fig. 4. The coupling between behavioral response and network response to photostimulation depends on the functional similarity of neurons, and is gated by brain state.
a Relating the photostimulation induced change in behavior to the photostimulation induced change in network activity within subpopulations of functionally defined neurons. An example schematic showing how the neural-behavioral coupling is computed. Left: example behavioral and neural data from an example session (only the intermediate contrasts (2, 5, 10%) are considered for the coupling analysis). Top right: All data across sessions belonging to one functional similarity group are used to compute the linear correlation coefficient between the change in behavior and the change in neural activity, termed the neural-behavioral coupling. Bottom right: We collect neural-behavioral coupling measurements for all functional similarity groups of neurons. b The neural-behavioral coupling as a function of functional similarity (with respect to the target neurons). A relationship between the change in activity and the change in behavior is only seen in the more engaged state. We observe a monotonic relationship across functional similarity groups whereby the neurons most functionally similar to the stimulated targets show the tightest coupling with behavior. Separate data points at the far right are the directly targeted cells and not included in the fit. The error bars around individual datapoints are standard error (SE), the error bars around the fitted lines are SE, both are computed by resampling with replacement. Significance indicates the percentile of the shuffled distributed the real slopes lie in where *** refers to a P value < 0.001. n = 28 sessions, 12 mice.

References

    1. McCormick DA, Nestvogel DB, He BJ. Neuromodulation of brain state and behavior. Annu Rev. Neurosci. 2020;43:391–415. doi: 10.1146/annurev-neuro-100219-105424. - DOI - PubMed
    1. Raymond JE. Attentional modulation of visual motion perception. Trends Cogn. Sci. 2000;4:42–50. doi: 10.1016/S1364-6613(99)01437-0. - DOI - PubMed
    1. Harris KD, Thiele A. Cortical state and attention. Nat. Rev. Neurosci. 2011;12:509–523. doi: 10.1038/nrn3084. - DOI - PMC - PubMed
    1. McGinley MJ, et al. Waking state: rapid variations modulate neural and behavioral responses. Neuron. 2015;87:1143–1161. doi: 10.1016/j.neuron.2015.09.012. - DOI - PMC - PubMed
    1. Treue S. Neural correlates of attention in primate visual cortex. Trends Neurosci. 2001;24:295–300. doi: 10.1016/S0166-2236(00)01814-2. - DOI - PubMed