

Species delimitation, discovery and conservation in a tiger beetle species complex despite discordant genetic data
- PMID: 38503840
- PMCID: PMC10951344
- DOI: 10.1038/s41598-024-56875-9
Species delimitation, discovery and conservation in a tiger beetle species complex despite discordant genetic data
Abstract
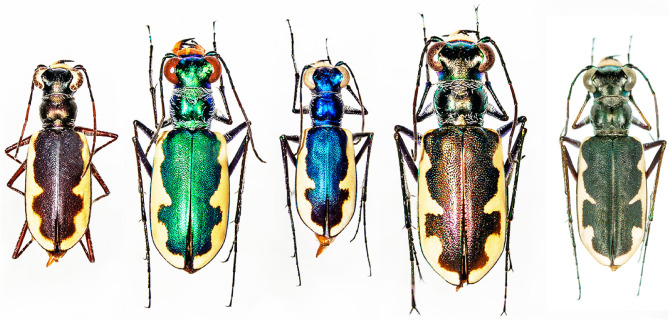
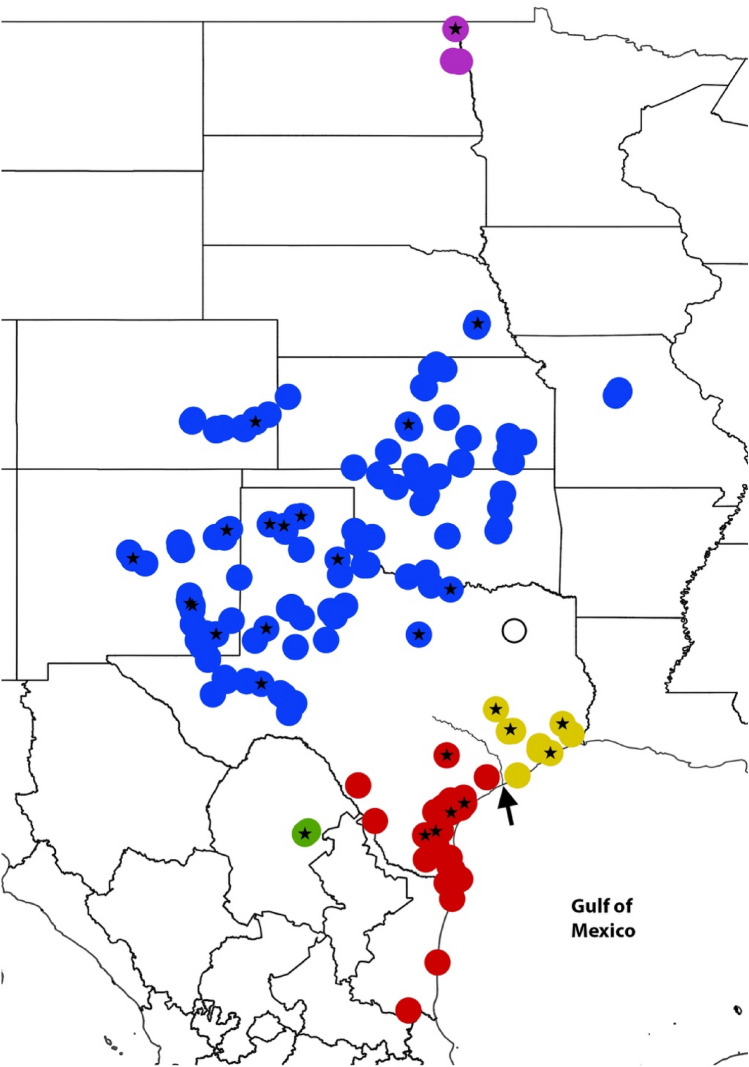
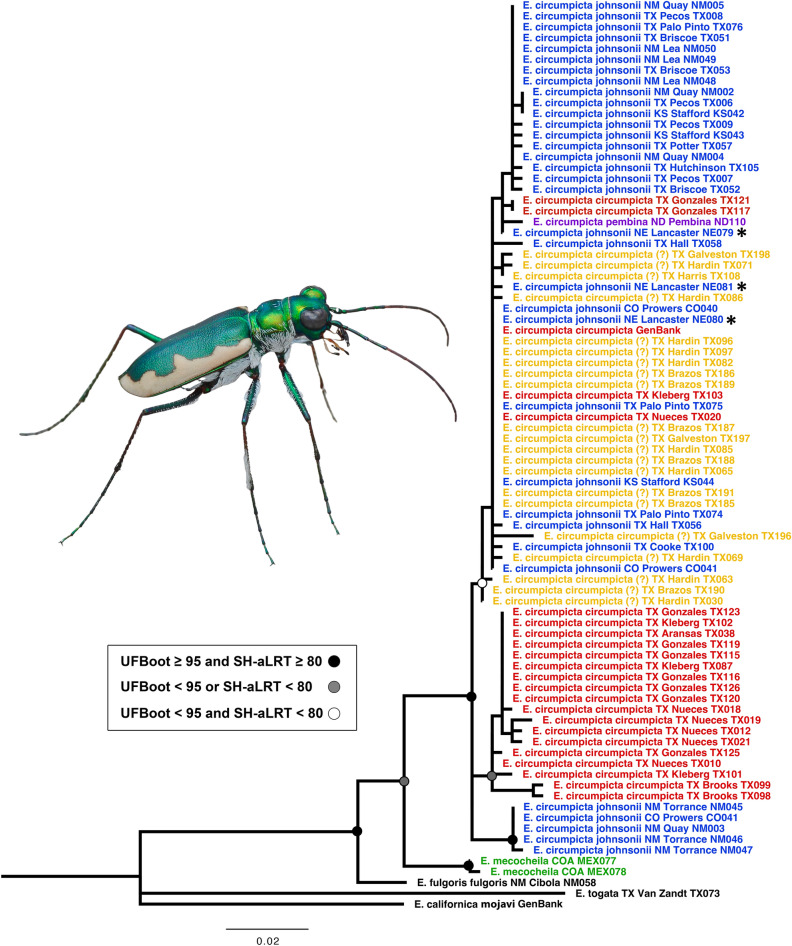
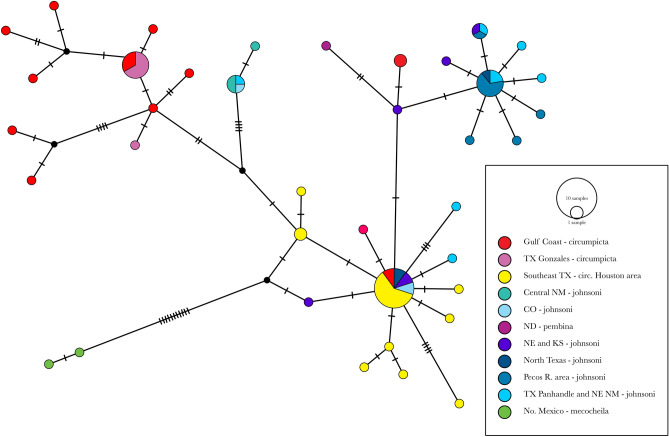
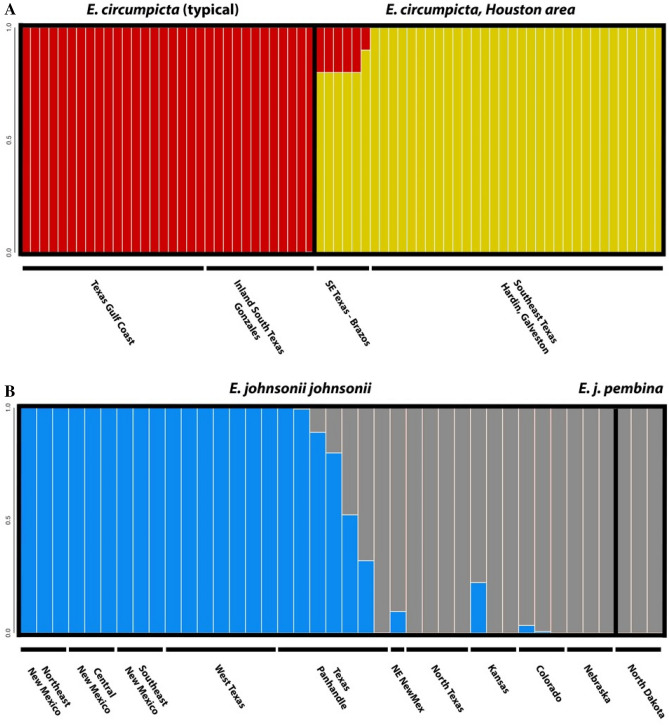
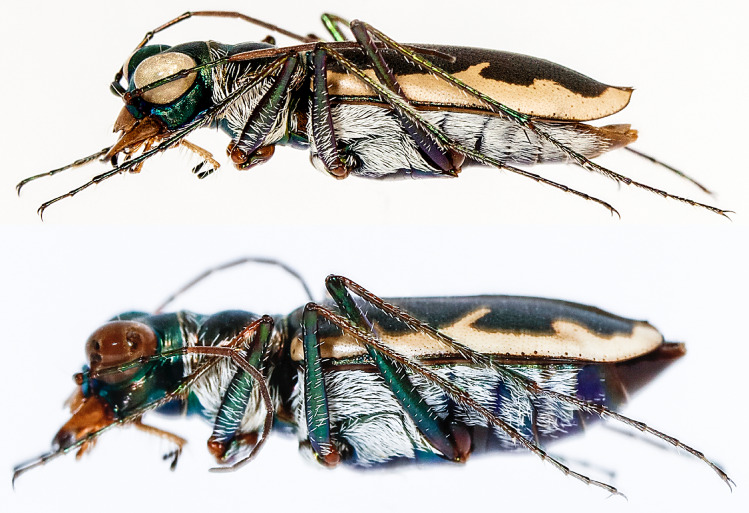
In an age of species declines, delineating and discovering biodiversity is critical for both taxonomic accuracy and conservation. In recent years, there has been a movement away from using exclusively morphological characters to delineate and describe taxa and an increase in the use of molecular markers to describe diversity or through integrative taxonomy, which employs traditional morphological characters, as well as genetic or other data. Tiger beetles are charismatic, of conservation concern, and much work has been done on the morphological delineation of species and subspecies, but few of these taxa have been tested with genetic analyses. In this study, we tested morphologically based taxonomic hypotheses of polymorphic tiger beetles in the Eunota circumpicta (LaFerté-Sénectère, 1841) species complex using multilocus genomic and mtDNA analyses. We find multiple cryptic species within the previous taxonomic concept of Eunota circumpicta, some of which were historically recognized as subspecies. We found that the mtDNA and genomic datasets did not identify the same taxonomic units and that the mtDNA was most at odds with all other genetic and morphological patterns. Overall, we describe new cryptic diversity, which raises important conservation concerns, and provide a working example for testing species and subspecies validity despite discordant data.
© 2024. The Author(s).
Conflict of interest statement
The authors declare no competing interests.
Figures


Similar articles
-
A genomic test of subspecies in the Eunota togata species group (Coleoptera: Cicindelidae): Morphology masks evolutionary relationships and taxonomy.Mol Phylogenet Evol. 2023 Dec;189:107937. doi: 10.1016/j.ympev.2023.107937. Epub 2023 Oct 4. Mol Phylogenet Evol. 2023. PMID: 37797795
-
Description of a new halophilic tiger beetle in the genus Eunota (Coleoptera, Cicindelidae, Cicindelini) identified using morphology, phylogenetics and biogeography.PLoS One. 2021 Oct 13;16(10):e0257108. doi: 10.1371/journal.pone.0257108. eCollection 2021. PLoS One. 2021. PMID: 34644294 Free PMC article.
-
Morphological and molecular variation in tiger beetles of the Cicindela hybrida complex: is an 'integrative taxonomy' possible?Mol Ecol. 2009 Feb;18(4):648-64. doi: 10.1111/j.1365-294X.2008.04048.x. Epub 2009 Jan 16. Mol Ecol. 2009. PMID: 19175505
-
Charles Darwin, beetles and phylogenetics.Naturwissenschaften. 2009 Nov;96(11):1293-312. doi: 10.1007/s00114-009-0601-2. Epub 2009 Sep 17. Naturwissenschaften. 2009. PMID: 19760277 Review.
-
Cryptic species as a window into the paradigm shift of the species concept.Mol Ecol. 2018 Feb;27(3):613-635. doi: 10.1111/mec.14486. Epub 2018 Feb 16. Mol Ecol. 2018. PMID: 29334414 Review.
Cited by
-
Appearance may be deceiving: Mexican sand flies (Diptera: Psychodidae: Phlebotominae) embrace a high diversity of cryptic species.J Insect Sci. 2025 Jul 15;25(4):4. doi: 10.1093/jisesa/ieaf070. J Insect Sci. 2025. PMID: 40708374 Free PMC article.
-
Phylogenomics Reveals Deep Divergences and Cryptic Species Within a Rare Sand-Dwelling Milkweed, Asclepias tomentosa Elliott.Ecol Evol. 2025 Aug 8;15(8):e71942. doi: 10.1002/ece3.71942. eCollection 2025 Aug. Ecol Evol. 2025. PMID: 40785997 Free PMC article.
References
-
- Millennium Ecosystem Assessment . Ecosystems and Human Well-Being: Synthesis. Island Press; 2005.
-
- McCord EL. The Value of Species. Yale University Press; 2012.
MeSH terms
Substances
LinkOut - more resources
Full Text Sources
