. 2024 May;5(5):760-773.
doi: 10.1038/s43018-024-00744-x. Epub 2024 Mar 19.

Synthetic dual co-stimulation increases the potency of HIT and TCR-targeted cell therapies

Affiliations

Synthetic dual co-stimulation increases the potency of HIT and TCR-targeted cell therapies

Anton Dobrin et al. Nat Cancer. 2024 May.

Abstract

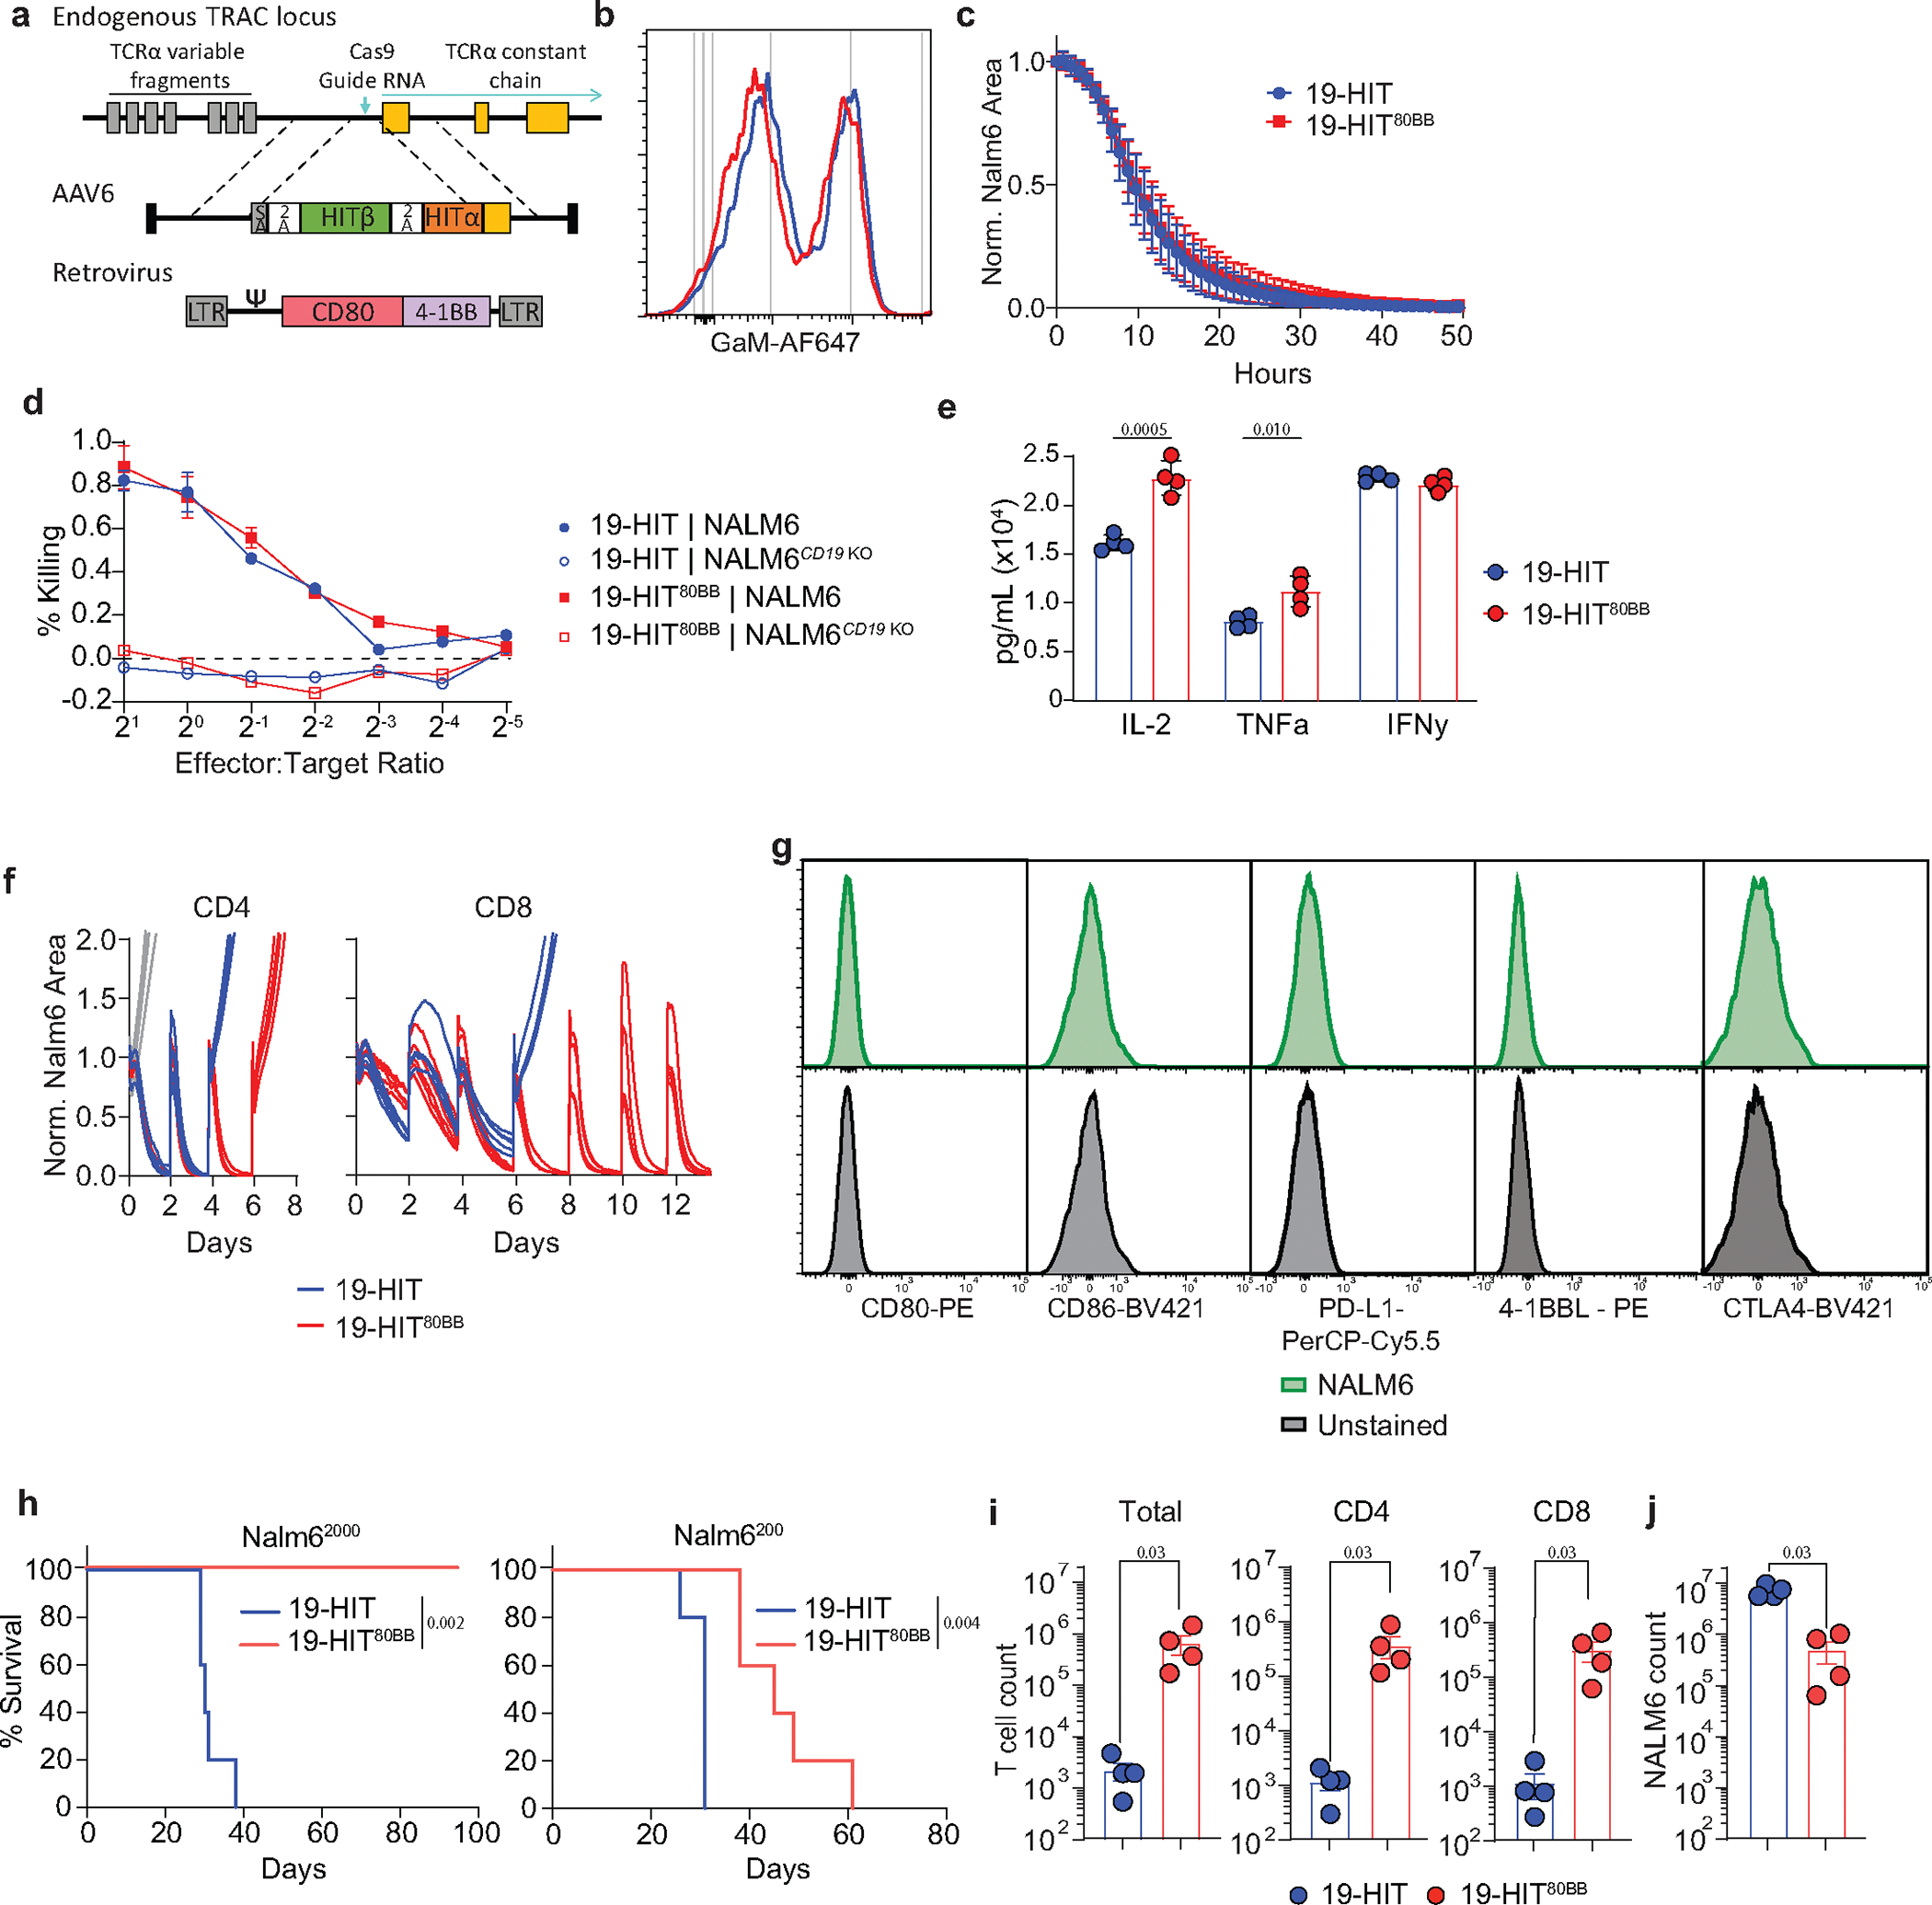
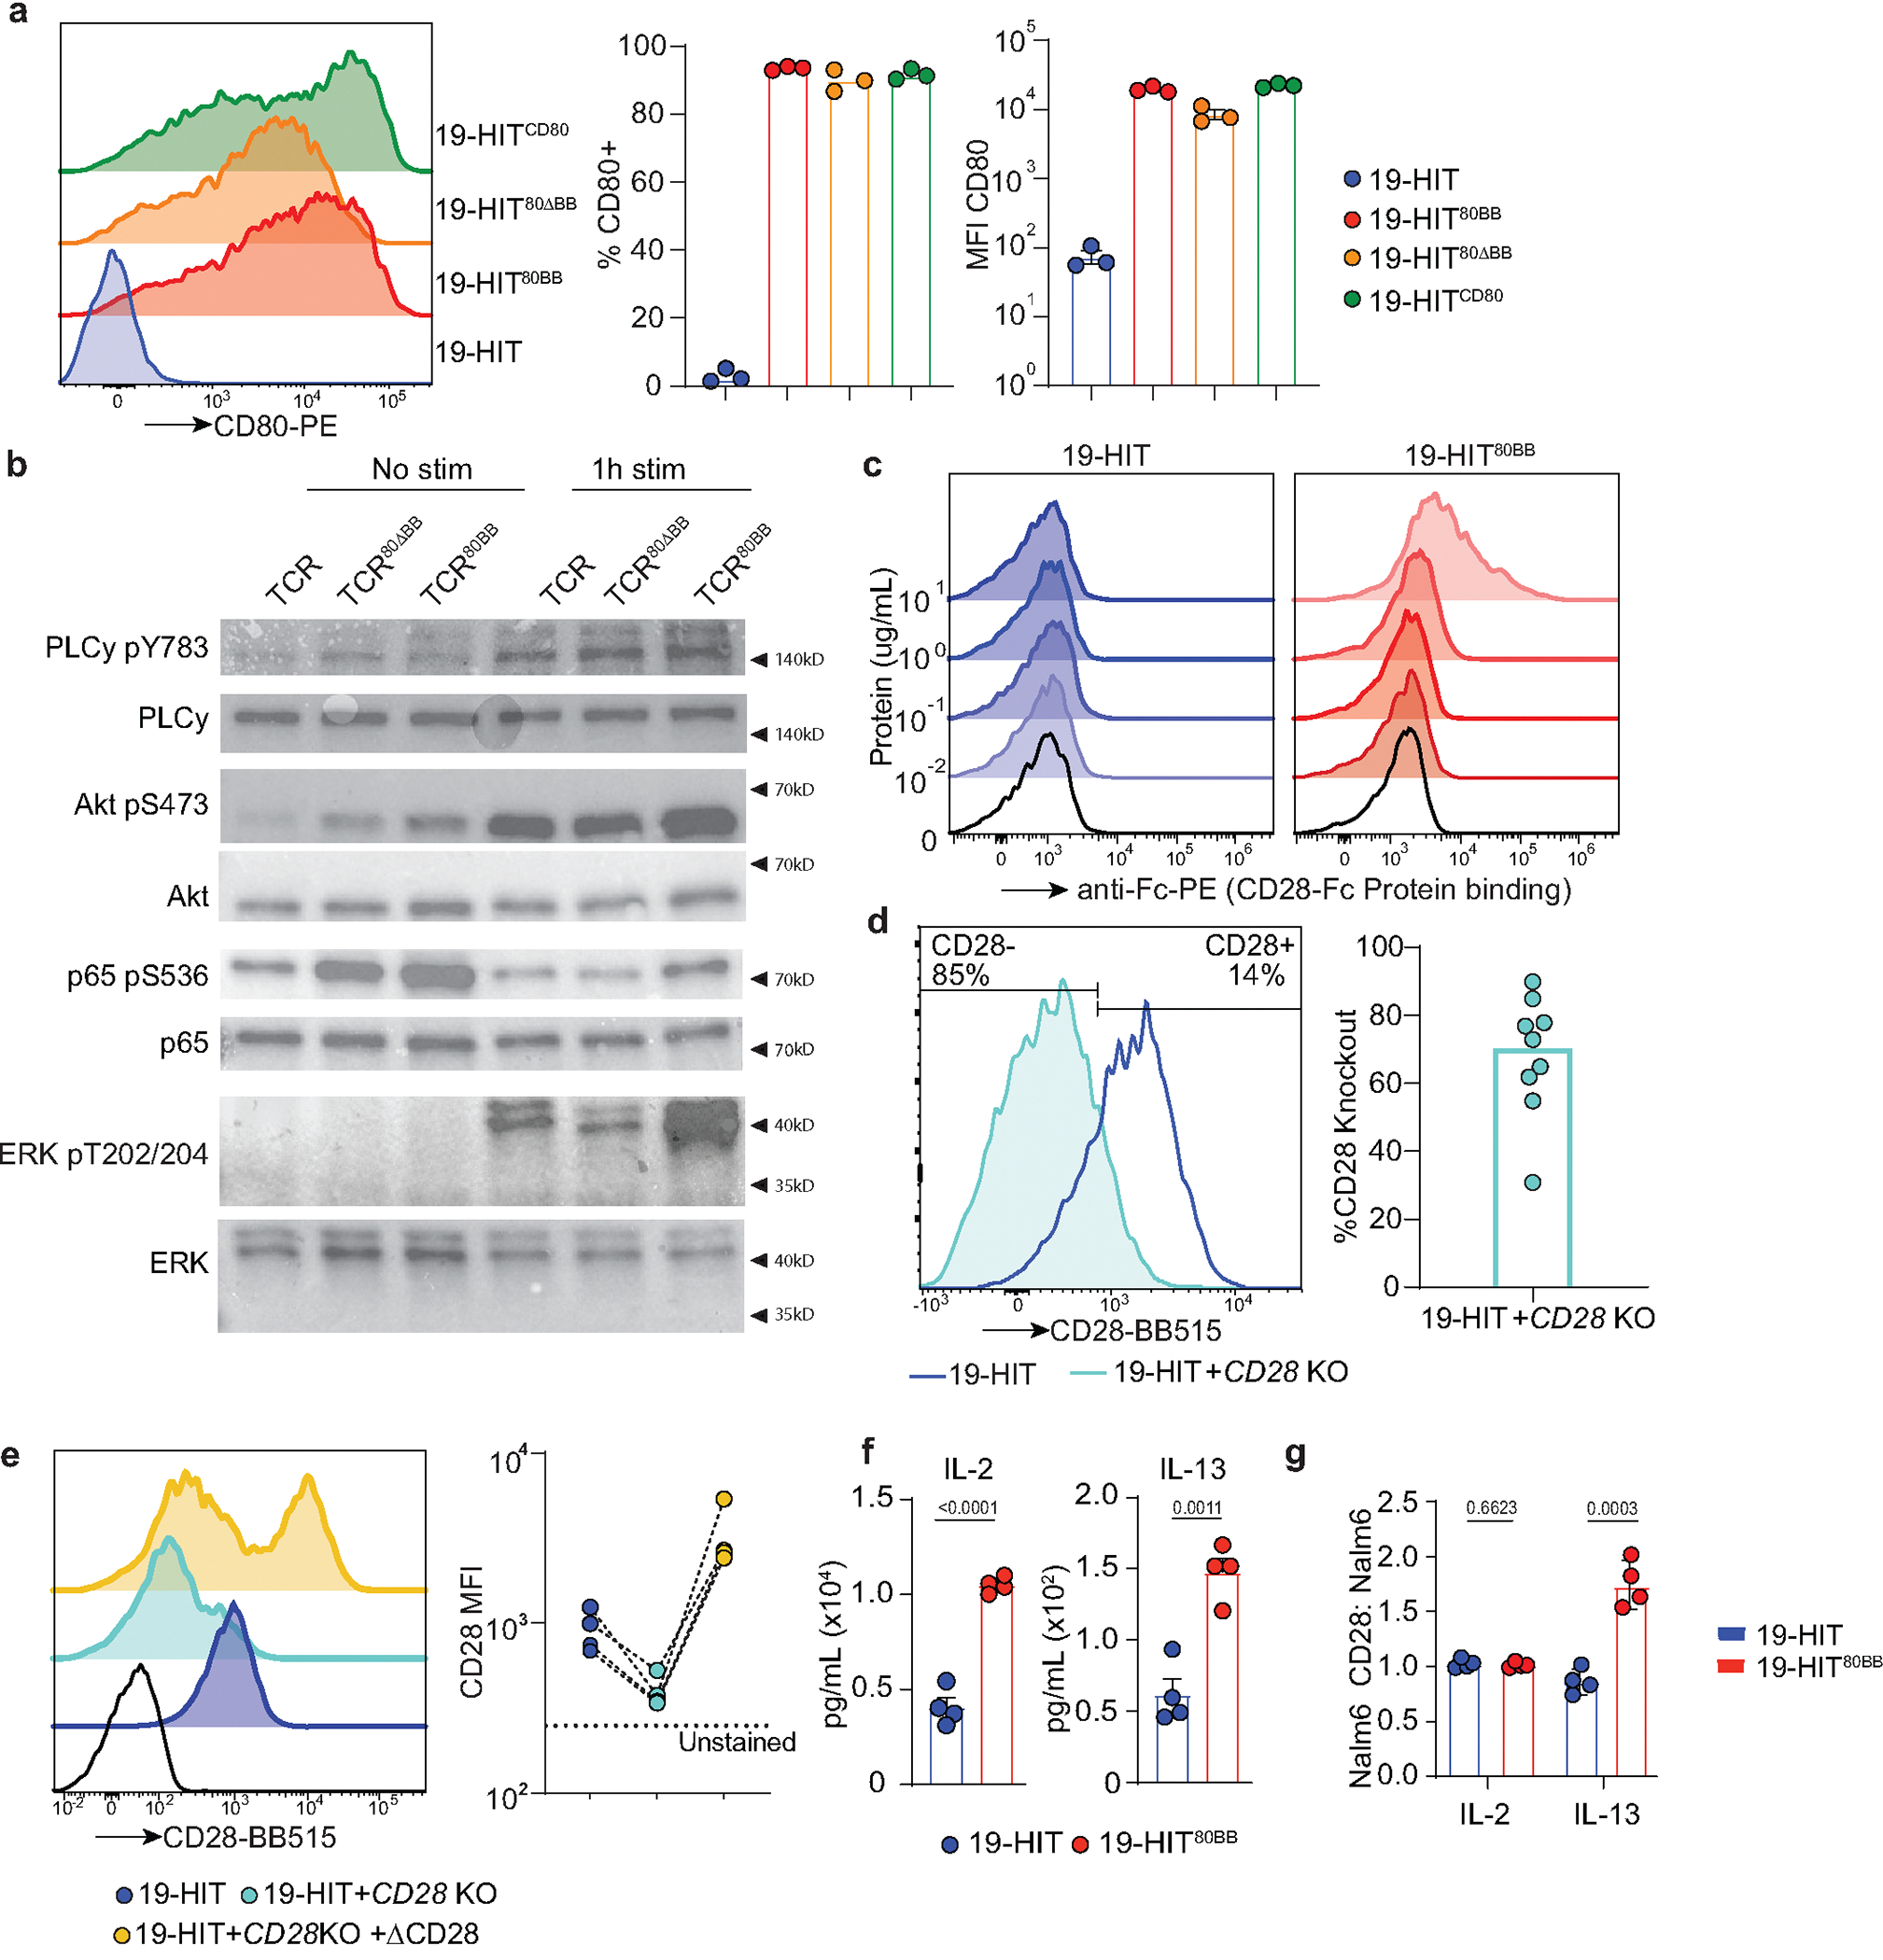
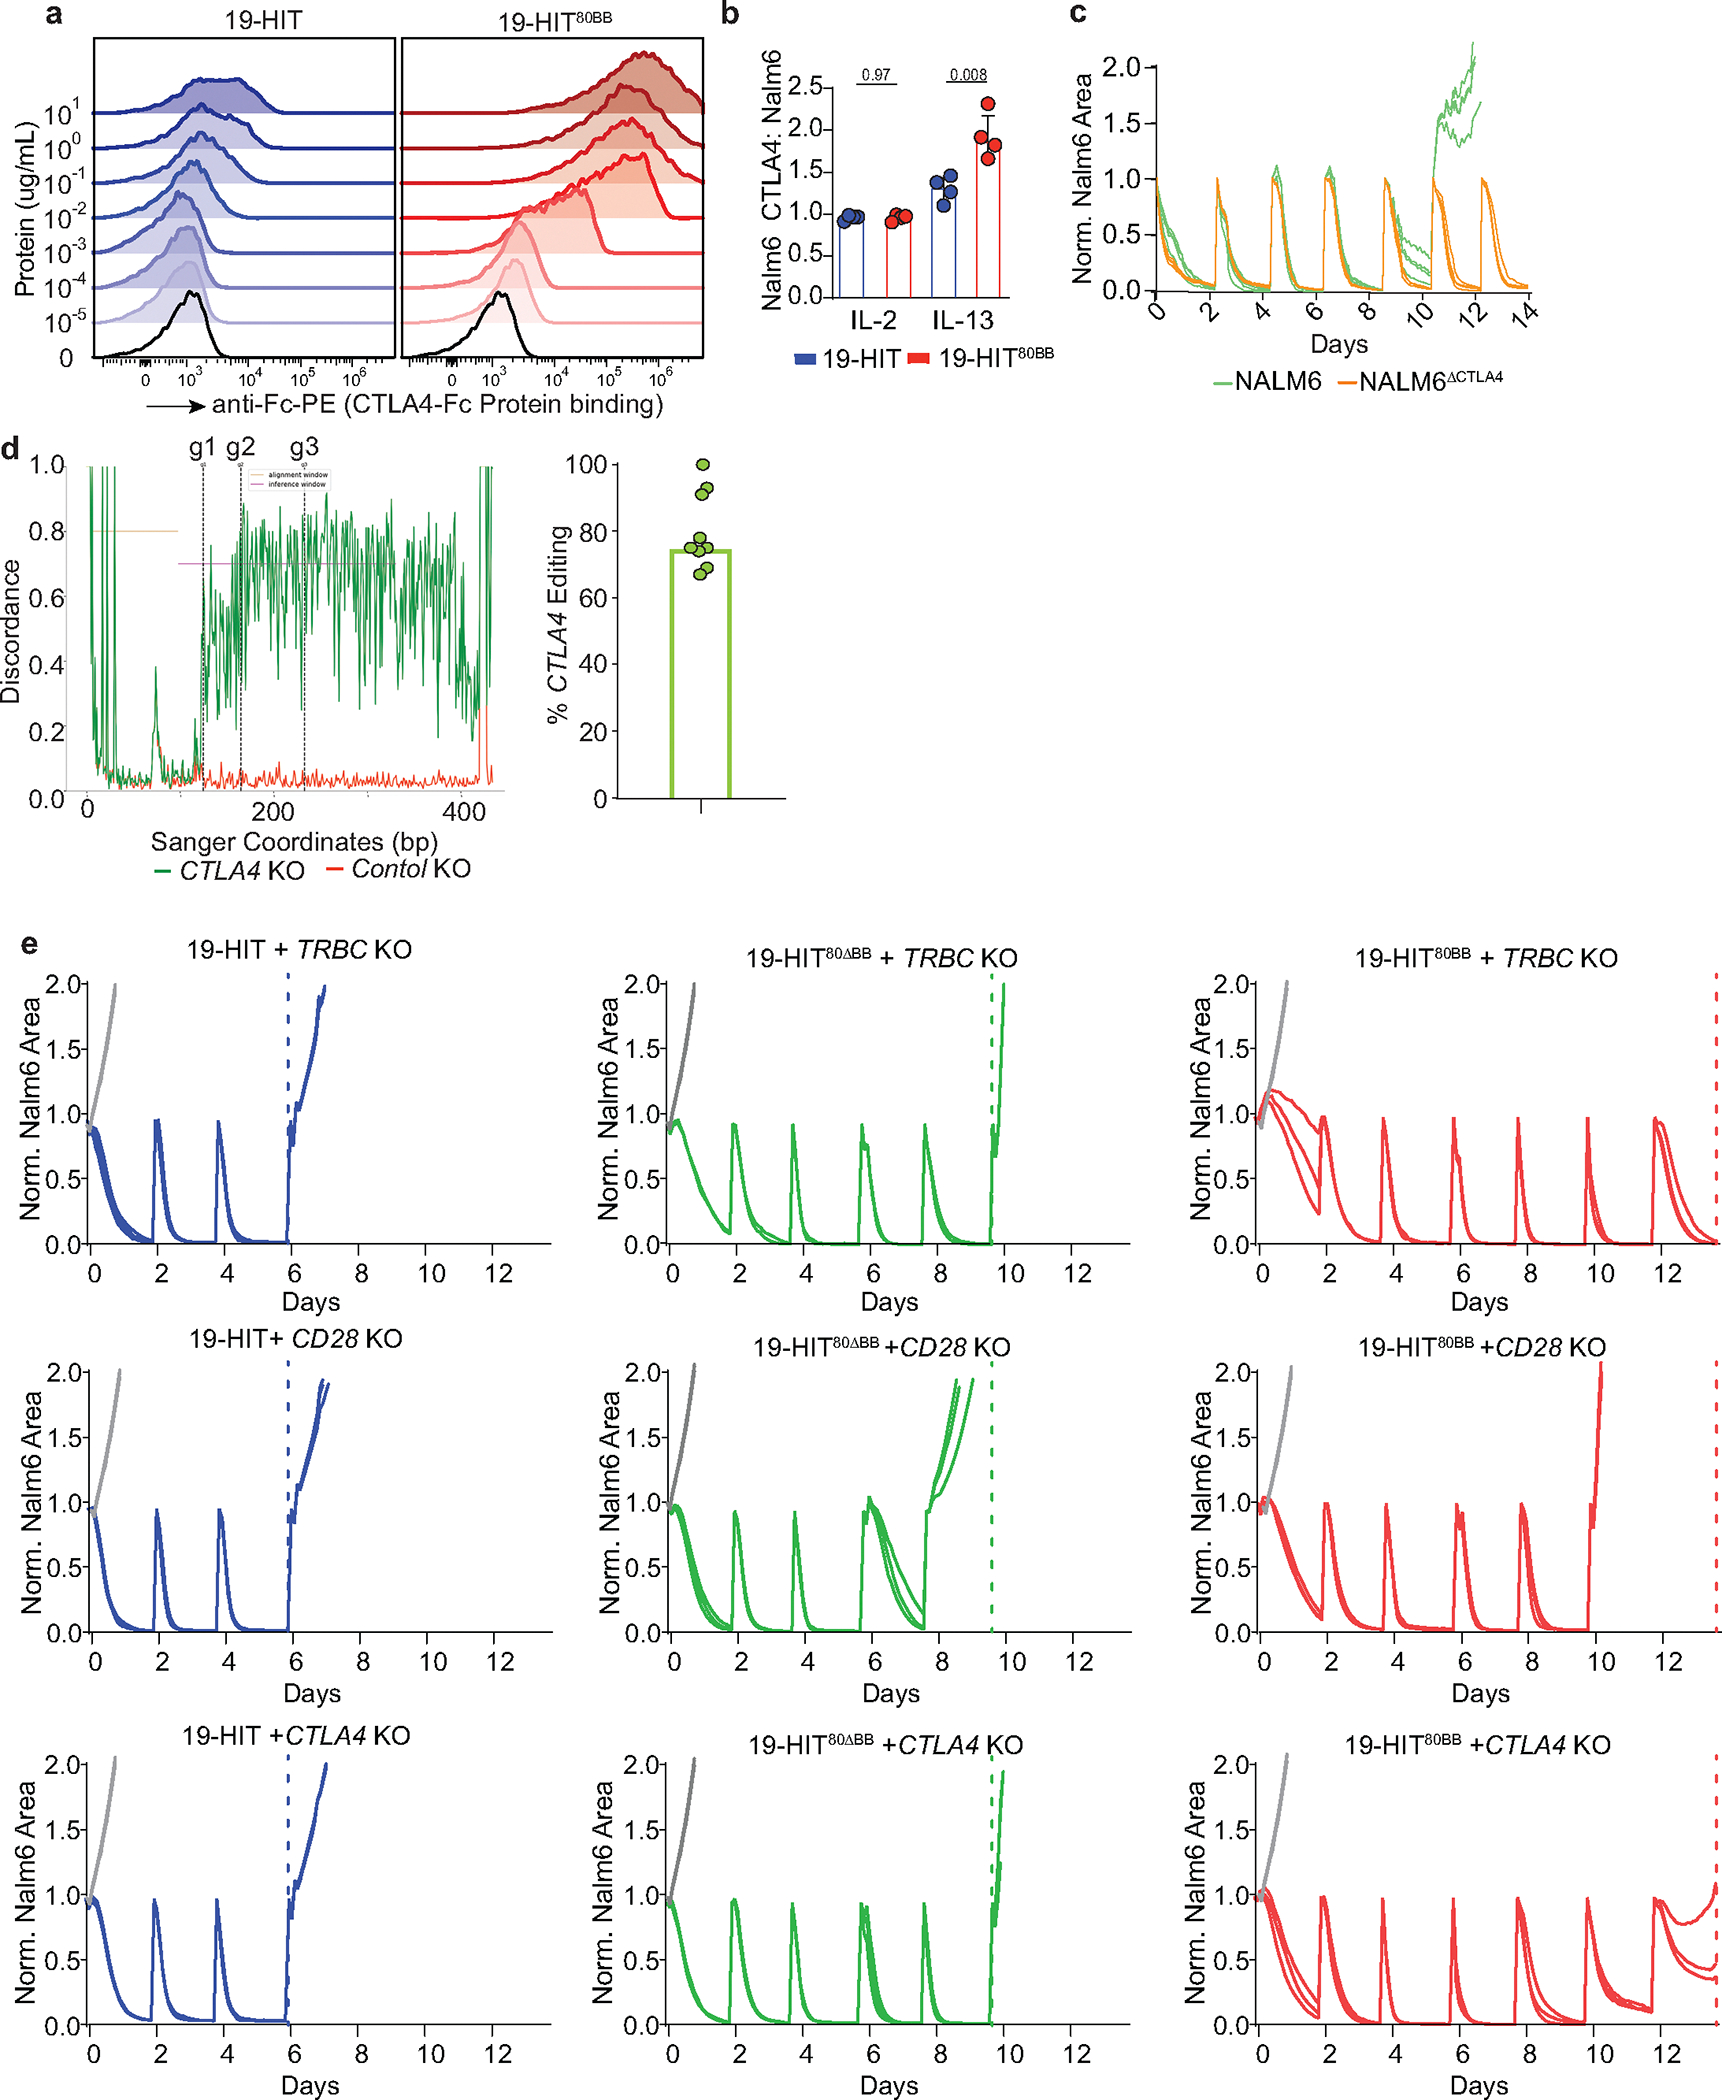
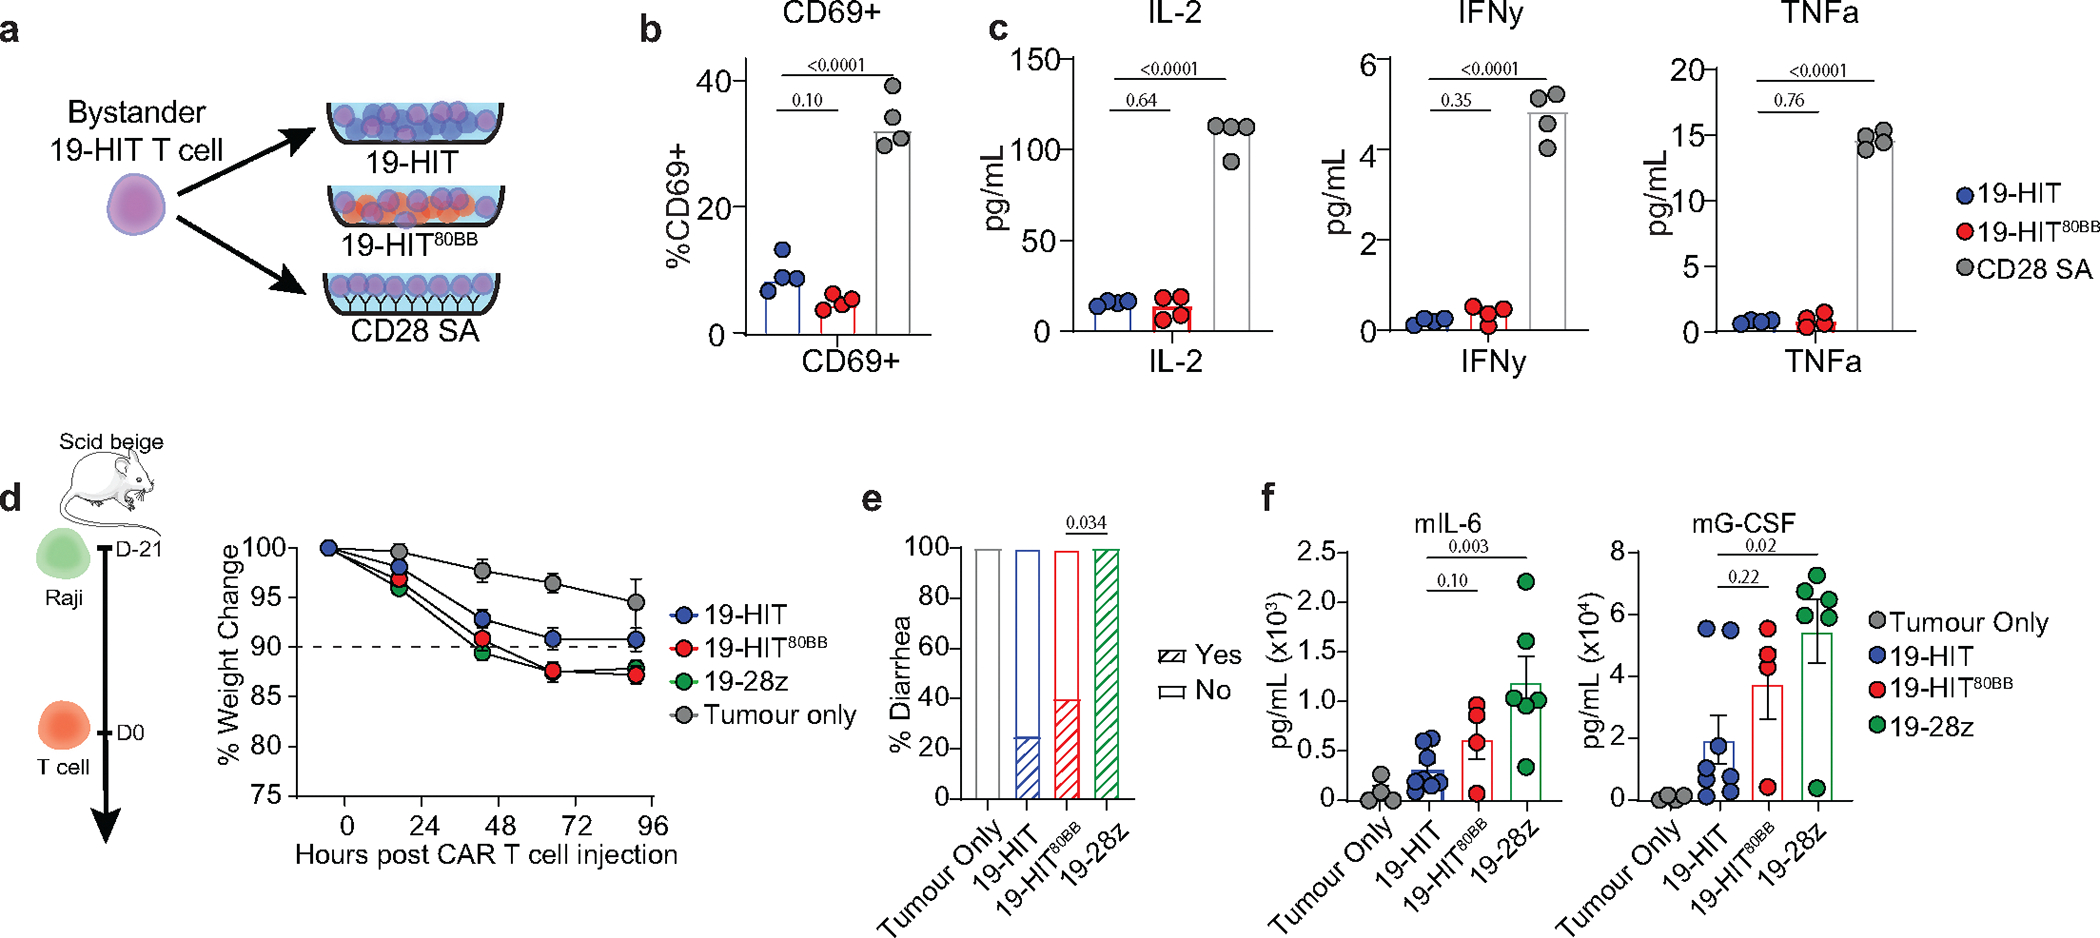
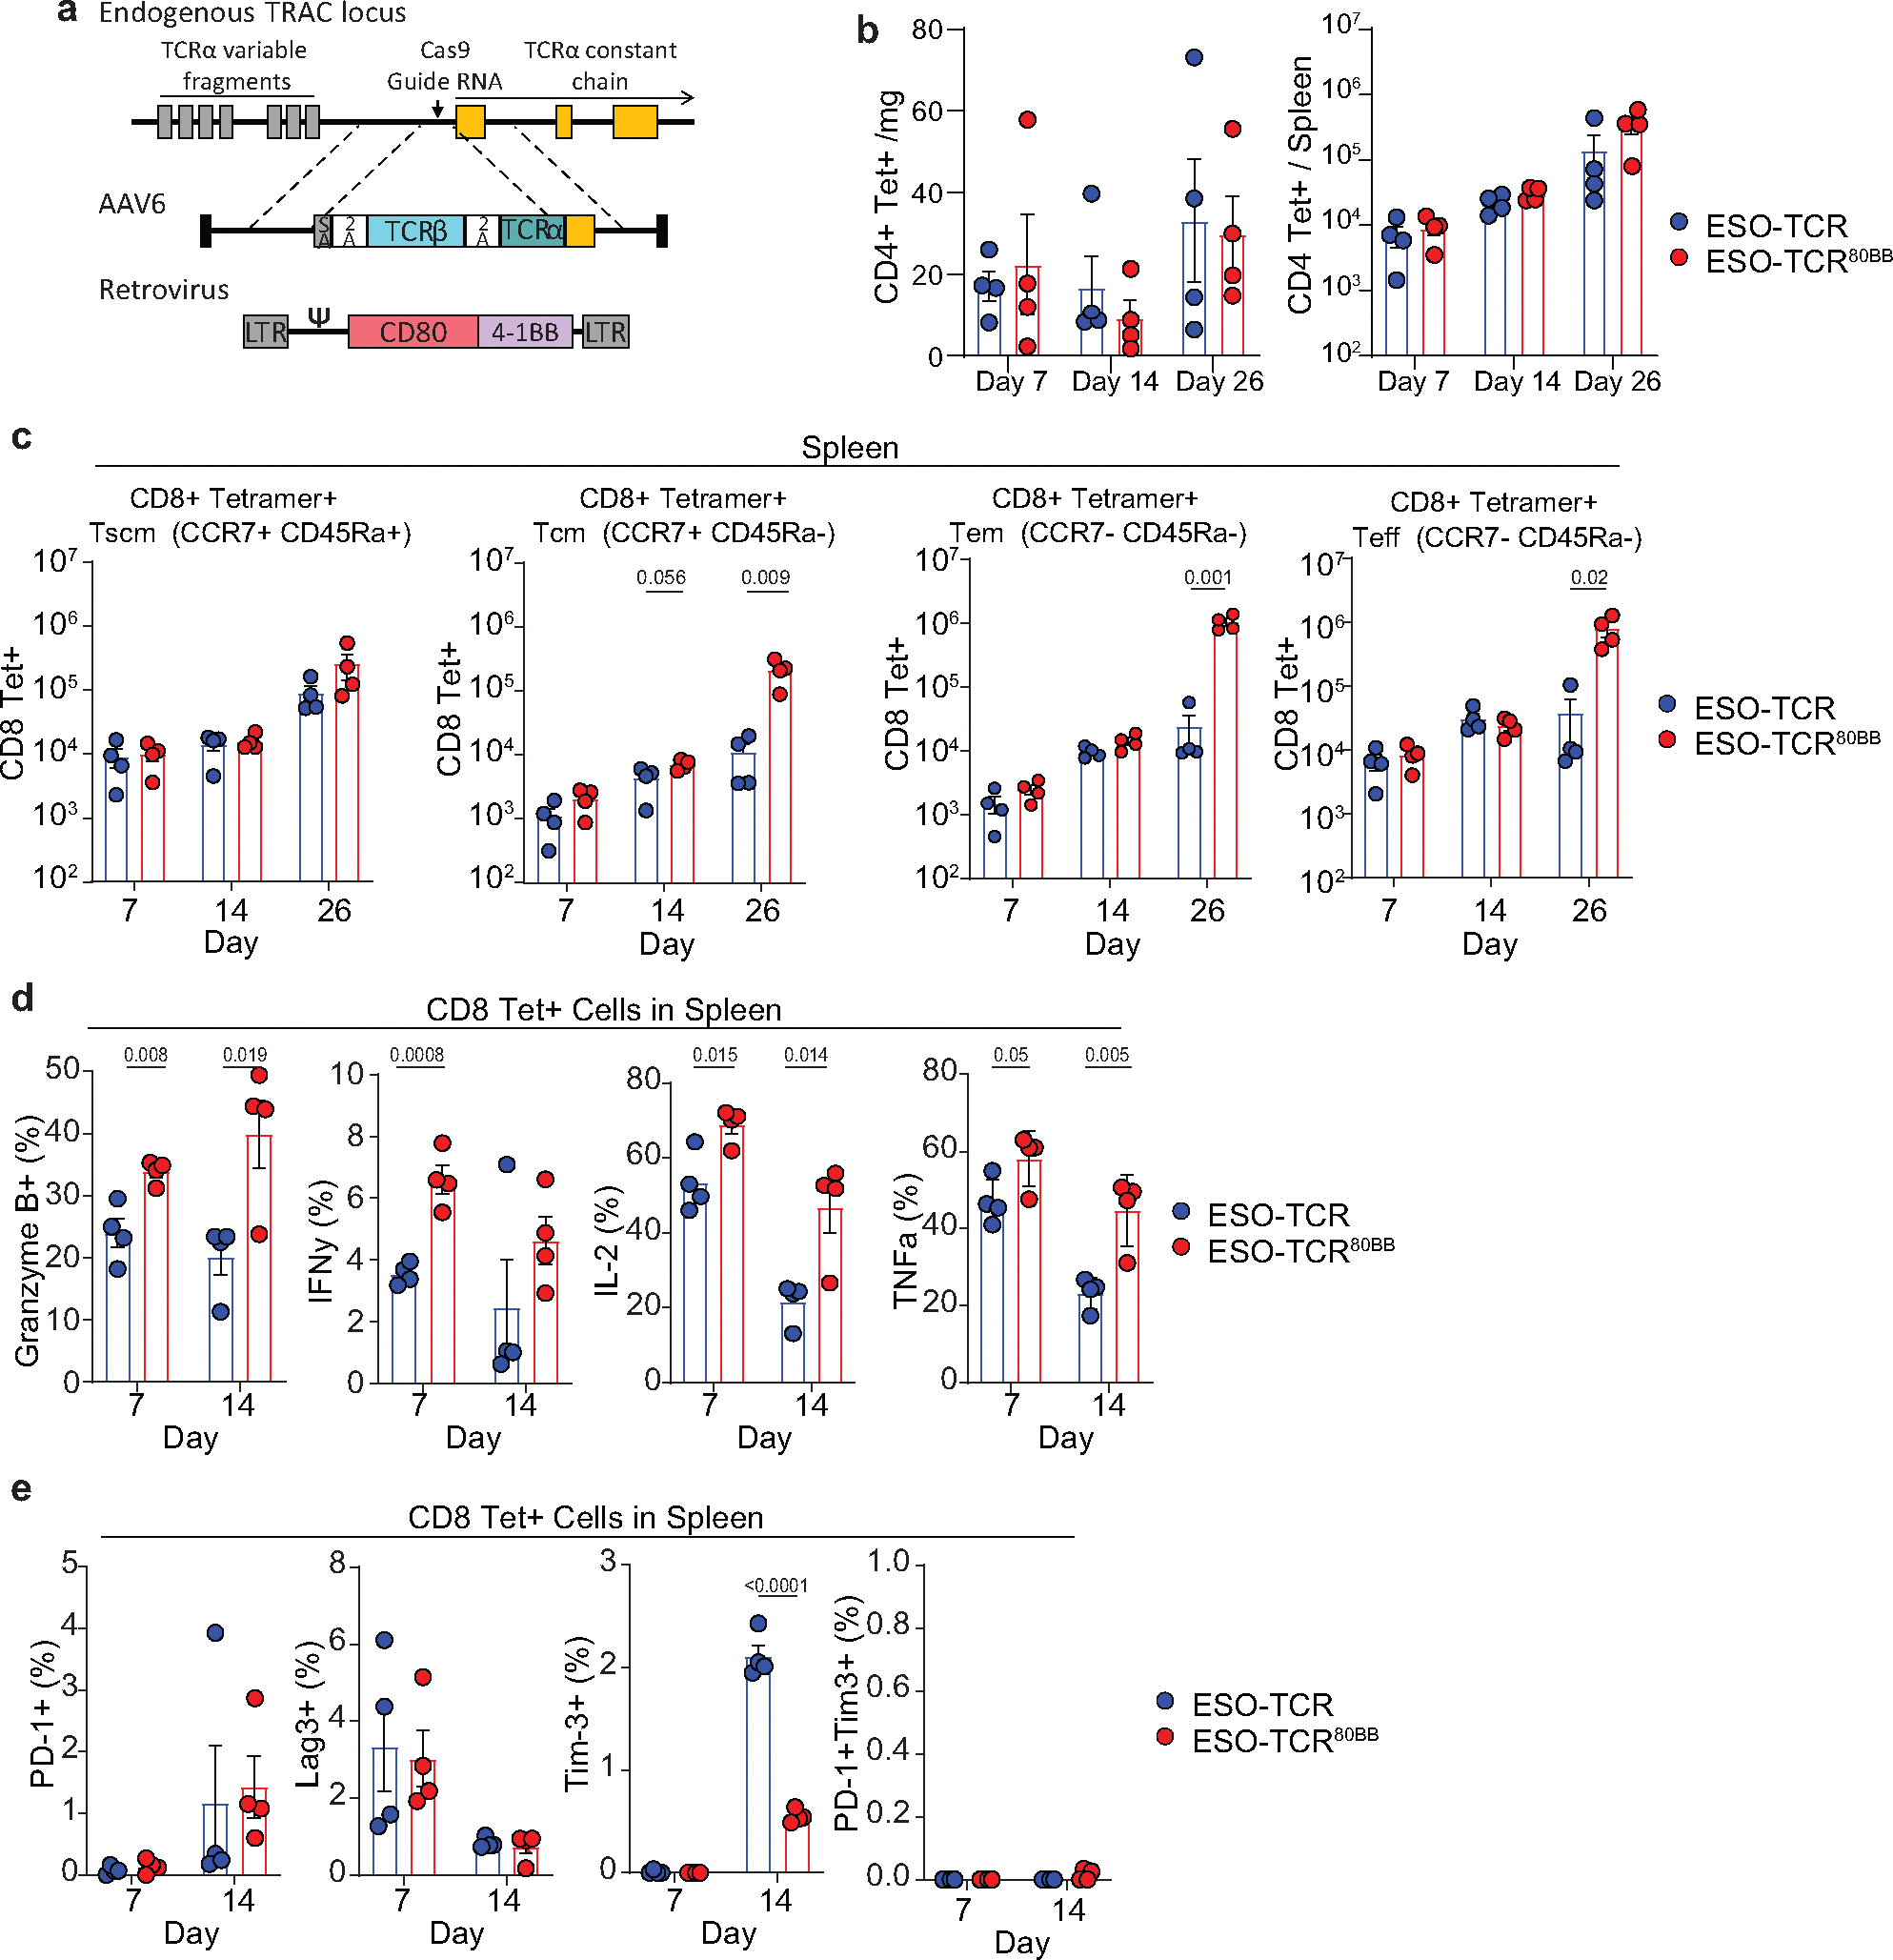
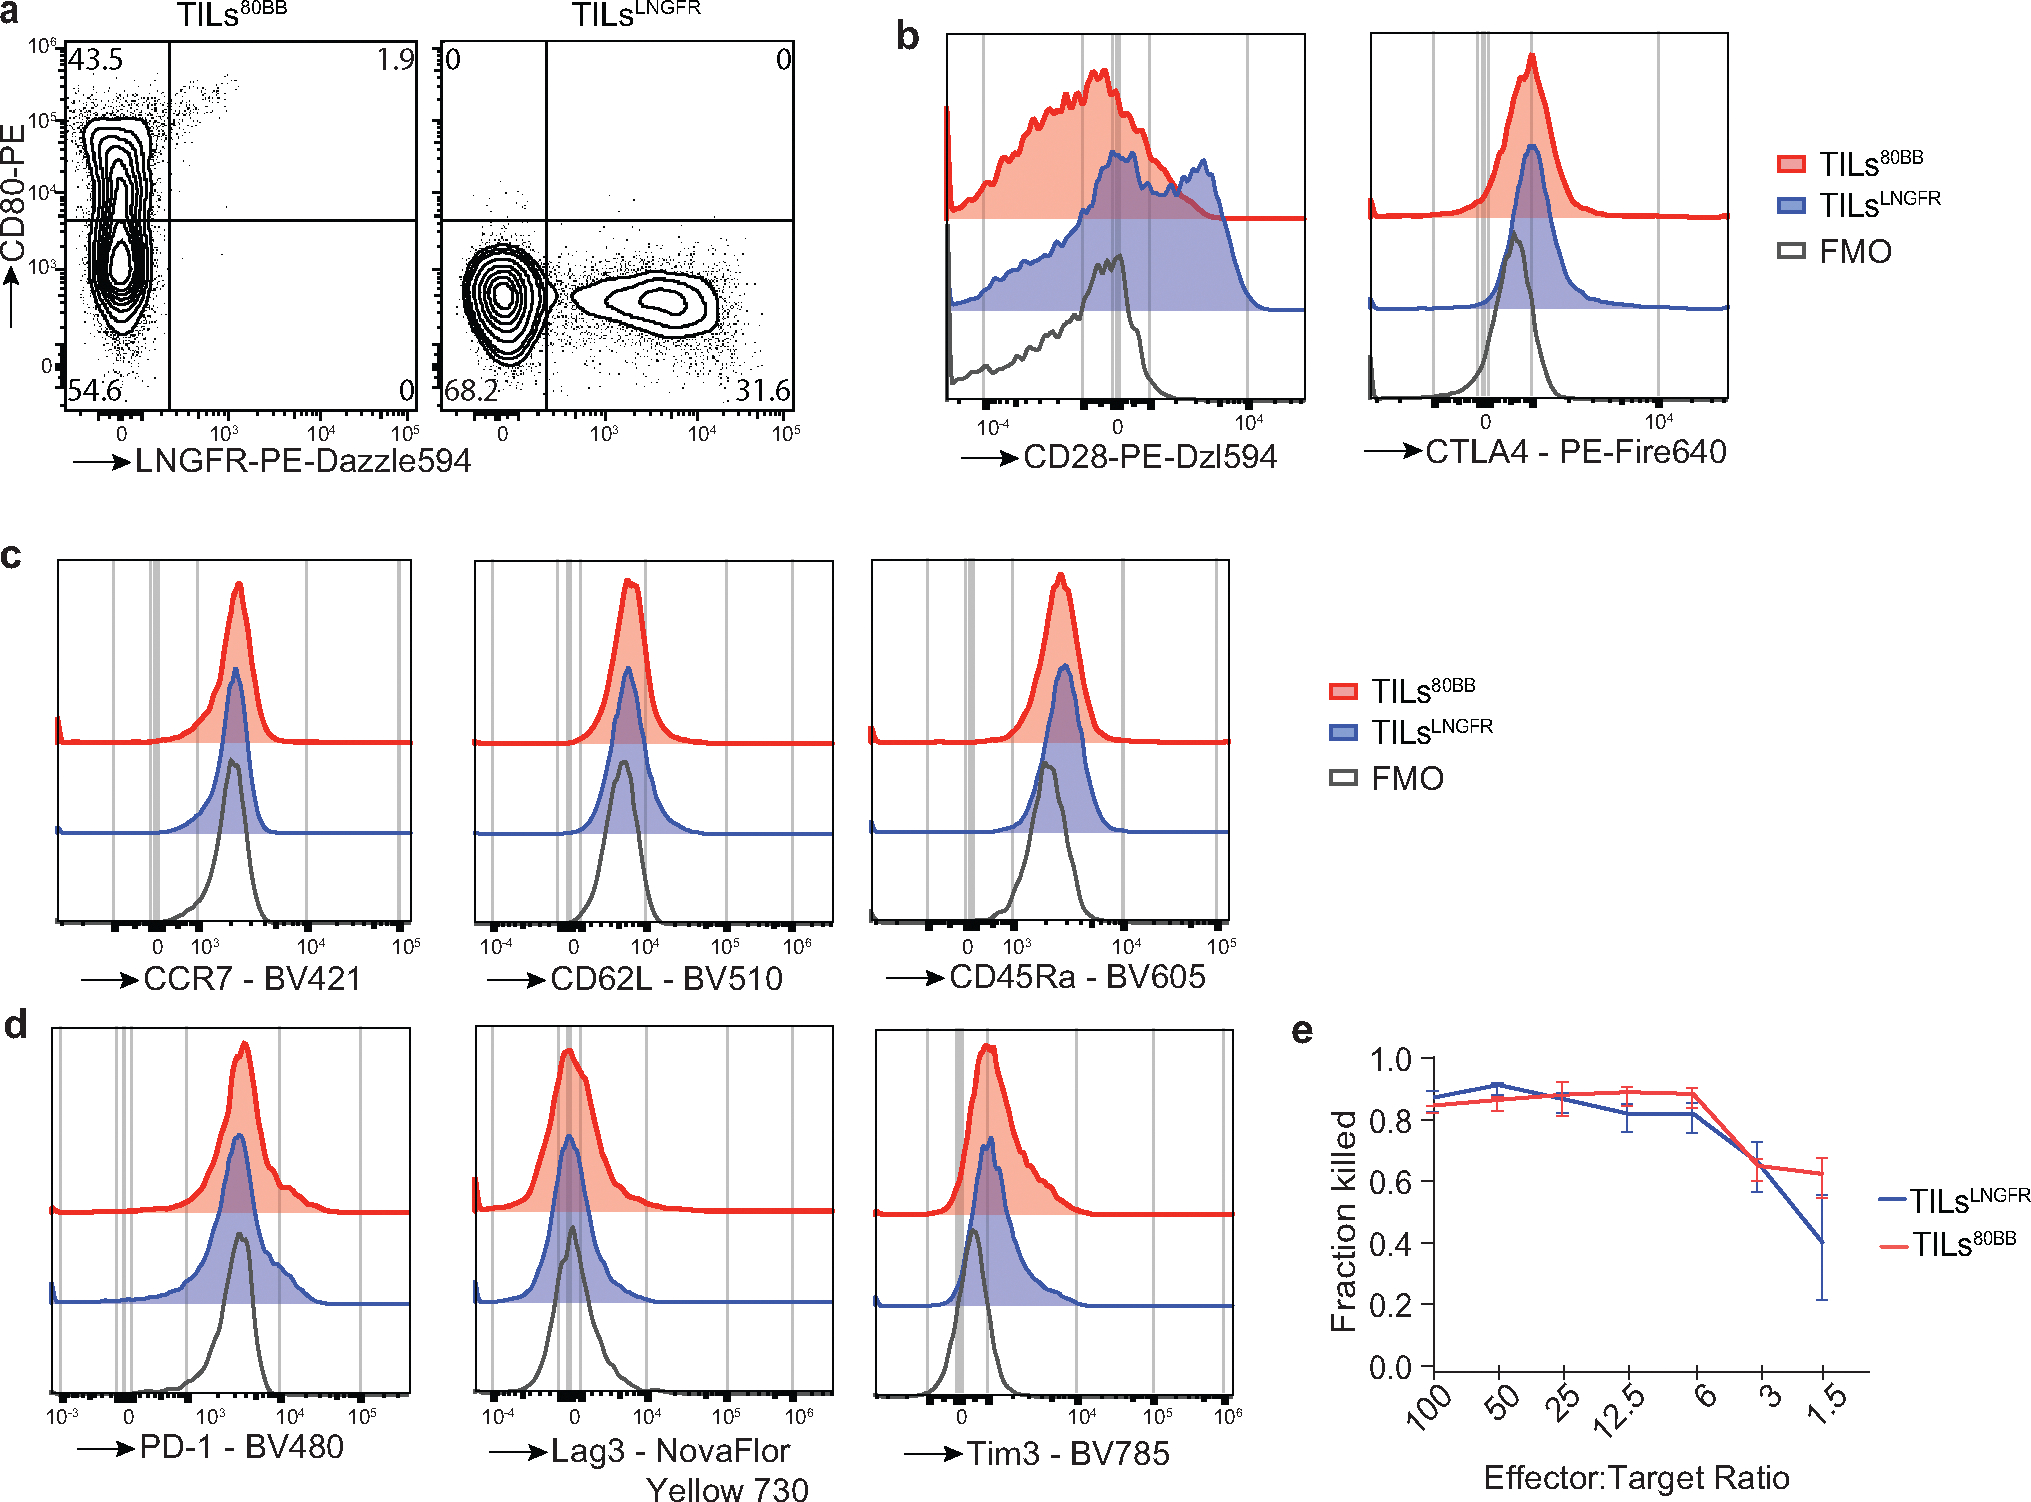
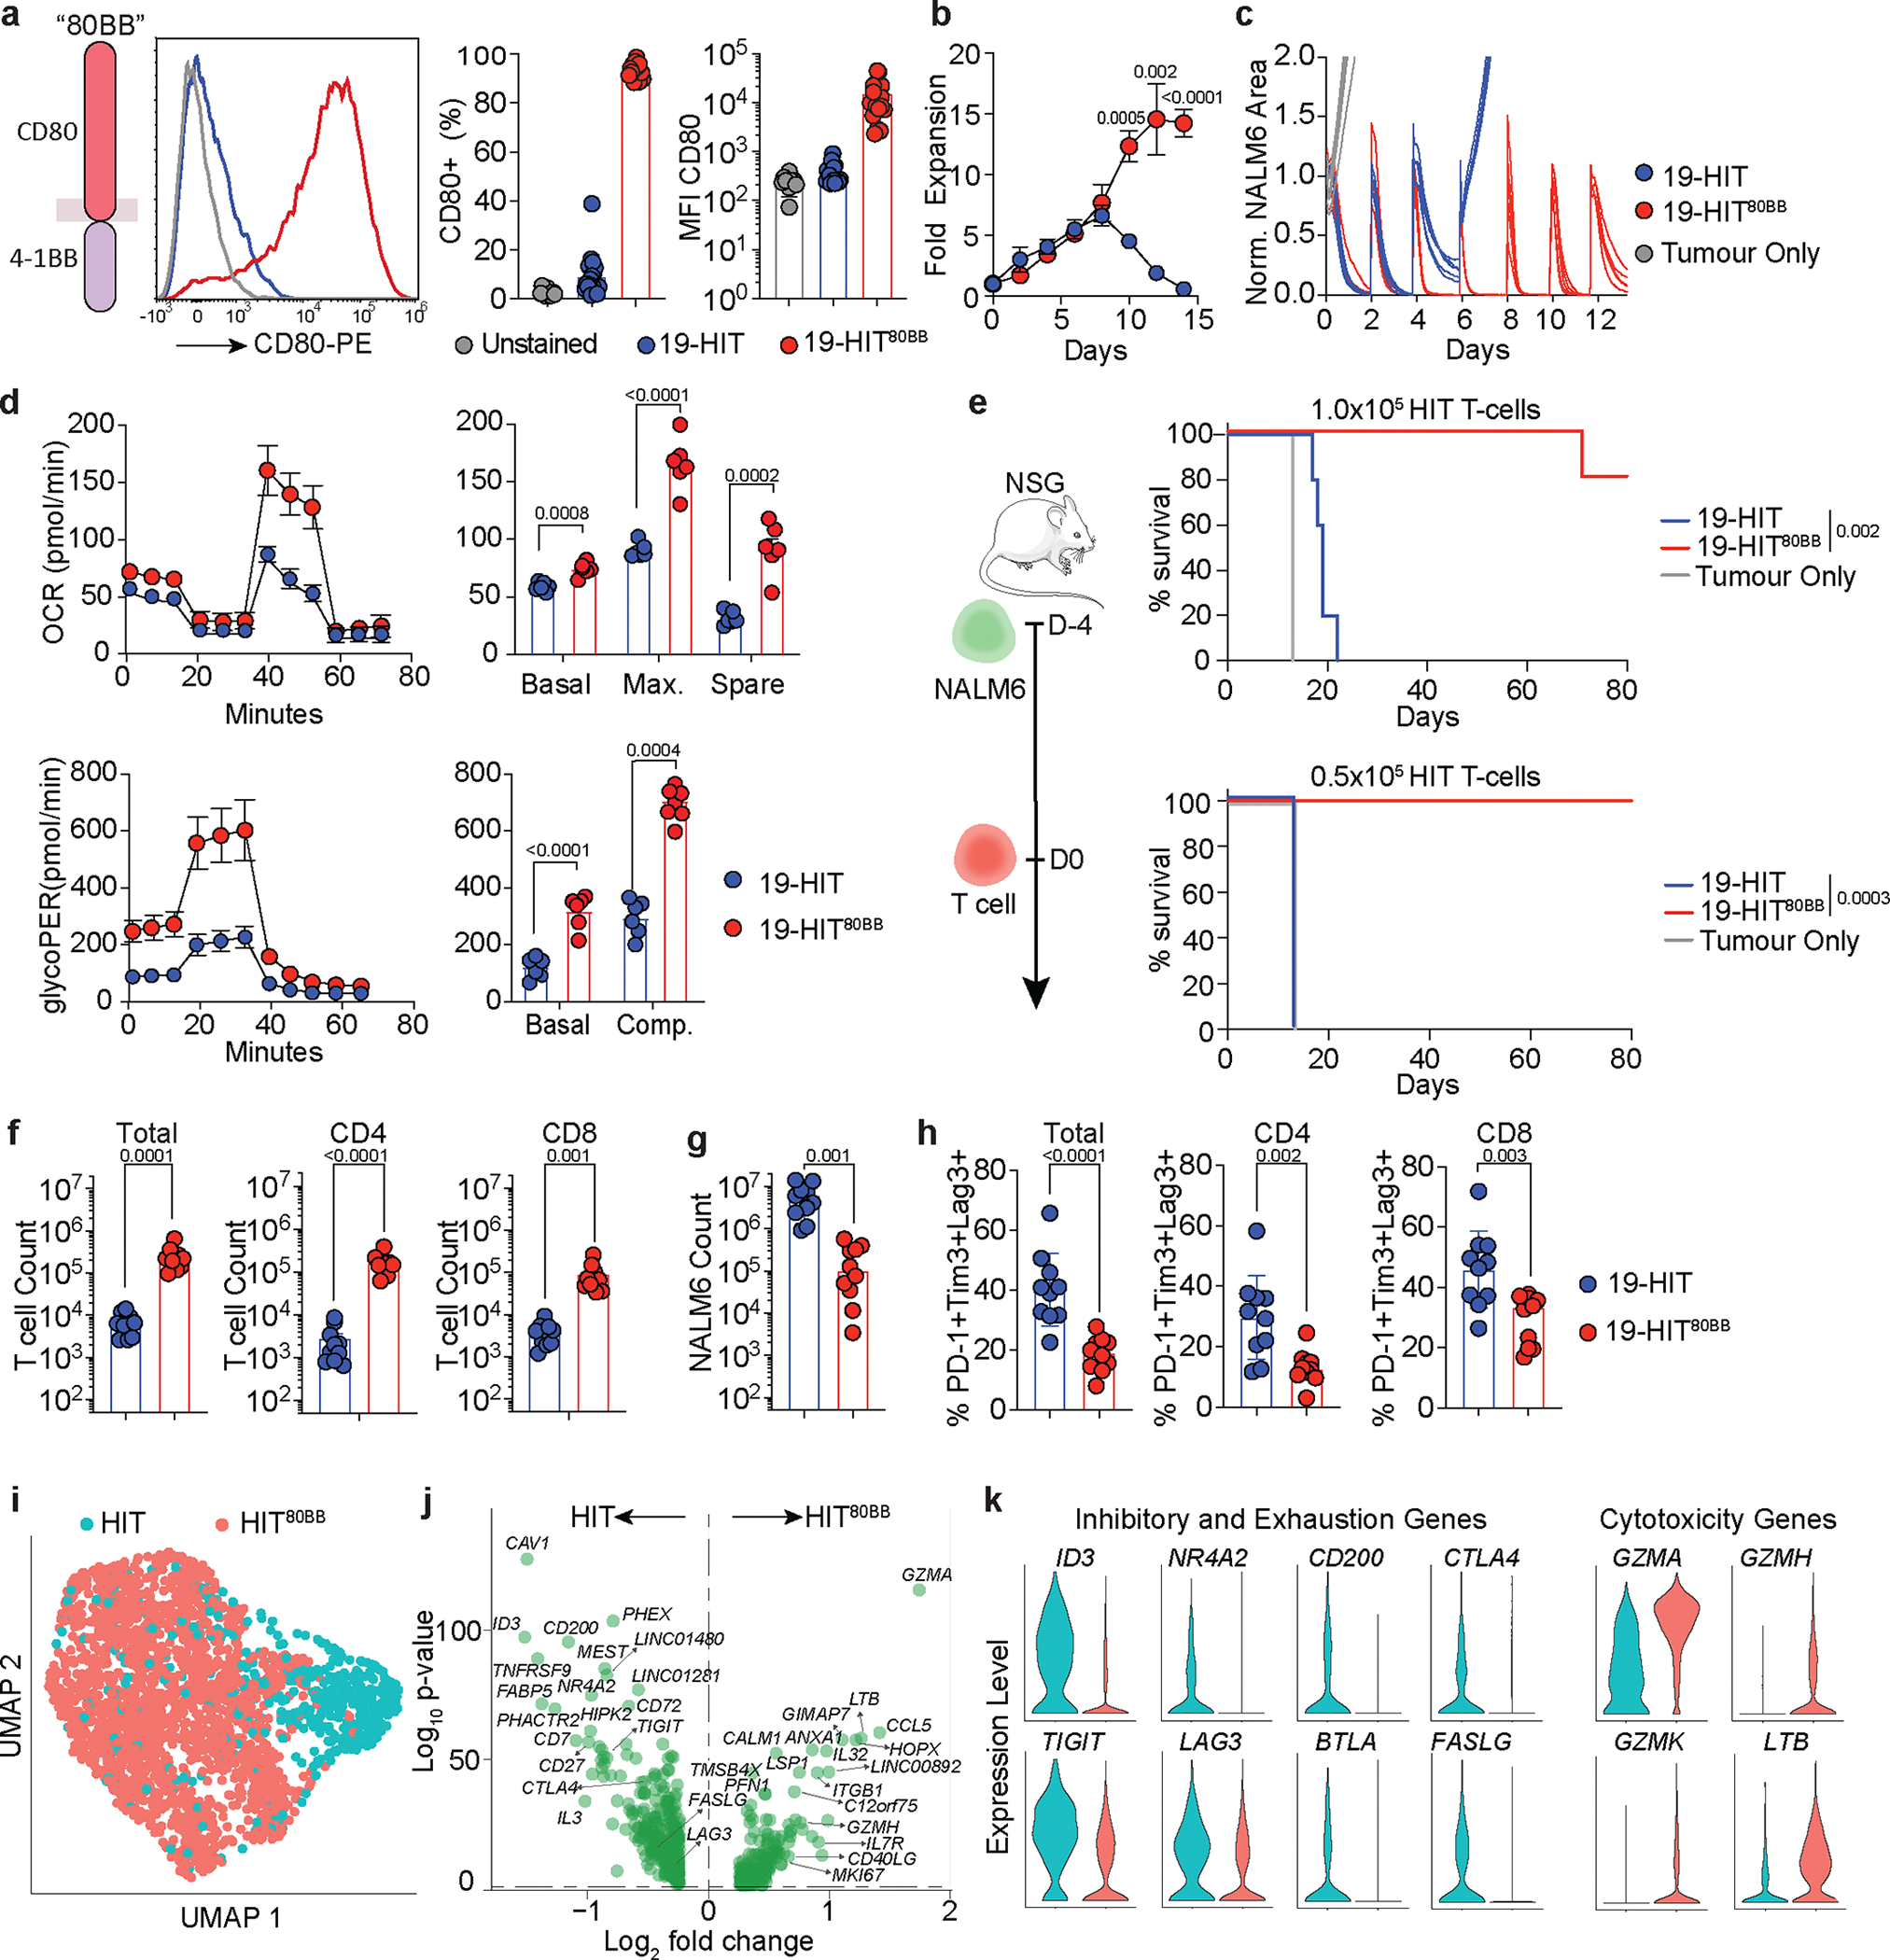
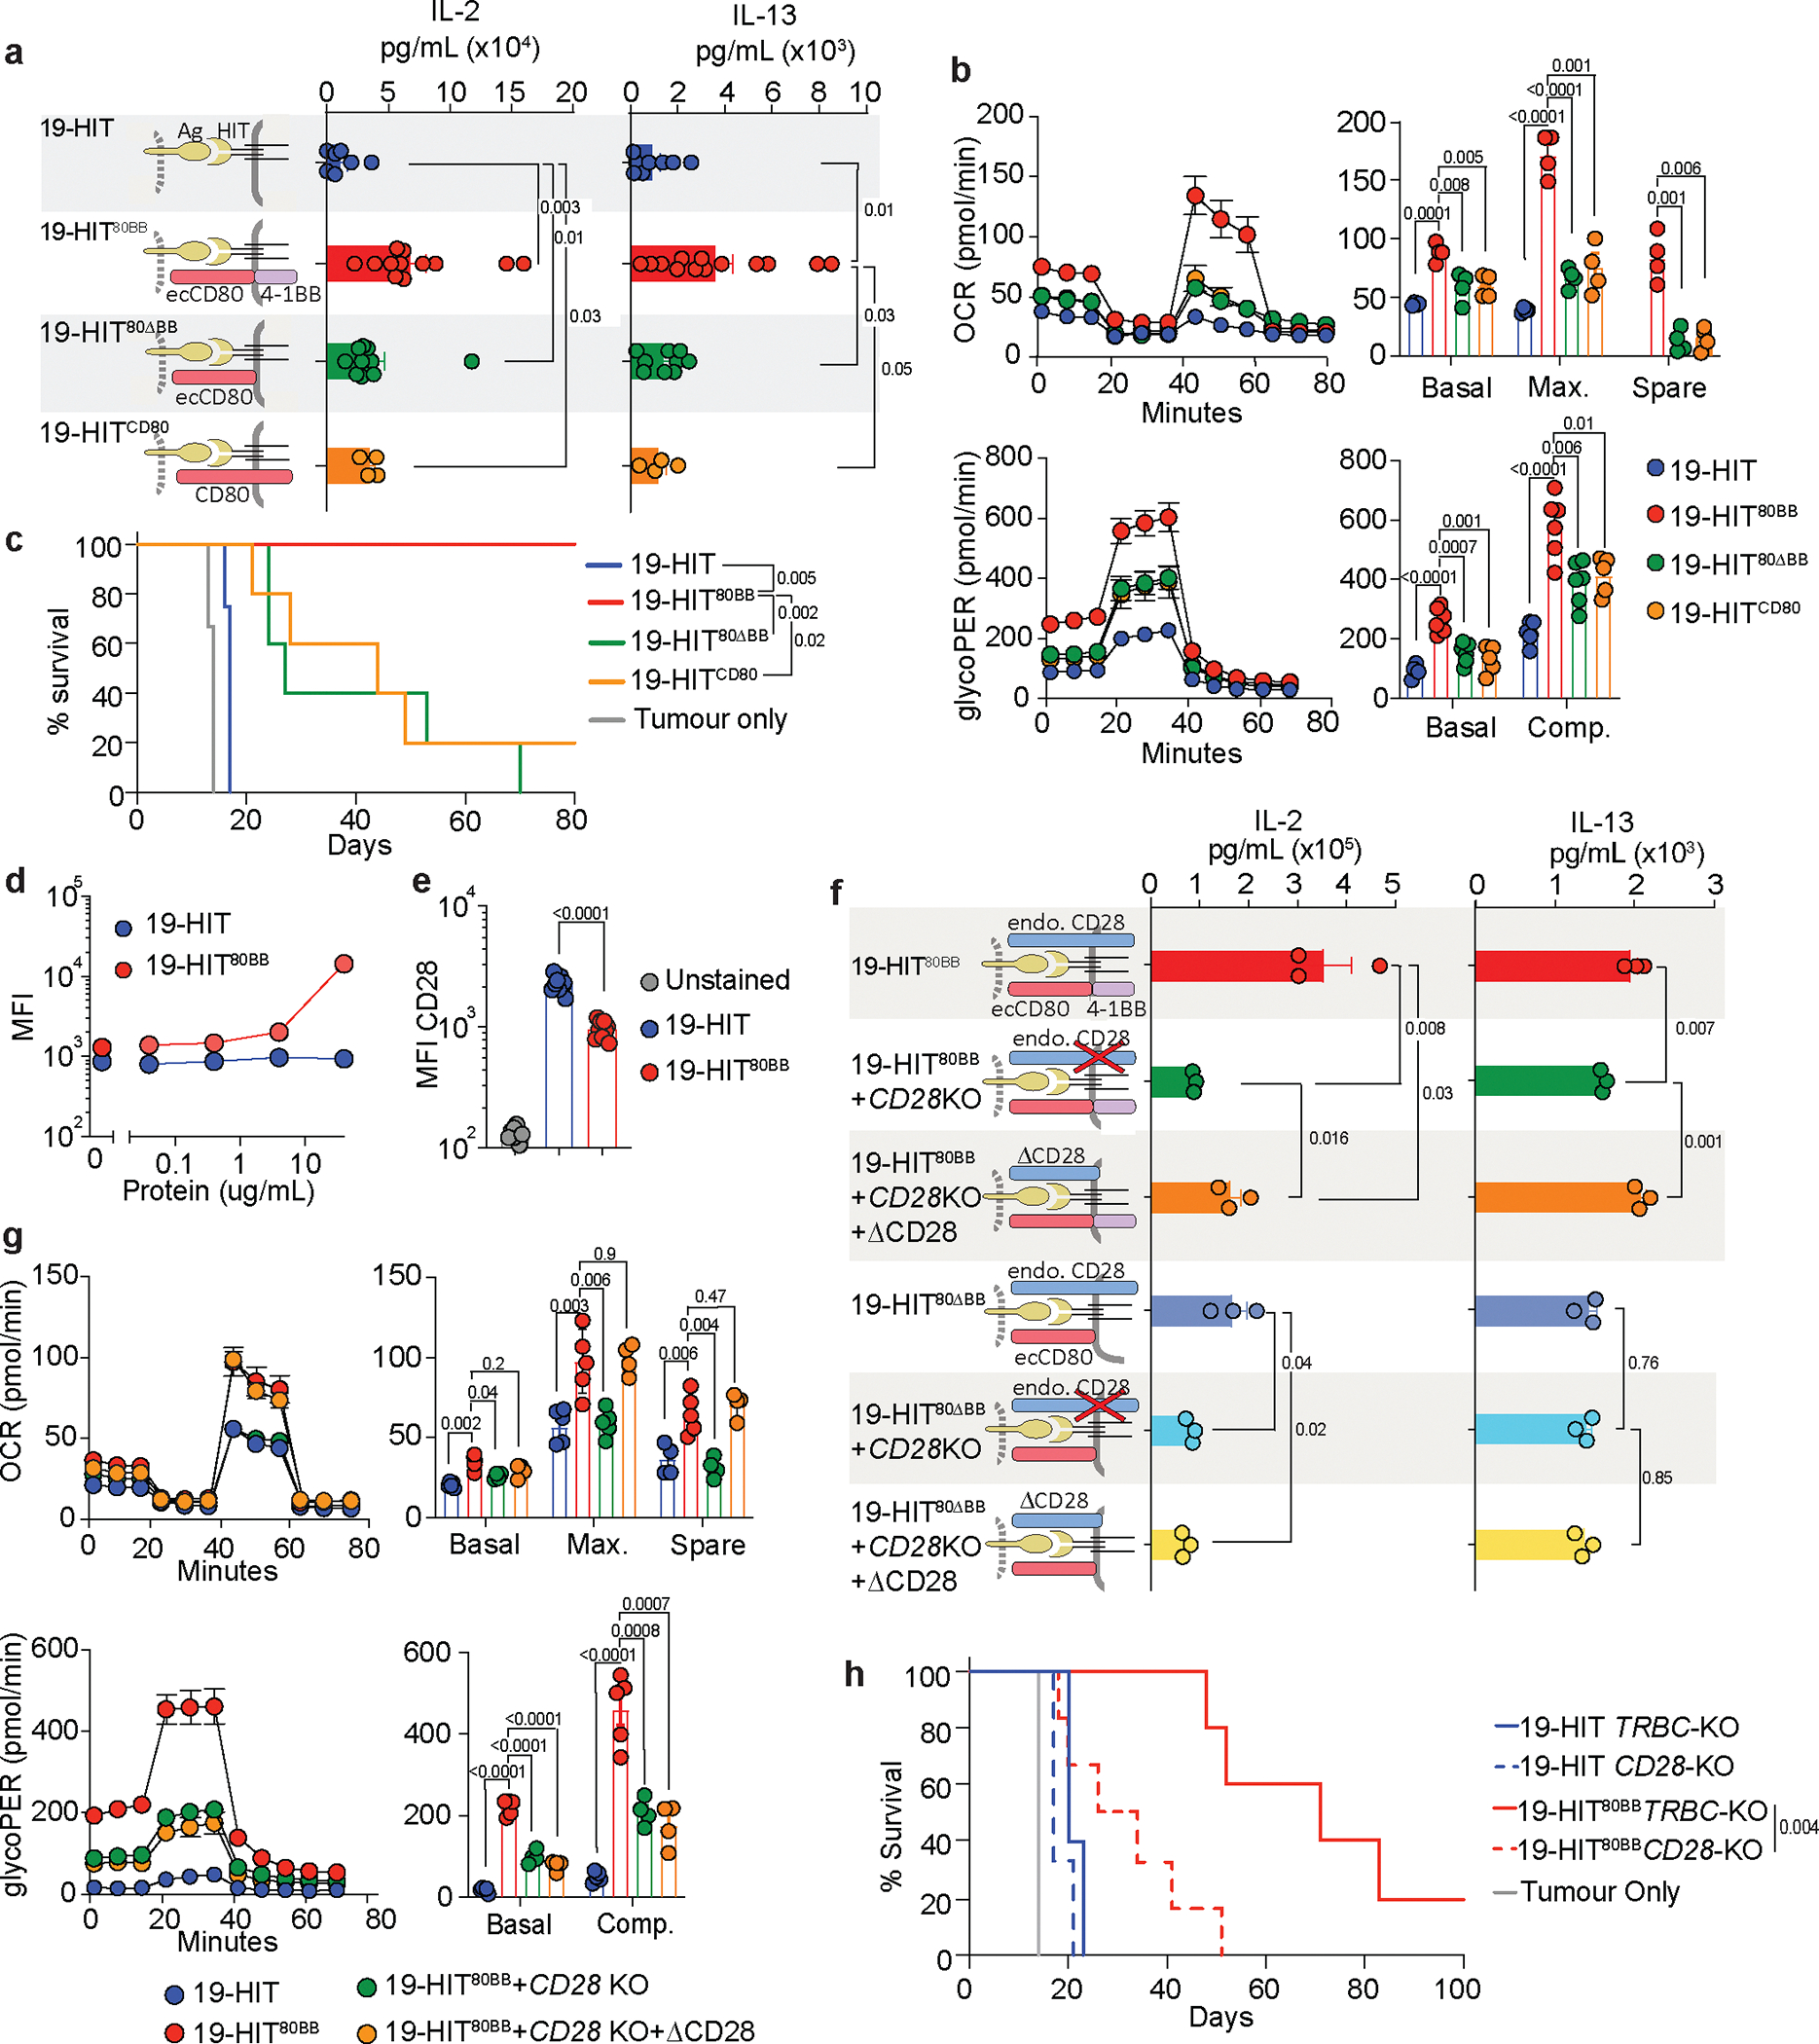
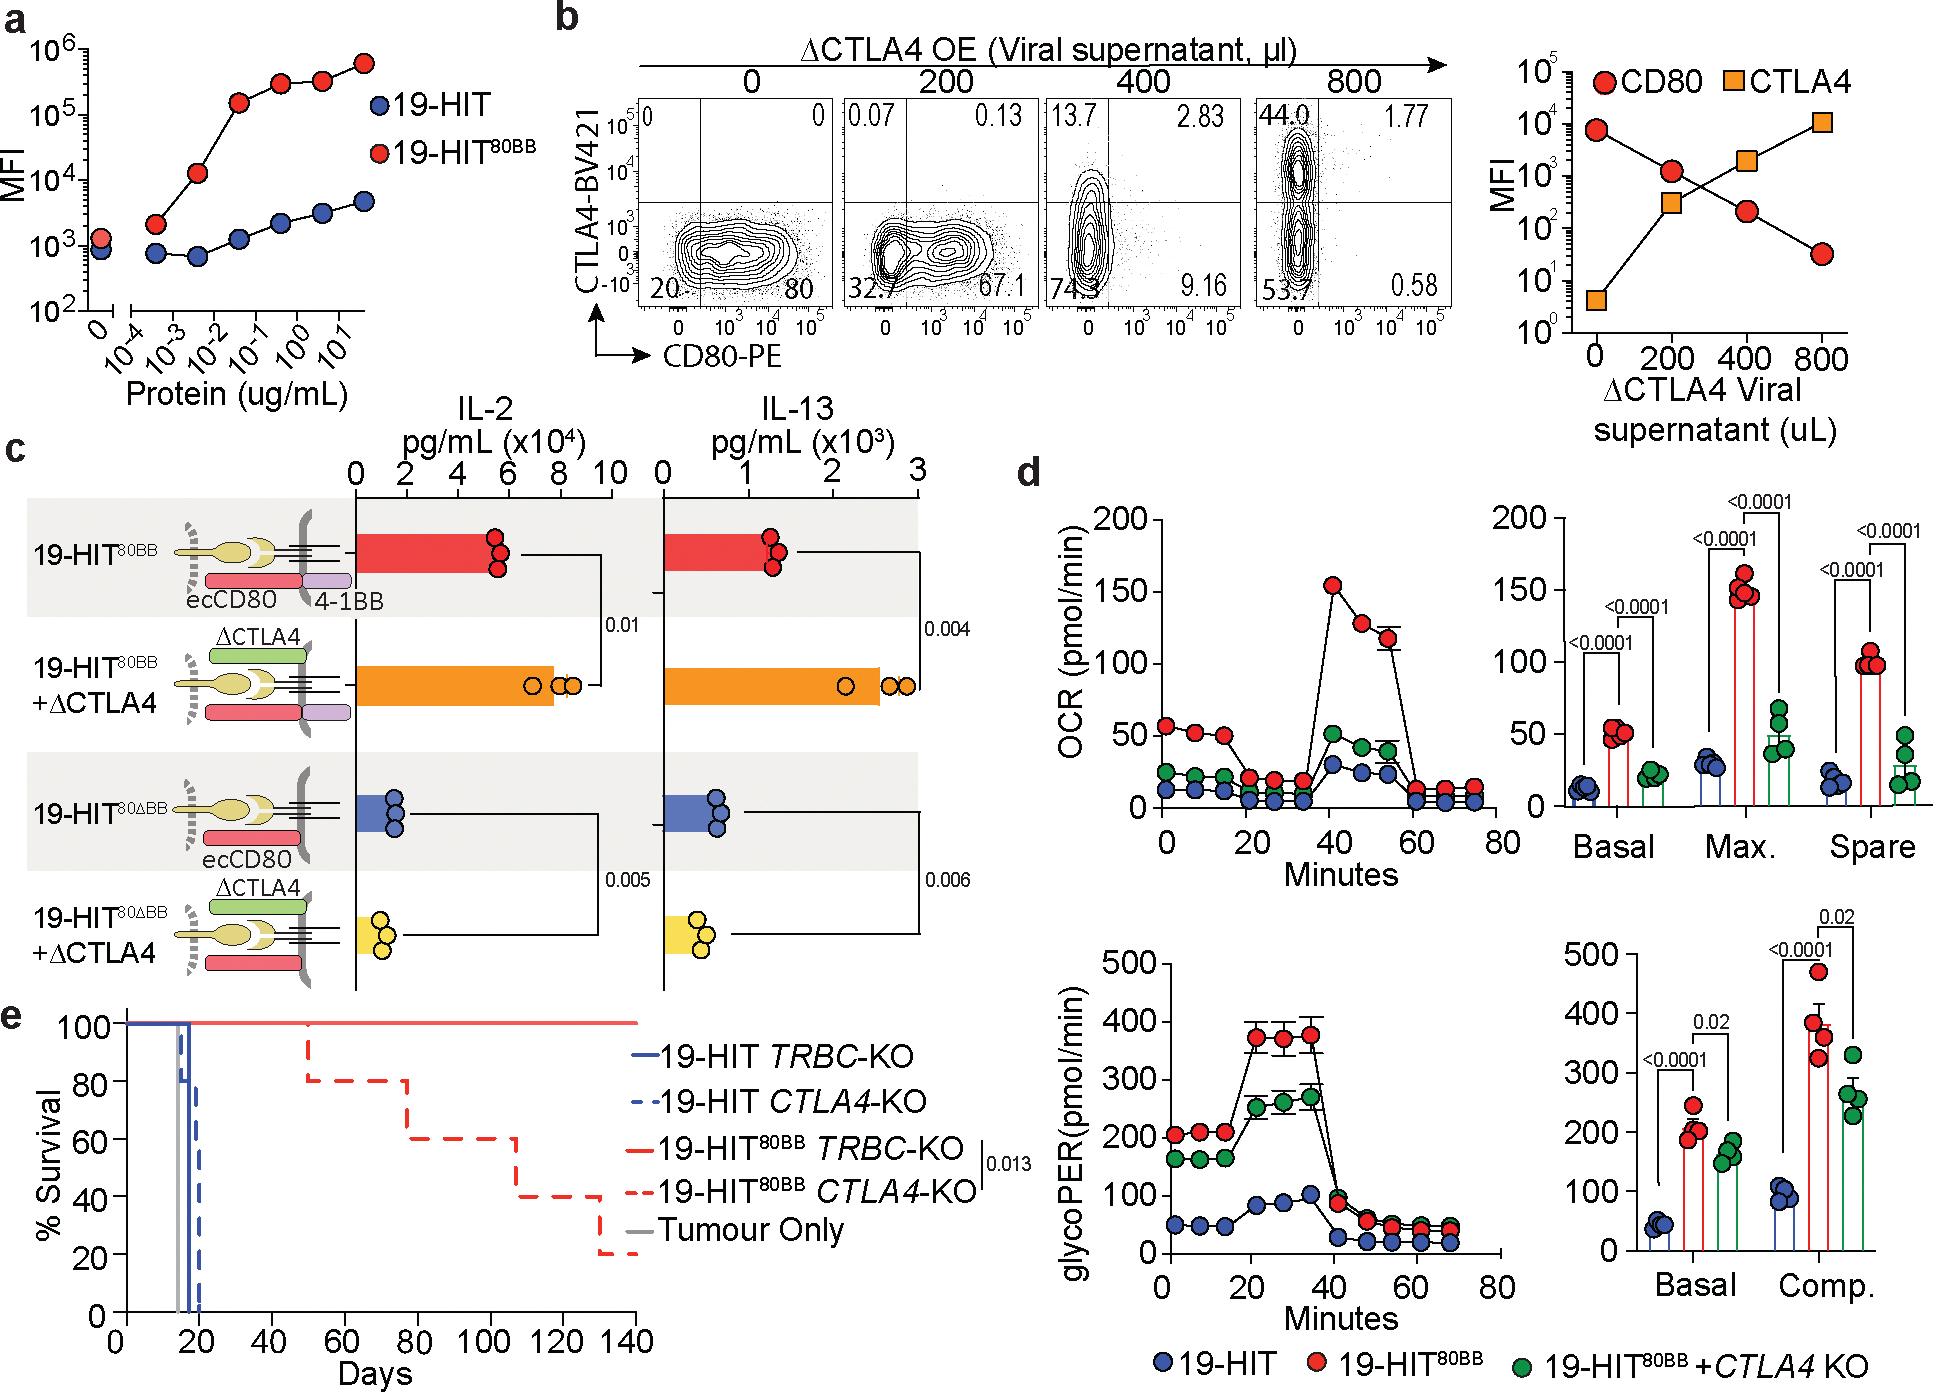
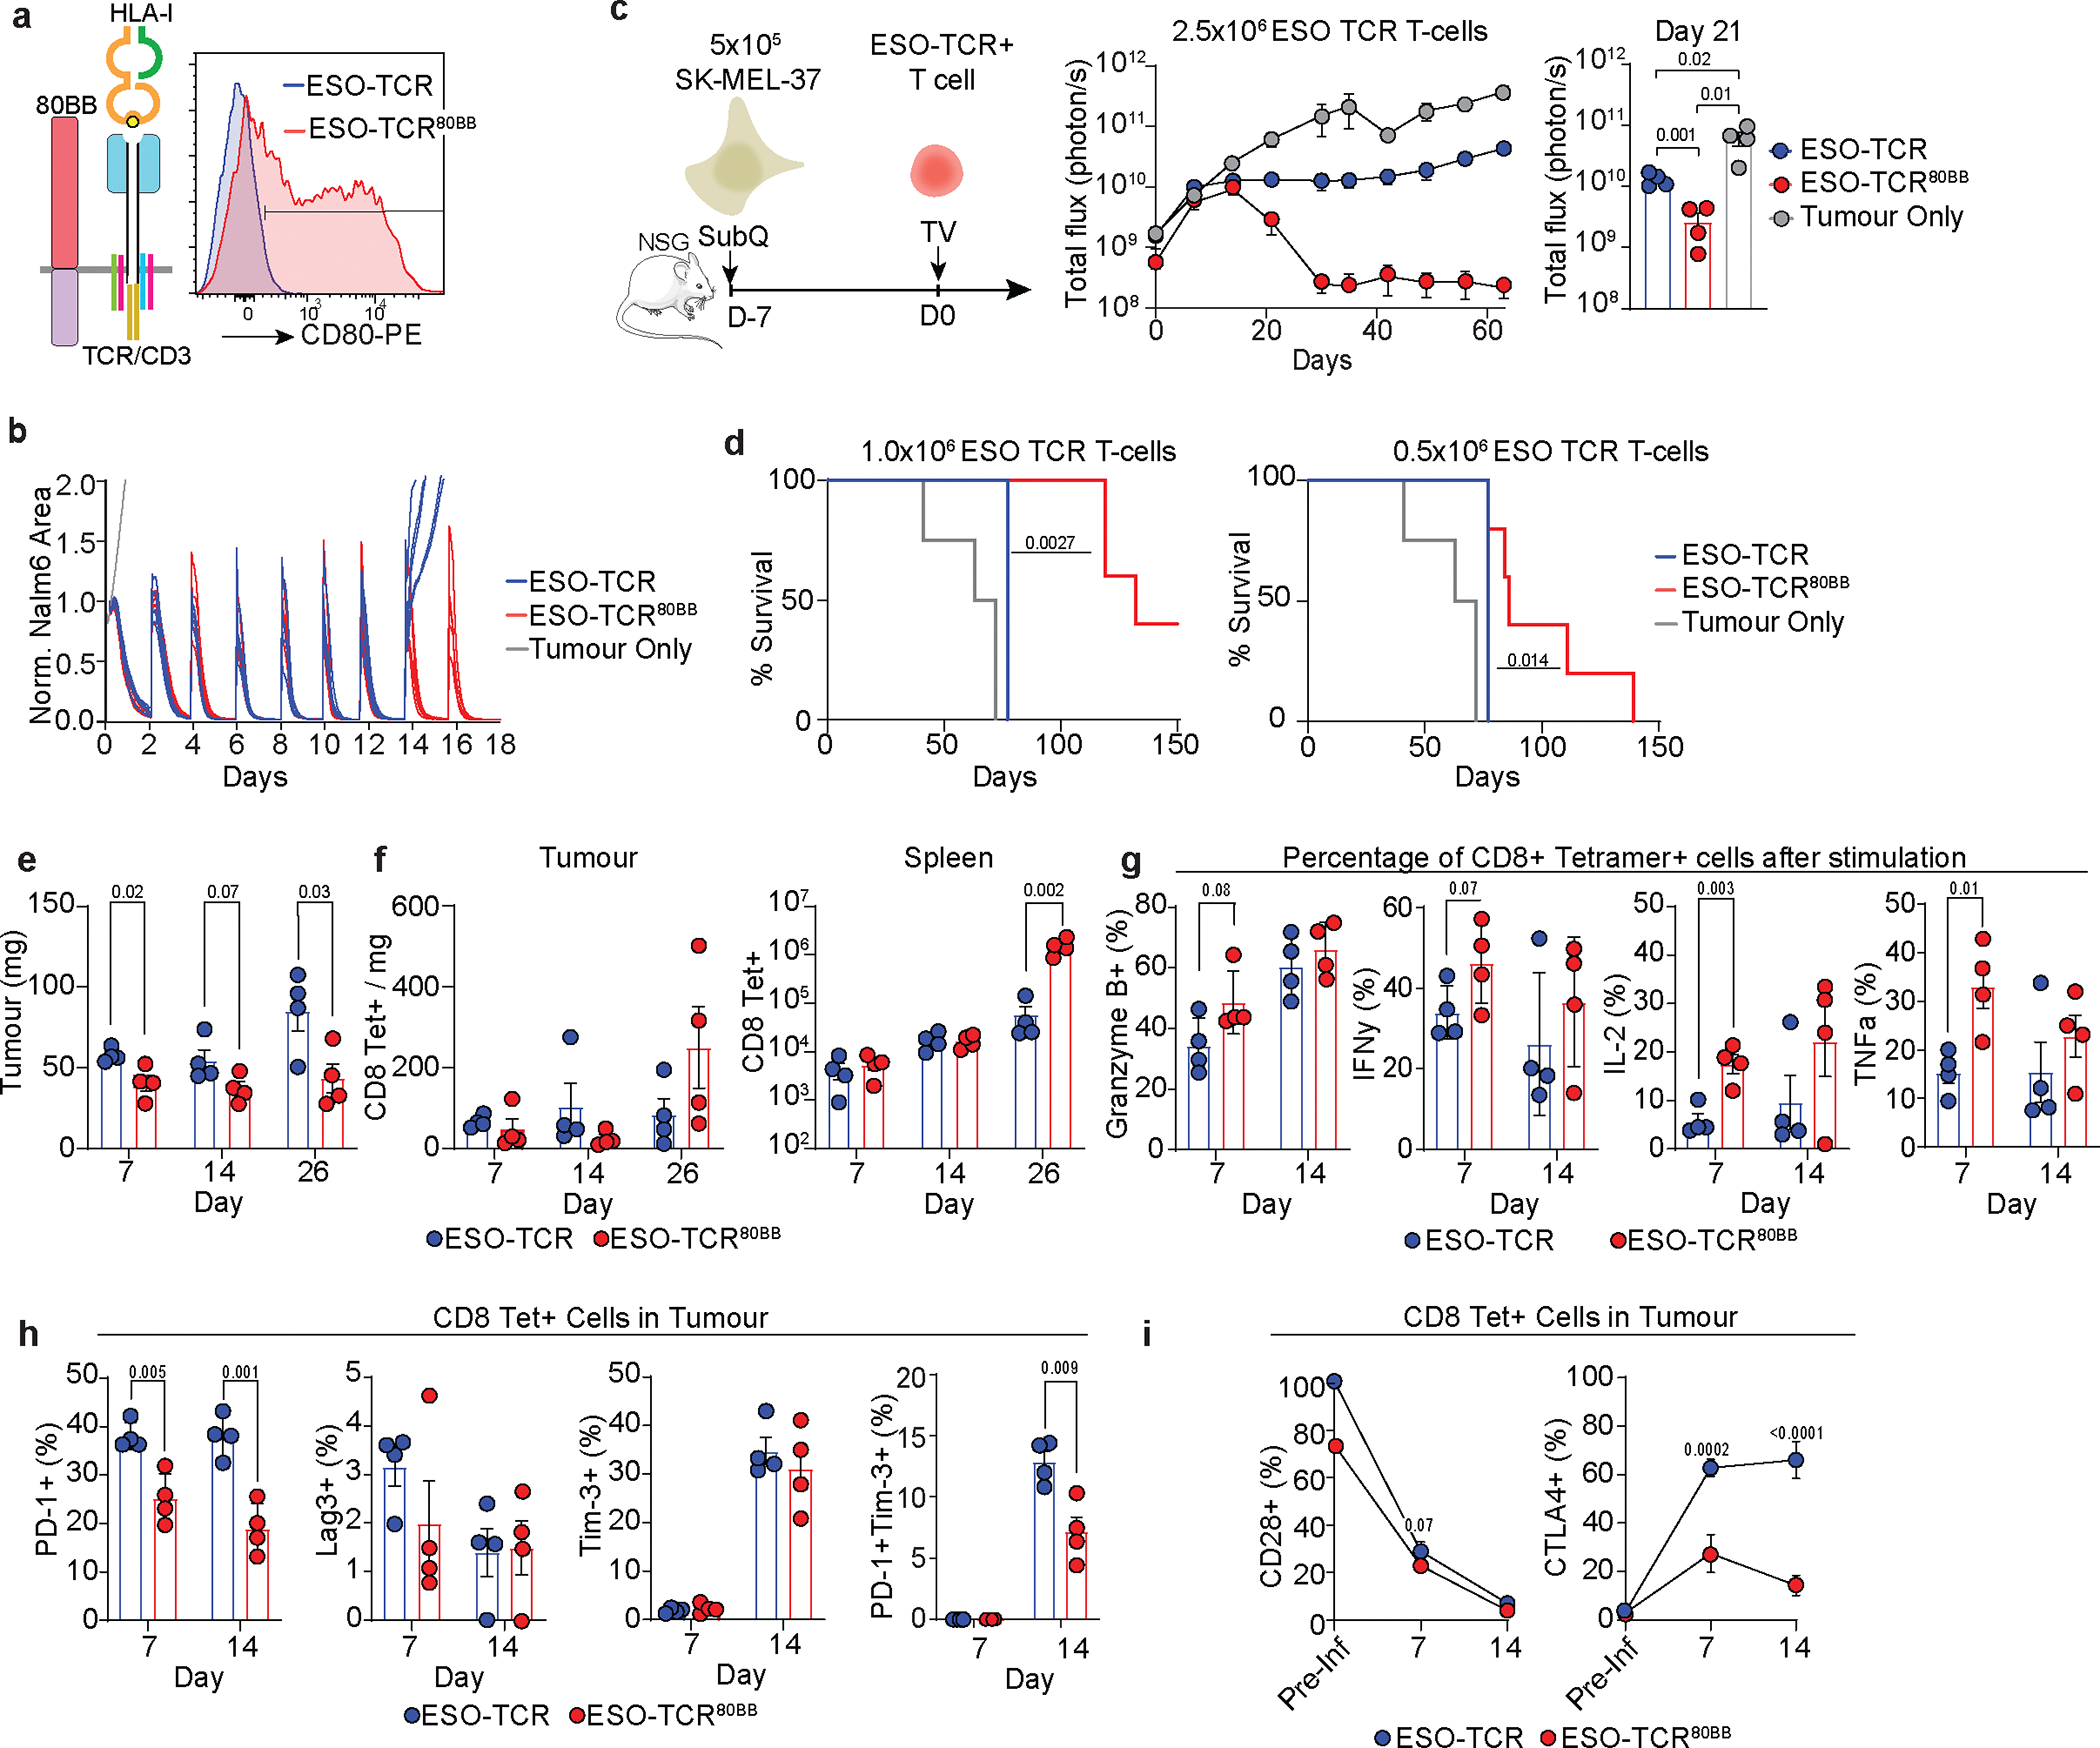
Chimeric antigen receptor T cells have dramatically improved the treatment of hematologic malignancies. T cell antigen receptor (TCR)-based cell therapies are yet to achieve comparable outcomes. Importantly, chimeric antigen receptors not only target selected antigens but also reprogram T cell functions through the co-stimulatory pathways that they engage upon antigen recognition. We show here that a fusion receptor comprising the CD80 ectodomain and the 4-1BB cytoplasmic domain, termed 80BB, acts as both a ligand and a receptor to engage the CD28 and 4-1BB pathways, thereby increasing the antitumor potency of human leukocyte antigen-independent TCR (HIT) receptor- or TCR-engineered T cells and tumor-infiltrating lymphocytes. Furthermore, 80BB serves as a switch receptor that provides agonistic 4-1BB co-stimulation upon its ligation by the inhibitory CTLA4 molecule. By combining multiple co-stimulatory features in a single antigen-agnostic synthetic receptor, 80BB is a promising tool to sustain CD3-dependent T cell responses in a wide range of targeted immunotherapies.


Conflict of interest statement

Competing interests

Memorial Sloan Kettering has submitted a patent application based in part on results presented in this manuscript (A.D., M.H. and M.S. are listed among the inventors). M.S. reports research funding from Fate Therapeutics, Takeda Pharmaceuticals, Atara Biotherapeutics and Mnemo Therapeutics. All other authors declare no competing interests.

Figures

Extended Data Fig. 1
Extended Data Fig. 1. Cell engineering diagram and extended characterization of 19-HIT80BB cells
a, Diagram illustrating genetic T cell engineering strategy of HIT and HIT80BB cells. The alpha and beta chains of HIT directed against CD19 were targeted into the TRAC locus as previously described. 80BB construct was delivered using a γ-retroviral vector. b,Flow cytometry profile of HIT expression on 19-HIT (blue) and 19-HIT80BB (red) measured using a goat anti-mouse antibody (GaM). c, 48hr serial in vitro cytotoxicity assay using NALM6 targets. Cells were plated at an effector: target ratio of 1:2. n=7 independent co-cultures of cells from a healthy donor. d,18hr cytotoxicity assay with NALM6 and NALM6CD19 KO. n=3 independent co-cultures of cells from a healthy donor, representative of 4 donors. e,Human IL-2, TNFα and IFNɣ supernatant concentration 24hr post co-culture with NALM6 target cells at E:T ratio of 1:2. n=4 independent co-cultures of cells from a healthy donor, representative of 3 donors. f, Serial in vitro cytotoxicity assay with fresh NALM6 cells added every 2 days, starting with sorted CD4 (left) and CD8 T cells (right) at a ratio of 1 effector : 2 targets. Each line is an independent co-culture of cells from a healthy donor. g, Flow cytometry profiles of CD80, CD86 and PD-L1, 4–1BBL and CTLA4 on NALM6 cells. h, Kaplan–Meier survival analysis of NALM62000 (2000 CD19 mol/cell, left) or NALM6200 (200 CD19 mol/cell, right) -bearing mice treated with 1×10⁵ (left) or 4×10⁵ (right); respectively, 19-HIT+ T cells. n=5 mice/group. i, j, Absolute count of total (i, left), CD4 (i, middle), CD8 (i, right) T cells and absolute count of NALM6 cells (j) were isolated from bone marrow of NALM6 bearing mice seventeen days post 1×10⁵ HIT or HIT80BB cell treatment. n=4 mice/group treated with 1×10⁵ HIT+ T cells/mouse. P values were determined by two-tailed t-test (d, e), Mann-Whittney test (i, j), or log-rank Mantel-Cox test (h). Data are mean ± sem
Extended Data Fig. 2
Extended Data Fig. 2. UMAP projections and Suerat clustering of 19-HIT and 19-HIT80BB cells
a, UMAP projection of 2591 cells isolated from bone marrow of NALM6 bearing mice nine days post HIT or HIT80BB treatment. Cells are coloured based on Suerat assigned cluster identities. Clusters 0, 1, 2, 3 and 5 are composed of HIT80BB cells. Cluster 4 is predominantly composed of HIT cells. b, Feature and violin plots of CD8A (left), CD4 (right) transcripts. c, Dot plot of top 10 differentially enriched genes in each cluster. Colour of dot indicates expression level, and size of dot indicated percentage of cells expressing marker. d, Feature and violin plots of MKI67 (left), IL7R (right). For violin plots, cells are plotted segregated by cluster and by treatment type.
Extended Data Fig. 3
Extended Data Fig. 3. Feature plots of selected inhibitory, exhaustion and cytotoxicity genes
a, b Feature plots of inhibitory and exhaustion (a) and cytotoxicity (b) genes corresponding to violin plots in Fig. 1f.
Extended Data Fig. 4
Extended Data Fig. 4. Extended characterization of 80BB dependence on 4–1BB and CD28 signaling.
a, Left, representative flow cytometry profiles of HIT, HIT80BB, HIT80ΔBB and HITCD80 stained for CD80. Representative of 4 independent healthy donors. Right, summary of CD80 MFI and percentage from 3 independent donors analyzed at same flow cytometry settings. b, T cells were engineered with LNGFR (control), 80BB or 80ΔBB and unstimulated or stimulated with anti-CD3 beads for 1hr at a 4:1 bead to T cell ratio. Phospho PLCyY783, total PLCy, phospho-AKTS473, total ATK, phospho-p65S536, total p65, phospho-ERKT202/Y204 and total ERK were measured by western blot. Western blots representative of two technical replicates. c, Flow cytometry plots of CD28-Fc binding assay. T cells were incubated with increasing concentrations of CD28-Fc, and then stained with PE-anti-Fc. d, Left, representative flow cytometry plot of HIT and HIT CD28KO cells 5 days post CRISPR Cas9 editing. Right, summary of decrease of CD28 surface expression indicating CD28 KO in 9 donors. e, Left, flow cytometry plot of unstained cells, HIT TRBC KO, HIT CD28 KO cells, and HIT CD28 KO+ΔCD28 OE cells. Right, summary of CD28 MFI after ΔCD28 overexpression in HIT cells. Each dot is an independent healthy donor. f, Human IL-2 and IL-13 supernatant concentration 24hrs post co-culture of NALM6 target cells with 19-HIT and 19-HIT80BB cells at an effector: target ratio of 1:100. g, Ratio of human IL-2 and IL-13 secreted by 19-HIT and 19-HIT80BB cells after 24hr co-culture with Nalm6CD28 relative to NALM6wt. f, g, n=4 independent co-cultures of cells from a healthy donor, representative of 3 donors. P values were determined by two-tailed t-test (f, g). Data are mean ± sem
Extended Data Fig. 5
Extended Data Fig. 5. Extended characterization of 80BB and CTLA4 interactions
a, Flow cytometry plots of CTLA4-Fc binding assay. Cells were incubated with increasing concentrations of CTLA4-Fc, and then stained with PE-anti-Fc. b, Ratio of human IL-2 and IL-13 secreted by 19-HIT and 19-HIT80BB cells after 24hr co-culture with Nalm6CD28 relative to Nalm6. n=4 independent co-cultures of cells from a healthy donor, representative of 3 donors. c, Serial in vitro cytotoxicity assay using NALM6 or NALM6ΔCTLA4. Fresh target cells were added every 2 days. Each line is an independent co-culture of cells from a healthy donor, representative of 3 donors. d, Left, trace from inference of CRISPR Edits (ICE) tool (Synthego) highlighting extent of CTLA4 knockout. Right, summary of extent of CTLA4 editing indicating CTLA4 knockout evaluated by ICE from 9 donors. e, Serial in vitro cytotoxicity assay of HIT, HIT80ΔBB, or HIT80BB with TRBC, CD28 or CTLA4 genes CRISPR edited. Fresh NALM6 target cells were added every 2 days. Each line is an independent co-culture of cells from a healthy donor, representative of 3 donors. P values were determined by two-tailed t-test (b). Data are mean ± sem
Extended Data Fig. 6
Extended Data Fig. 6. 80BB does not lead to by-stander cell activation nor increased CRS compared to a clinical-licensed CAR
a, Representation of in vitro by-stander activation assay. Labelled HIT T cells were plated onto wells with HIT cells or HIT80BB cells, or wells coated with CD28 superagonist antibody (CD28 SA) in the absence of target cells. b, c, Quantification of cell-surface CD69 on bystander HIT cells (b) and levels of IL-2, IFNɣ and TNFα in the supernatant (c) 24hrs after exposure to wells containing HIT, HIT80BB or coated with CD28SA. n=4 independent co-cultures of cells from a donor, representative of 2 donors. d, Left, Diagram depicting in vivo cytokine release syndrome (CRS) model. Right, weight change of tumour-bearing mice after 19-HIT (n=8 mice), 19-HIT80BB (n=4 mice), 1928z CAR (n=6 mice) or no (n=4 mice) T cell transfer. Weight per mouse is normalized to starting weight before T cell infusion. 10% cut-off for CRS is illustrated with a dotted line. e, f, Frequency of diarrhea in days (e) and serum cytokine levels 18hrs (f) after T cell infusion into tumour-bearing Scid Beige mice. P values were determined by two-tailed t-test (b, c, f) and Chi-square test(e). Data are mean ± sem.
Extended Data Fig. 7
Extended Data Fig. 7. Extended characterization of ESO80BB TCR T cells in a subcutaneous melanoma model
a, Diagram depicting TCR T cell engineering. The alpha and beta chains of an NY-ESO-1 directed TCR were targeted into the TRAC locus as previously described. 80BB was delivered using the SFG γ-retroviral vector. b, c, d, e, Analyses of T cells isolated from the tumours or spleens of mice implanted with subcutaneous SK-Mel-37 and treated with ESO-TCR or ESO-TCR80BB. n=4 mice per group per time point b, CD4+ Tetramer+ T cell counts isolated from tumours or spleens. c, counts of CD8+Tetramer+ T stem cell memory (Tscm, CCR7+, CD45Ra+), CD8+Tetramer+ T central memory cells (Tcm, CCR7+, CD45Ra-), CD8+Tetramer+ T effector memory cells (Tem, CCR7-, CD45Ra-) CD8+Tetramer+ T effector cells (Teff, CCR7-, CD45Ra+) isolated from spleens. d, Percentage of Tetramer+ CD8+ spleen-isolated T cells expressing Granzyme B, IFNɣ, IL-2 TNF-a after PMA/Ionomycin stimulation. e, Frequency of Tetramer+ CD8+ spleen-isolated T cells expressing PD-1, Lag3, Tim3 or PD-1 and Tim3 double positive cells. P values were determined by two-tailed t-test (c, d, e). Data are mean ± sem.
Extended Data Fig. 8
Extended Data Fig. 8. Flow characterization of post-rapid expansion protocol patient-derived tumour infiltrating lymphocytes
a, Flow profile of transduced TILs transduced for 80BB (left) and LNGFR (right). b, c, d, Flow profile of post-rapid expansion protocol TILsLNGFR (blue) and TILs80BB (red) cells stained for 80BB ligands CD28 and CTLA4 (b), differentiation markers CCR7, CD62L, CD45Ra (c), exhaustion markers PD-1, Lag3, Tim3 (d). e, Fraction of cells killed after 18hrs of co-culture of transduced TILs and autologous tumour cells. n=3 independent co-cultures from cells expanded from 1 patient-derived tumour sample. Data are mean ± sem.
Figure 1:
Figure 1:. Synthetic costimulatory molecule (80BB) enhances HIT cell anti-tumour function.
a, Left, diagram depicting the fusion of the extracellular and transmembrane domain of CD80 with the intracellular domain of 4–1BB to generate “80BB” molecule. Middle, representative flow cytometry profile of CD80 on the surface of 19-HIT T cells with (red, 19-HIT80BB) or without (blue, 19-HIT) retrovirally transduced 80BB. Right, CD80 percentages and MFI of 19-HIT and 19-HIT80BB cells. n=18 independent healthy donors. b, T cell fold expansion upon repetitive antigen stimulation. n=3 independent co-cultures of cells from a healthy donor, representative of 3 donors. c,Serial in vitro cytotoxicity assay using NALM6. n=5 independent co-cultures from of cells from a healthy donor, representative of >10 donors. d, Mitochondrial stress (top), and glycolytic rate (bottom) Seahorse assays performed after 3 rounds of stimulation with NALM6 cells. “Max” and “Comp” refer to the maximum respiratory capacity and compensatory glycolytic rate, respectively. n=5 (19-HIT) or 6 (19-HIT80BB) independent reactions of cells from a healthy donor, representative of n=6 (Mitochondrial stress) and n=4 (Glycolytic rate) donors. e, Left, diagram depicting in vivo treatment of NALM6-bearing mice with 19-HIT or 19-HIT80BB cells. Right, Kaplan–Meier survival analysis of NALM6 bearing mice treated with 1×10⁵ (top) or 0.5×10⁵ (bottom) 19-HIT or 19-HIT80BB cells (n=5 mice/group). Data are representative of 3 donors. f, Absolute counts of total (left), CD4+ (middle), CD8+ (right) T-cells. g, Absolute count of NALM6. h, Percentages of T cells co-expressing inhibitory markers PD-1, Lag3, Tim3 in total T cells (left), CD4 (middle) and CD8 (right). f, g, h: n=10 mice/group. i, UMAP projection of 2591 T cells isolated from the bone marrow of NALM6-bearing mice nine days post 19-HIT or 19-HIT80BB treatment. j, Volcano plot of differentially expressed genes between 19-HIT and 19-HIT80BB cells. k, Violin plots of selected genes significantly up or downregulated in 19-HIT and 19-HIT80BB highlighting Inhibitory, Exhaustion and Cytotoxicity genes. f-k, Data are pooled from 5 mice treated with 1×10⁵ and 5 mice with 0.5×10⁵ T cells. P values were determined by two-tailed t-test (a, b, d, f, g, h), log-rank Mantel–Cox test (e) or two-tailed Wilcoxon rank sum test (j, k). Data are mean ± sem.
Figure 2:
Figure 2:. 80BB provides dual 4–1BB and CD28 costimulation required for optimal anti-tumour function.
a, Left, diagrams depicting 19-HIT, 19-HIT80BB, 19-HIT expressing 80BB lacking the intracellular domain (19-HIT80ΔBB) and 19-HIT expressing full-length CD80 (HITCD80). Right, human IL-2 and IL-13 supernatant concentration 24hr post co-culture with NALM6 target cells at E:T ratio of 1:2. n=13 (19-HIT80BB, and 19-HIT80ΔBB), n=7 (19-HIT) or n=4 (19-HITCD80) independent healthy donors. b, Mitochondrial stress (top) and glycolytic rate (bottom) Seahorse assays were performed after 3 rounds of stimulation with NALM6 cells. n=6 independent reactions of cells from a healthy donor, representative of 3 healthy donors. c, Kaplan–Meier survival analysis of NALM6-bearing mice treated with 1×10⁵ 19-HIT, 19-HIT80BB, 19-HITCD80 or 19-HIT80ΔBB T cells (n=5 mice/group). d, Human CD28-Fc binding assay. T cells were incubated with increasing concentrations of CD28-Fc and then stained with PE-anti-Fc. Data are representative of 2 donors. e, MFI of CD28 surface staining 4 days after 19-HIT and 19-HIT80BB transduction. n=9 independent healthy donors. f, Left, diagrams depicting 19-HIT80BB, 19-HIT80BB+CD28 KO, 19-HIT80BB+CD28 KO transduced with CD28 lacking the intracellular domain (ΔCD28; HIT80BB+CD28 KO+ΔCD28), HIT80ΔBB, HIT80ΔBB+CD28 KO and HIT80ΔBB+ΔCD28. Right, human IL-2 and IL-13 supernatant concentration 24 h post co-culture with NALM6 target cells at E:T ratio of 1:2. n=3 independent co-cultures of cells from a healthy donor, representative of 3 donors. g, Mitochondrial stress (top) and glycolytic rate (bottom) Seahorse assays performed after 3 rounds of cell stimulation with NALM6. n=5 independent reactions of cells from a healthy donor, representative of 3 donors. h,Kaplan–Meier survival analysis of NALM6-bearing mice treated with 1×10⁵ 19-HIT80BB with KO-TRBC (control, n=5 mice), KO-CD28 (n=6 mice), or 1×10⁵ 19-HIT with KO-TRBC (control, n=5 mice) or KO-CD28 (n=5 mice). P values were determined by two-tailed Mann-Whitney test (a), two-tailed t-test (e), or log-rank Mantel-Cox test (c, h). Data are mean sem. q values in b, f, g were calculated based on two-tailed t-test p-values and adjusted using the two-state step-up method of Benjamini, Krieger and Yekutieli.
Figure 3:
Figure 3:. CTLA4 binding to 80BB enhances HIT T cell anti-tumour function.
a, Human CTLA4-Fc binding assay. T cells were incubated with increasing concentrations of CTLA4-Fc and then stained with PE-anti-Fc. Data are representative of 2 donors. b, Flow cytometry profile of CD80 and CTLA4 surface expression. T cells co-transduced with stable amount of viral supernatant encoding for 80BB and a gradient of viral supernatant encoding for truncated CTLA4 lacking its intracellular domain (ΔCTLA4). Right, MFI of CD80 and CTLA4 surface detection. MFI quantified in right panel. Data are representative of 3 donors. c, Diagram depicting 19-HIT80BB, 19-HIT80BB transduced with ΔCTLA4 (HIT80BB+ΔCTLA4), 19-HIT80ΔBB and HIT80ΔBB+ΔCTLA4. Human IL-2 and IL-13 supernatant concentration 24 h post co-culture with NALM6 target cells at E:T ratio of 1:2. n=3 independent co-cultures of cells from a healthy donor, representative of 3 donors. d, Mitochondrial stress (top) and glycolytic rate (bottom) Seahorse assays were performed after 3 rounds of cell stimulation with NALM6 target cells. n=5 (19-HIT, 19-HIT80BB top panel) or n=4 (all other conditions) independent reactions of cells from a healthy donor, representative of 3 donors. e, Kaplan–Meier survival analysis of NALM6-bearing mice treated with 1×10⁵ 19-HIT80BB or 19-HIT with KO TRBC (control) or KO CTLA4 (n=5 mice/group). P values were determined by two-tailed t-test (c) or log-rank Mantel-Cox test (e). Data are mean ± sem. q values in d were calculated based on two-tailed t-test p-values and adjusted using the two-state step-up method of Benjamini, Krieger and Yekutieli.
Figure 4:
Figure 4:. 80BB enhances TCR-engineered T cell control of subcutaneous melanomas.
a, Left, diagram of NY-ESO-1 TCR-endowed cell expressing 80BB (ESO-TCR80BB). Right, representative flow cytometry plot of CD80 expression on ESO-TCR+ T cells. Data are representative of 10 donors. b, Serial in vitro cytotoxicity assay of ESO-TCR+ T cells co-cultured with fresh NALM6 cells added every 2 days. Each line represents n=5 independent co-cultures of cells from a healthy donor. c,Left, diagram depicting in vivo treatment of SK-MEL-37 (HLA.A2.1+, NY-ESO-1+)-bearing mice with ESO-TCR+ T cells. Right, tumour burden was monitored using bioluminescence imaging (total flux); tumour burden at day 21 post T cell injection is shown. n=4 mice per group. d, Kaplan–Meier survival analysis of mice bearing subcutaneous SK-MEL-37 treated with 1×10⁶ and 0.5×10⁶ ESO-TCR or ESO-TCR80BB (n=5 mice/group). e, Weight of tumours. f, Counts of CD8+ NY-ESO-1 Tetramer+ T cells isolated from tumour (count/mg, left) and spleen (abs. count, right). g,Percentage of CD8+ Tetramer+ T cells staining for Granzyme B, IFNγ, IL-2 and TNFα after 4hrs of PMA/Ionomycin stimulation. h,Expression of PD-1, Lag3, and Tim3 on CD8+ Tetramer+ tumour-isolated T cells. i,Expression of CD28 and CTLA4 on CD8+ NY-ESO-1 Tetramer+ T cells pre-infusion and tumour-isolated T cells. e-i, Samples from mice inoculated with SK-MEL-37 and treated with 2.5×10⁶ ESO-TCR cells or ESO-TCR80BB cells at specified time points. n=4 mice per group per time point. P values were determined by log-rank Mantel-Cox test (d), or two-tailed t-test (c, e, f, h, i). Data are mean ± sem.
Figure 5:
Figure 5:. 80BB endowed TILs exert improved anti-tumour function in vitro and in vivo.
a, Diagram of TIL rapid expansion protocol (REP) and γ-retrovirus transduction with LNGFR (control, TILsLNGFR) or 80BB (TILs80BB). b, Flow cytometry profile (left) and quantification (right) of CellTrace violet labeled TILs 5 days post-stimulation with autologous patient-derived tumour (SK-MEL-956A). n=6 independent co-cultures of cells from 1 patient-derived tumour sample. c, Serial in vitro cytotoxicity assay with fresh SK-MEL-956A cells added every 4 days to the culture. n=6 (TILS80BB, TILsLNGFR) or n=3 (Tumour only) independent co-cultures of cells from 1 patient-derived tumour sample. d, e,Mitochondrial stress (d) and Glycolytic rate (e) Seahorse assays were performed after 3 rounds of cell stimulation with patient-matched target cells. n=8 independent reactions of cells from 1 patient-derived tumour sample. f, Diagram depicting in vivo treatment of SK-MEL-956A-FFluc-bearing mice with 1×10⁷ TILsLNGFR or TILs80BB. g, h, SK-MEL-956A-FFluc-bearing mice treated with 107 TILsLNGFR or TILs80BB (n=5 mice/group for TILsLNGFR and n=4 mice/group for TILs80BB). g, Tumour burden monitored using bioluminescence image (total flux). Tumour burden at days 31 and 87 post T cell injection is shown. h, Kaplan–Meier survival analysis. P values were determined by log-rank Mantel-Cox test (h), or two-tailed t-test (b, d, e, g). Data are mean ± sem.

Similar articles

Cited by

References

    1. June CH & Sadelain M Chimeric Antigen Receptor Therapy. New England Journal of Medicine 379, 64–73 (2018). - PMC - PubMed
    1. Chandran SS & Klebanoff CA T cell receptor-based cancer immunotherapy: Emerging efficacy and pathways of resistance. Immunol Rev 290, 127–147 (2019). - PMC - PubMed
    1. DeRenzo C & Gottschalk S Genetically Modified T-Cell Therapy for Osteosarcoma: Into the Roaring 2020s. Adv Exp Med Biol 1257, 109–131 (2020). - PMC - PubMed
    1. Ecsedi M, McAfee MS & Chapuis AG The Anticancer Potential of T Cell Receptor-Engineered T Cells. Trends Cancer 7, 48–56 (2021). - PMC - PubMed
    1. Foy SP et al. Non-viral precision T cell receptor replacement for personalized cell therapy. Nature (2022). - PMC - PubMed

Methods Only References

    1. Dudley ME, Wunderlich JR, Shelton TE, Even J & Rosenberg SA Generation of tumor-infiltrating lymphocyte cultures for use in adoptive transfer therapy for melanoma patients. J Immunother 26, 332–342 (2003). - PMC - PubMed
    1. Brentjens RJ et al. Genetically targeted T cells eradicate systemic acute lymphoblastic leukemia xenografts. Clin Cancer Res 13, 5426–5435 (2007). - PubMed
    1. Ghani K, Cottin S, de Campos-Lima PO, Caron MC & Caruso M Characterization of an alternative packaging system derived from the cat RD114 retrovirus for gene delivery. J Gene Med 11, 664–669 (2009). - PubMed
    1. Gallardo HF, Tan C, Ory D & Sadelain M Recombinant retroviruses pseudotyped with the vesicular stomatitis virus G glycoprotein mediate both stable gene transfer and pseudotransduction in human peripheral blood lymphocytes. Blood 90, 952–957 (1997). - PubMed
    1. Derré L et al. Distinct sets of alphabeta TCRs confer similar recognition of tumor antigen NY-ESO-1157–165 by interacting with its central Met/Trp residues. Proc Natl Acad Sci U S A 105, 15010–15015 (2008). - PMC - PubMed

MeSH terms