. 2024 Apr;25(4):644-658.
doi: 10.1038/s41590-024-01792-2. Epub 2024 Mar 19.

Human lung cancer harbors spatially organized stem-immunity hubs associated with response to immunotherapy

Affiliations

Human lung cancer harbors spatially organized stem-immunity hubs associated with response to immunotherapy

Jonathan H Chen et al. Nat Immunol. 2024 Apr.

Abstract

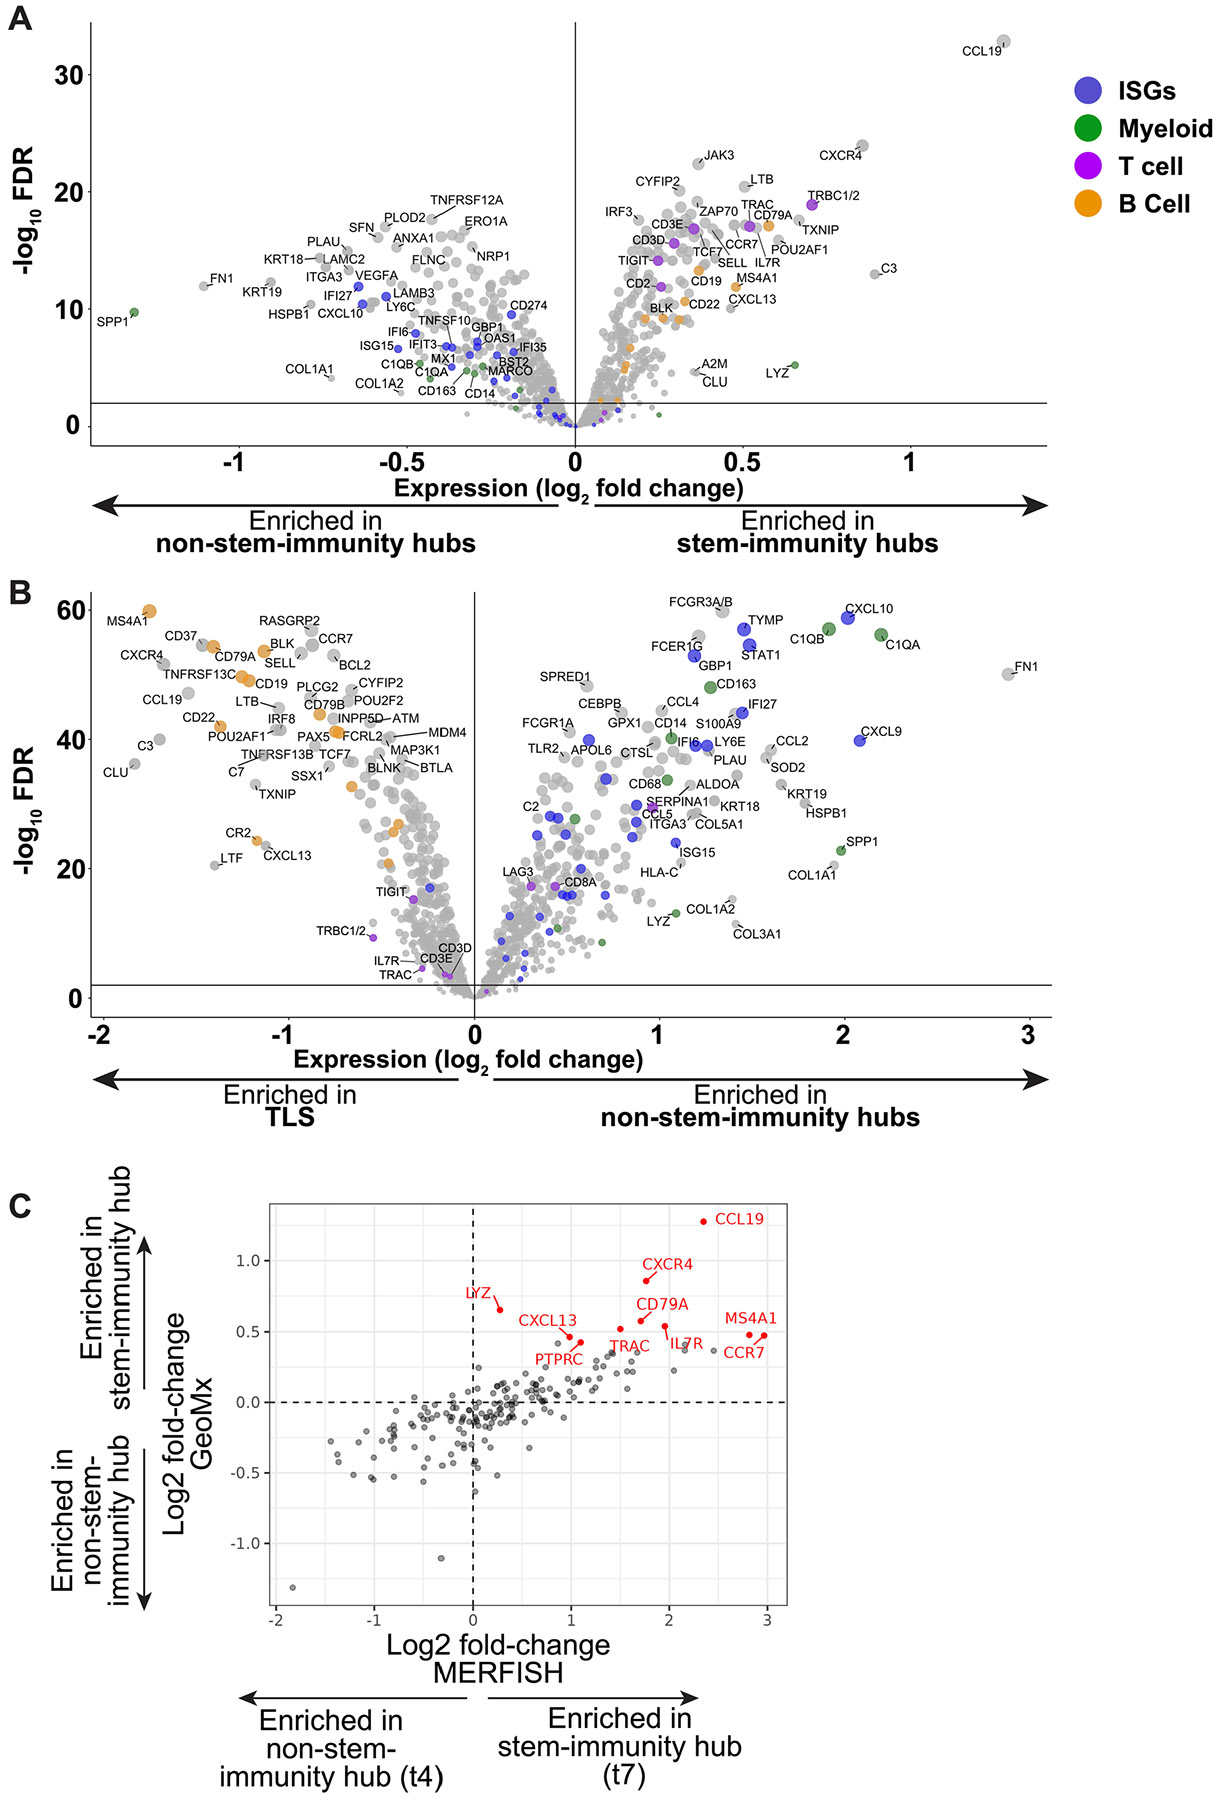
The organization of immune cells in human tumors is not well understood. Immunogenic tumors harbor spatially localized multicellular 'immunity hubs' defined by expression of the T cell-attracting chemokines CXCL10/CXCL11 and abundant T cells. Here, we examined immunity hubs in human pre-immunotherapy lung cancer specimens and found an association with beneficial response to PD-1 blockade. Critically, we discovered the stem-immunity hub, a subtype of immunity hub strongly associated with favorable PD-1-blockade outcome. This hub is distinct from mature tertiary lymphoid structures and is enriched for stem-like TCF7+PD-1+CD8+ T cells, activated CCR7+LAMP3+ dendritic cells and CCL19+ fibroblasts as well as chemokines that organize these cells. Within the stem-immunity hub, we find preferential interactions between CXCL10+ macrophages and TCF7-CD8+ T cells as well as between mature regulatory dendritic cells and TCF7+CD4+ and regulatory T cells. These results provide a picture of the spatial organization of the human intratumoral immune response and its relevance to patient immunotherapy outcomes.


Figures

Extended Data Fig. 1 ∣
Extended Data Fig. 1 ∣. Leiden clustering of immunity hubs.
(a–d) Paired RNA smFISH/IF and IF only stained slides were coregistered for 46 of the patients. PanCK staining is shown in cyan for RNA smFISH/IF and magenta for IF panel images. (e–g) tSNE projection as in Fig. 2a colored by (E) patient ID, (F) patient response status, and (G) immunity hub size. (h) Patient composition within each immunity hub Leiden subcluster. (i) Plot as in (H), but the y-axis depicts the number of subclusters, colored by the patient. Each column is a Leiden subcluster. (j) Frequency of immunity hub subclusters expressed as a fraction of total tumor area for responders and non-responders (NR = 33 and R = 13 patients). Two-sided Mann-Whitney test p-value is shown. (k-l) Kaplan-Meier analysis of progression-free survival (PFS) and overall survival (OS) for each subcluster. Patients were classified as either above or below a threshold of 0.1% of total tumor area for each subcluster. Shown p-values are adjusted for multiple hypothesis testing (7 tests) using the Benjamini-Hochberg method (J-L). (m) Counts of indicated phenotypes within immunity hubs, as in Fig. 2g. Phenotype counts were normalized by immunity hub area and scaled from 0-1. Each point represents the mean value across all immunity hubs of a given Leiden subcluster for each patient having that subcluster (number of patients having subcluster: #1 = 18, #2 = 33, #3 = 31, #4 = 11, #5 = 27, #6 = 25, and #7 = 30). Boxplots are defined as follows: center line = median, box minima and maxima = interquartile range (IRQ), and whiskers = 1.5*IQR. Statistical comparison was performed using an unpaired two-sided Mann-Whitney test relative to subcluster 3. Benjamini-Hochberg adjusted p-values shown: ns = not significant, *p < 0.05, **p < 0.01, ***p < 0.001, and ****p < 0.0001. (n) Fraction of TCF7+PD1+ CD8 T cells found within subcluster 3 in responders versus non-responders. Each dot represents one patient (NR = 33 and R = 13 patients). Two-sided Mann-Whitney test p-value is shown. (o) Counts of contact (at least touching in a cardinal direction) between TCF7+ aggregates and subcluster 3 immunity hubs versus other immunity hub subclusters (subclusters 1-2 and 4-7). Statistical comparison was performed using a two-sided Fisher’s exact test.
Extended Data Fig. 2 ∣
Extended Data Fig. 2 ∣. Representative images for each immunity hub subcluster.
Each row features an immunity hub from a different patient among the 46 patients with successfully coregistered panels. Aligned serial sections are shown for RNA ISH/IF panel (Column A), H&E (Column B), and IF only panel (Columns C-G). (a) IFNG+ cells (circles) are observed in immunity hubs. (b) H&E shows immunity hubs contain immune infiltrate abutting neoplastic cells. (c) Ki67+CD8+ (circles) and Ki67+TCF7+CD8+ cells (arrows) are found. (d) Ki67+TCF7+CD8+ (arrows), TCF7+CD8+ (circles), and TCF7+PD1+CD8+ cells (arrowheads) are found. (e) PD1+CD8+ (circles) and TCF7+PD1+CD8+ cells (arrowheads) are found. (f) Composite image showing indicated channels. (g) PD-L1+ cells are found.
Extended Data Fig. 3 ∣
Extended Data Fig. 3 ∣. Cell-based clustering identifies many immune cell types in MERFISH data.
(a) Histogram of transcripts per cell by patient. (b) UMAP of MERFISH data from Fig. 3b, colored by patient. (c) Cell counts by coarse cell type for each patient. (d) UMAP of immune cell MERFISH data from Fig. 3b, colored by patient. (e) Cell counts for fine immune clustering for each patient. (f) Heatmap including both coarse and fine cell clusters versus expression of key marker genes.
Extended Data Fig. 4 ∣
Extended Data Fig. 4 ∣. Cell-based analysis of MERFISH data reveals cell populations enriched within the stem-immunity hubs.
(a) The tile grid consisted of regular hexagons with area = 2500 μm2. To improve smoothness in tile clustering, hexagonal tiles were dilated with a 15 μm buffer. (b) Transcripts per non-dilated 2500 μm2 tile by patient. (c) Spatial map of tumor for four MERFISH samples, with tiles colored by four region types. (d) Mean number of cells per tile per aggregate for indicated clusters. Each dot represents one patient, colored by patient number. The open gray circle represents the mean cell per tile count for all aggregates of the indicated tile type across patients. (e) Forest plots depict the log2 odds ratio of the abundance (normalized to physical area) of a cell type in the indicated region type versus abundance in library-matched tumor areas. Error bars denote the 95% confidence interval (n = 4 patients, as in (D)) and center dot denotes point estimate.
Extended Data Fig. 5 ∣
Extended Data Fig. 5 ∣. Co-localization of cells.
(a) Neighboring cell analysis for cells within stem-immunity hubs, as in Fig. 5. For each plot, indicated cluster position (row) is held constant and enrichment with partner (column) is quantified versus scrambled distribution. Mean z-scores across all four samples are shown. Two-tailed p-values were calculated from the mean z-scores and FDRs computed with the Benjamini-Hochberg procedure across all p-values. FDR < 0.05 are denoted with an asterisk. Total number of indicated index cells is shown at right, based on Supplementary Table 1,h. (b) Absolute frequency of interactions (mean of the mean frequencies across the four samples) for a given index cell (row) and partner cell type (column). (c) The red line on histograms shows how frequently specific T cell types are observed to neighbor the indicated myeloid cell type within the stem-immunity hubs for indicated patients. Gray bars denote random distribution (expected distribution based on cell type frequency).
Extended Data Fig. 6 ∣
Extended Data Fig. 6 ∣. Gene signatures of T cells neighboring mreg DCs and CXCL10+ macrophages.
Heatmap of gene expression of CD4 T cells, CD8 T cells, and Tregs, subdivided into three groups reflecting their neighborhood composition: adjacent to at least one LAMP3+CCL19+ mreg DC, adjacent to at least one CXCL10+ macrophage, or adjacent to neither. T cells adjacent to both were rare and thus not included in this analysis. Only genes significantly differentially overexpressed (GLMM adj. p < 0.05 & logFC > 0.5, see Methods) in one of the rows are shown.
Extended Data Fig. 7 ∣
Extended Data Fig. 7 ∣. Cell-cell interactions within stem-immunity hubs.
Neighboring cell analysis for cells within stem-immunity hubs based on 12-plex RNAscope data. For each plot, indicated cluster position (row) is held constant and enrichment with partner (column) is quantified versus scrambled distribution. Z-scores were calculated from the mean and standard deviation of the permutation-based empirical null distribution. Mean z-scores across all four samples are shown. Two-tailed p-values were calculated from the mean z-scores and FDRs computed with the Benjamini-Hochberg procedure across all p-values. FDR < 0.05 are denoted with an asterisk.
Extended Data Fig. 8 ∣
Extended Data Fig. 8 ∣. TCF7+ regions feature CCL19, CCL22, and variable MS4A1, and frequently overlap with immunity hub subcluster 3.
(a–c) Six cases (R = 4, NR = 2) from the 68 patient cohort with TCF7+ aggregates (smFISH/IF panel staining shown in B) were stained by H&E (C) and an additional panel for CCL19, CCL22, MS4A1, CXCL10/11, and PanCK. Dashed ovals indicate areas with CXCL10/11+ cells. Arrows point to CCL22+ cells.
Extended Data Fig. 9 ∣
Extended Data Fig. 9 ∣. Representative NanoString GeoMx regions of interest.
(a) Fluorescently labeled RNA smFISH probes for CXCL10 and CCL19 on GeoMx slides guided region of interest (ROI) selection for transcriptional profiling. Histological features, region location, and number of regions profiled are noted. (b) Representative GeoMx images of stem-immunity (SI) hub, non-stemimmunity hub, and TLS ROI (as defined in (A)) for all five patients profiled using Nanostring GeoMx. White lines indicate ROI boundaries. ROI ID number for a given patient is indicated in the top left corner of each image.
Extended Data Fig. 10 ∣
Extended Data Fig. 10 ∣. Transcriptional profile of stem-immunity hubs, non-stem-immunity hubs, and TLS using GeoMx.
(a, b) Comparison of (A) stem-immunity hub and non-stem-immunity hub and (B) non-stem-immunity hub and TLS gene expression using GeoMx CTA assay. Volcano plots depict pooled ROIs across all 5 samples. Each dot represents one gene. Dot coloring is as follows: blue - ISGs, green - myeloid genes, purple - T cell genes, and orange - B cell genes. (c) Scatter plot of expression for 177 genes included in both GeoMx and MERFISH panels for manually annotated stem-immunity hubs (GeoMx) and tile cluster-defined stem-immunity hubs (t7, MERFISH) (pearson correlation r = 0.78, p < 1E-35). Axes indicate log2 fold-change of gene expression in stem-immunity versus non-stem-immunity hub. Each dot denotes one gene. Red dots denote the top 10 over-expressed genes in stem-immunity (versus non-stem-immunity hub) in the GeoMx dataset.
Fig. 1 ∣
Fig. 1 ∣. Immunity hubs in tumors are associated with positive clinical responses in patients with NSCLC.
a, Serial sections of pre-PD-1-blockade formalin-fixed paraffin-embedded (FFPE) NSCLC samples were stained with two multiplex fluorescence panels for 68 patients (20 responders and 48 non-responders; created with BioRender.com). Panel 1 uses RNA smFISH/IF to identify immunity hub components and panel 2 solely uses immunofluorescence (IF) to determine CD8+ T cell states. Whole-slide images were captured and analyzed by automated cell segmentation and phenotyping. b, Representative low-power image of one of the 68 tumors (patient no. 43) stained with the multiplexed RNA smFISH/IF panel. c, High-power view from the boxed region in b showing an immunity hub. Cells positive for IFNG are circled in white. d, High-power view of a hematoxylin and eosin (H&E)-stained serial section from an area matched to that in c. e, Representative image of a tumor section (patient no. 43) stained with the multiplexed RNA-ISH/IF panel shows the focal expression pattern of CXCL10/CXCL11 (red). f, A grid of 50 × 50-μm windows was overlaid on images. CXCL10/CXCL11+ windows (red) were identified using k-means clustering based on CXCL10/CXCL11+ cell count (k = 2). g, Adjacent CXCL10/CXCL11+ windows were aggregated into immunity hubs. Singleton windows were not included as hubs. h, Immunity hub area as a fraction of total tumor area in responders (R; complete response and partial response; n = 20) versus non-responders (NR; stable disease and progressive disease; n = 48). Two-sided Mann–Whitney test P value is shown. i, Paired comparisons of density of cellular phenotypes from the RNA-ISH/IF panel within immunity hubs versus total assessed area, colored by response status (n = 59; 1 R and 8 NR tumors lacked immunity hubs). j, Paired comparisons of density of cellular phenotypes from the IF-only panel within immunity hubs versus total assessed area, colored by response status (n = 43; 22 samples had images that could not be co-registered, and 3 samples lacked immunity hubs). Each pair of dots connected by a colored line represents a patient. Horizontal black lines denote the median and 95% confidence interval. Two-sided Wilcoxon matched-pairs signed-rank test Benjamini–Hochberg (BH)-adjusted P values are shown.
Fig. 2 ∣
Fig. 2 ∣. A class of immunity hubs with IFNG+ cells and TCF7+PD-1+CD8+ T cells.
a, Leiden analysis of immunity hubs reveals seven subclusters. Each point on the t-SNE plot represents one immunity hub. b, Leiden subcluster composition by patient, plotted by the proportion of tumor area in each subcluster. Hash symbols denote two patients classified by RECIST as non-responders based on progression in the central nervous system but showed systemic immunotherapy response (Results). c, Mean rank difference and associated BH-adjusted P values calculated for each Leiden subcluster by comparing responders versus non-responders. Values are derived from two-sided Mann–Whitney tests (Extended Data Fig. 1j). d, Immunity hub subcluster 3 is enriched in responders. The proportion of tumor area in subcluster 3 is shown for each patient (NR = 33 and R = 13 patients). Hash symbols denote the two aforementioned patients. BH-adjusted, two-sided Mann–Whitney test, P = 0.00004. e,f, Immunity hub subcluster 3 is associated with increased PFS (e) and OS (f) by Kaplan–Meier analysis (two-sided log-rank test, BH-adjusted P P P values). Patients were classified as above or below a threshold of 0.1% of total tumor area for subcluster 3. Units of time are in days. BH-adjusted P values are shown. g, Immunity hub composition by subcluster for indicated phenotypes. Phenotype counts were normalized by immunity hub area and scaled from 0 to 1. Each point represents the mean value across all immunity hubs of a given Leiden subcluster for each patient having that subcluster (number of patients having subcluster: 1 = 18, 2 = 33, 3 = 31, 4 = 11, 5 = 27, 6 = 25, and 7 = 30). In the box plots, the center line indicates the median, box minima and maxima represent the interquartile range, and whiskers are 1.5 times the interquartile range. Statistical comparison was performed using an unpaired two-sided Mann–Whitney test relative to subcluster 3. BH-adjusted P values shown: NS, not significant; *P < 0.05, **P < 0.01, ***P < 0.001, and ****P < 0.0001. h, 0–1 scaled phenotype counts, as in g and Extended Data Fig. 1m, but for each of the 2,712 hubs (columns). i, Spatial map of tissue from a responder (patient no. 28) showing immunity hubs color coded by Leiden subclusters (left). A region containing three subcluster 3 immunity hubs is indicated by a box in the spatial map. Images (center and right) from the same boxed inset region are shown with the indicated markers. White scale bar denotes 100 μm. j, Spatial map (from patient no. 53) showing TCF7+ aggregates identified by k-means clustering (k = 2) based on PanCKTCF7+ cell count. k, TCF7+ aggregate area (as a fraction of total area) plotted by response status. Statistical comparisons were performed using a two-tailed unpaired Mann–Whitney test (NR = 33 and R = 13 patients). l, Spatial map of tissue from the patient in j showing immunity hubs color coded by Leiden subcluster. m, Frequency of contact (at least touching in a cardinal direction) between TCF7+ aggregates and subcluster 3 immunity hubs versus other immunity hub subclusters (subclusters 1–2 and 4–7). Statistical comparison was performed using two-sided Fisher’s exact test on counts shown in Extended Data Fig. 1o.
Fig. 3 ∣
Fig. 3 ∣. MERFISH spatial analysis of gene expression in immunity hubs.
a, Schematic of MERFISH analysis. Tissue was manually annotated to include tumor areas, but exclude non-neoplastic areas, necrotic regions and tissue folds. Two non-mutually exclusive approaches were taken for analysis, assigning transcripts to: segmented cells (top) and tiles within a regular grid (bottom). Clustering analysis was performed for both tiles and cells. Furthermore, every cell could be uniquely assigned to one tile. b, Uniform manifold approximation and projection (UMAP) of coarse cell-type clusters (top) and finely clustered immune cells (bottom) from MERFISH data. Each dot represents one cell. For finely clustered immune cells, clusters are as follows: 1. LAMP3+CCL19+ mreg DC; 2. LAMP3+CD1C+ DC; 3. FLT3+ DC; 4. CD1C+ITGAX+ DC; 5. FCN1+LYZ+ myeloid; 6. CXCL10+ macrophage; 7. MARCO+ macrophage; 8. FOLR2+CD14+ macrophage; 9. MERTK+ macrophage; 10. MMP1+SOX4+ myeloid; 11. PLA2G7+CCL18+ macrophage; 12. SPP1+ macrophage; 13. NCAM1+100B+SEPP1+ myeloid; 14. B cells; 15. TCF7+CD4+ T cells; 16. TCF7+PD-1CD8+ T cells; 17. Treg; 18. CXCL13+CD4+ T cells; 19. TCF7CD8+ T cells; 20. CXCL13+CD8+ T cells; 21. Innate-like/γδ T cells; 22. Natural killer (NK); 23. TCF7CD4+ T cells; 24. TCF7+PD-1+CD8+ T cells. c, UMAP showing Louvain clustering of tiles. d, List of differentially expressed genes and manual annotation of tile cluster identity. e, Heat map of tile clusters with differentially expressed genes. f–h, Scatterplots of logFC for abundance of TCF7+CD8+ T cells (defined as the combination of TCF7+PD-1+ and TCF7+PD-1CD8+ T cell clusters) (f), TCF7+PD-1+CD8+ T cells (g) or CCL19 expression (h) versus CXCL9/CXCL10/CXCL11 expression for indicated tiles versus all other tiles. Tile cluster error bars colored red indicate significant enrichment (defined as FDR < 20% and logFC > 0) for CXCL9/CXCL10/CXCL11 (horizontal) or CCL19 (vertical). i, Expression of indicated genes for marker genes (left), chemokines (center) and other secreted factors (right) in indicated tile cluster groupings (as defined in d).
Fig. 4 ∣
Fig. 4 ∣. MERFISH spatial analysis of lymphocyte and myeloid populations in immunity hubs.
a, log2 odds ratio (OR) enrichment of the abundance of indicated cell populations within hubs: stem-immunity versus tumor (x axis) or non-stem-immunity versus tumor (y axis) hubs. Indicated populations are significantly enriched (FDR < 20%, logOR > 0) in non-stem-immunity hub (teal), stem-immunity hub (blue) or both hub types (orange). b, Frequency of indicated cell types within stem-immunity and tumor tile neighborhoods. Each column represents the indicated patient. c, Representative mappings of stem-immunity hubs showing indicated cell types. d, Representative images of an area within a stem-immunity hub from the three samples stained with the 12-plex RNAscope panel. Left, CCL19 and CXCL10 expression in an area manually annotated as a stem-immunity hub using CD8A, TCF7 and CXCL10. Scale bar, 20 μm. Middle, mreg DCs were identified using CCR7 and IDO1 coexpression (white arrows). Right, Treg cells were identified using CD3E, FOXP3 and CD4 coexpression (white dashed circles), and were frequently directly adjacent to mreg DCs (white arrows). Similar images were observed for 76,284 cells in replicates from three donors. e, Densities of indicated cell types within the entire tumor area versus only within the stem-immunity hub for the three patient samples (patient nos. 43, 38 and 73) that were stained and analyzed in Halo. Two-sided paired t-test was performed. Nominal P values are shown. f, Expression of indicated genes by cell type within stem-immunity hubs.
Fig. 5 ∣
Fig. 5 ∣. Cell–cell interactions within stem-immunity hubs.
Neighboring cell analysis for cells within stem-immunity hubs. For each plot, the indicated cluster position (row) is held constant and enrichment with partner (column) is quantified versus scrambled distribution. Mean z-scores across all four samples are shown. Two-tailed P values were calculated from the mean z-scores and FDRs computed with the BH procedure across all P values. FDR < 0.05 are denoted with an asterisk. The total number of indicated index cells is shown on the right, based on Supplementary Table 1h.
Fig. 6 ∣
Fig. 6 ∣. Non-random cell–cell interactions across tile neighborhood types.
Ligand–receptor analysis for myeloid cells (express ligands) and the indicated T cell types (express receptors). Colored boxes shown are the row-normalized COMMOT scores in stem-immunity hubs for significantly associated ligand–receptor interactions (permutation-based, one-sided, nominal P value < 0.05, gray boxes have nominal P value ≥ 0.05).
Fig. 7 ∣
Fig. 7 ∣. Stem-immunity hubs contain CCL19+ fibroblasts.
a, UMAP of harmonized and co-embedded scRNA-seq and MERFISH stromal cells from human lung cancer. b,c, Clustering of high-quality, labeled MERFISH stromal cells presented as a UMAP (b) and a heat map (c) with differentially expressed genes. d, UMAP feature plot showing CCL19 expression within the stromal population. e, Number of CCL19+ fibroblasts per 2,500-μm2 tile in the indicated region types. Each dot represents the mean count per tile for the indicated patient sample. Open gray circle indicates the mean value. f, Neighboring cell analysis for cells within stem-immunity hubs, as in Fig. 5. g, Ligand–receptor analysis as in Fig. 6, but here presented for stromal cells (express ligands) and CD4+ T cells (express receptors). h, Graphical schematic of the stem-immunity hub. EC, endothelial cell.
Fig. 8 ∣
Fig. 8 ∣. Expression of T cell and macrophage transcripts in stem-immunity hubs and TLSs.
a, Co-registered image of immunity hub subcluster 3 (from region in patient no. 53 denoted by box in Fig. 2j,l). Dashed ovals indicate areas with CXCL10/CXCL11+ cells. b, H&E-stained serial section from the area matched to that in a. c, Multiplexed RNA-ISH/IF image of serial section from area matched to that in a. Double arrowheads indicate CCL19+ cells. Arrows indicate CCL22+ cells. Images for the other five patient samples stained here are shown in Extended Data Fig. 8. d, Comparison of stem-immunity hub and TLS (as defined in Extended Data Fig. 9a) gene expression using GeoMx CTA assay. The volcano plot depicts pooled ROIs across all five samples. Each dot represents one gene. Dot coloring is as follows: blue, ISGs; green, myeloid genes; purple, T cell genes; orange, B cell genes.

Update of

References

    1. Le DT et al. PD-1 blockade in tumors with mismatch-repair deficiency. N. Engl. J. Med 372, 2509–2520 (2015). - PMC - PubMed
    1. Pelka K et al. Spatially organized multicellular immune hubs in human colorectal cancer. Cell 184, 4734–4752 (2021). - PMC - PubMed
    1. Mihm MC Jr. & Mulé JJ Reflections on the histopathology of tumor-infiltrating lymphocytes in melanoma and the host immune response. Cancer Immunol. Res 3, 827–835 (2015). - PMC - PubMed
    1. Angell HK, Bruni D, Barrett JC, Herbst R & Galon J The immunoscore: colon cancer and beyond. Clin. Cancer Res 26, 332–339 (2020). - PubMed
    1. Thommen DS et al. A transcriptionally and functionally distinct PD-1+ CD8+ T cell pool with predictive potential in non-small-cell lung cancer treated with PD-1 blockade. Nat. Med 24, 994–1004 (2018). - PMC - PubMed

Substances