. 2024 Apr;9(4):922-937.
doi: 10.1038/s41564-024-01628-7. Epub 2024 Mar 19.

Prevotella copri and microbiota members mediate the beneficial effects of a therapeutic food for malnutrition

Affiliations

Prevotella copri and microbiota members mediate the beneficial effects of a therapeutic food for malnutrition

Hao-Wei Chang et al. Nat Microbiol. 2024 Apr.

Abstract

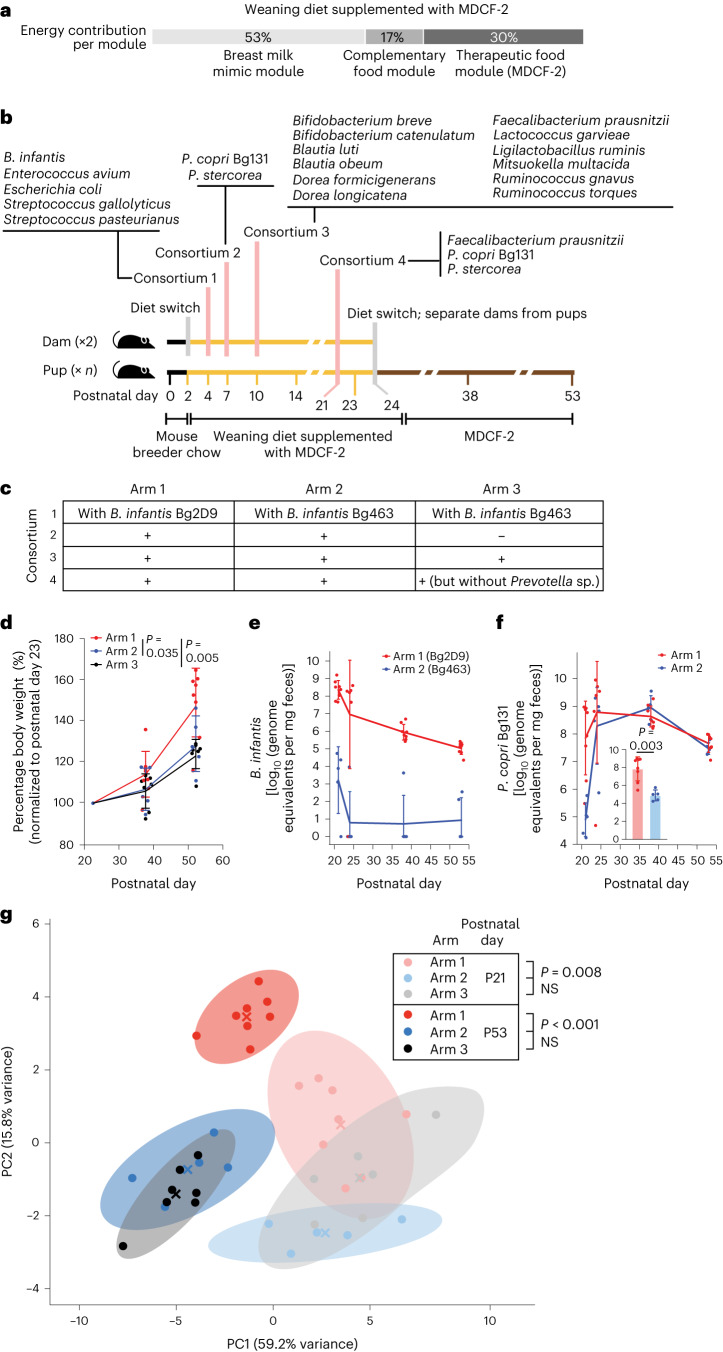
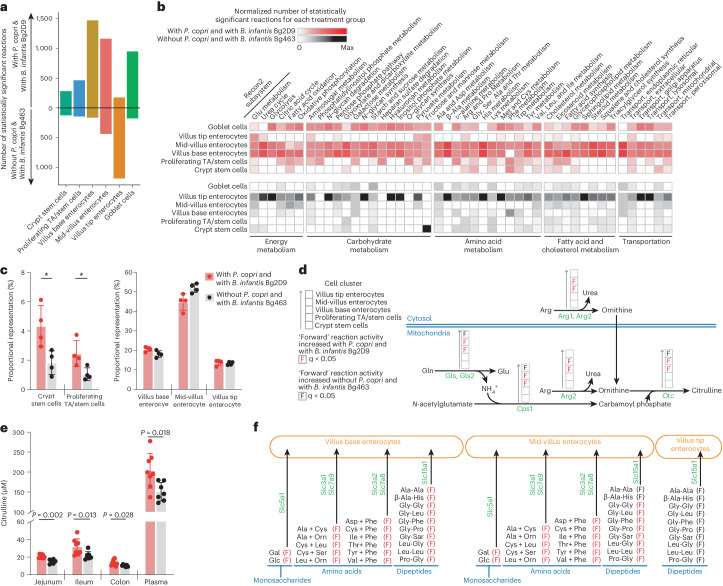
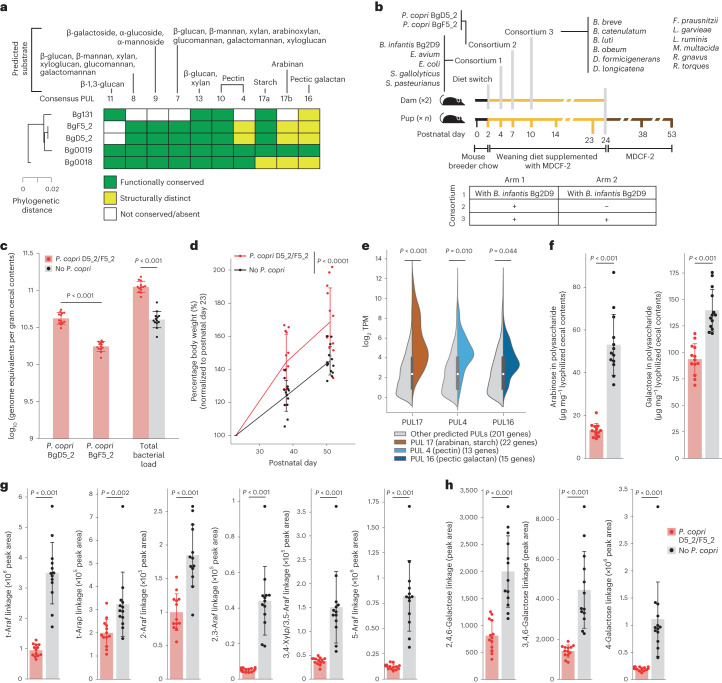
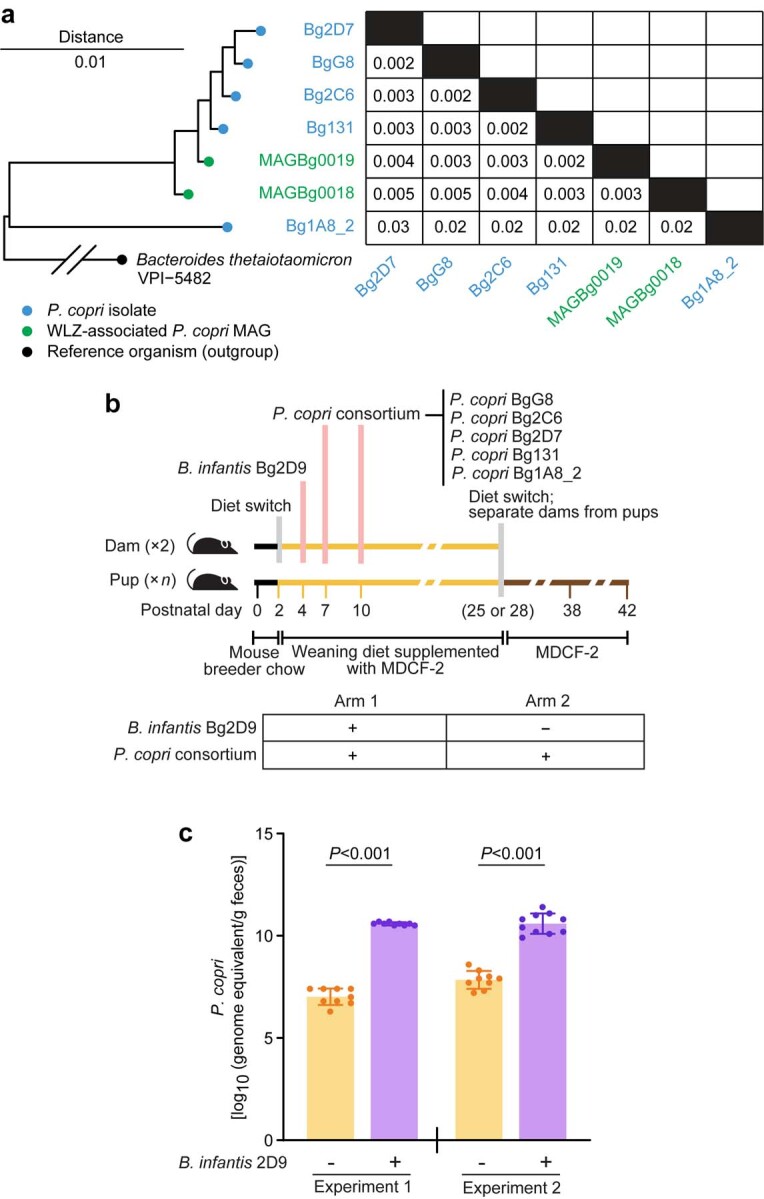
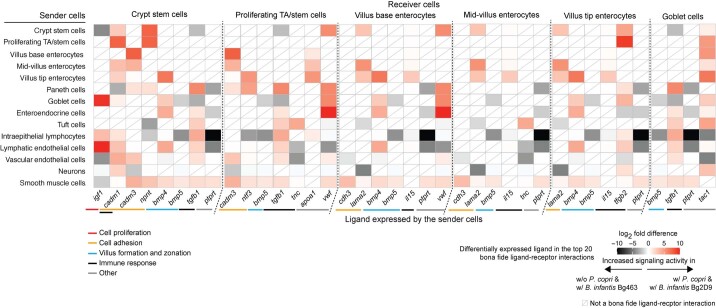
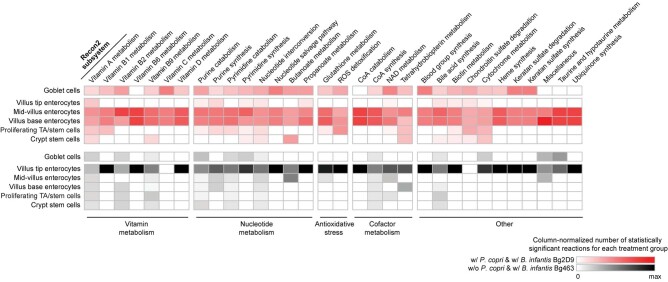
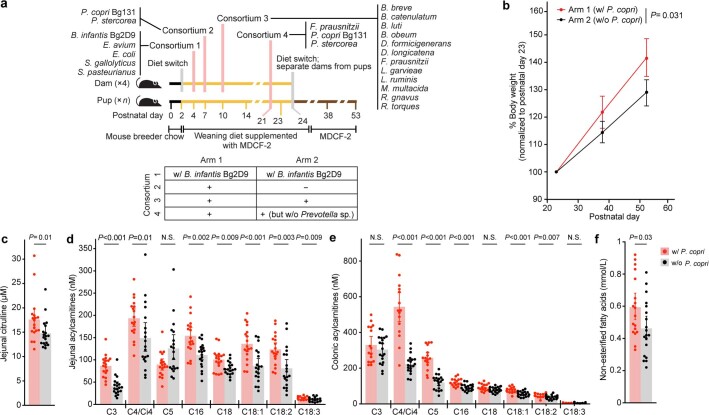
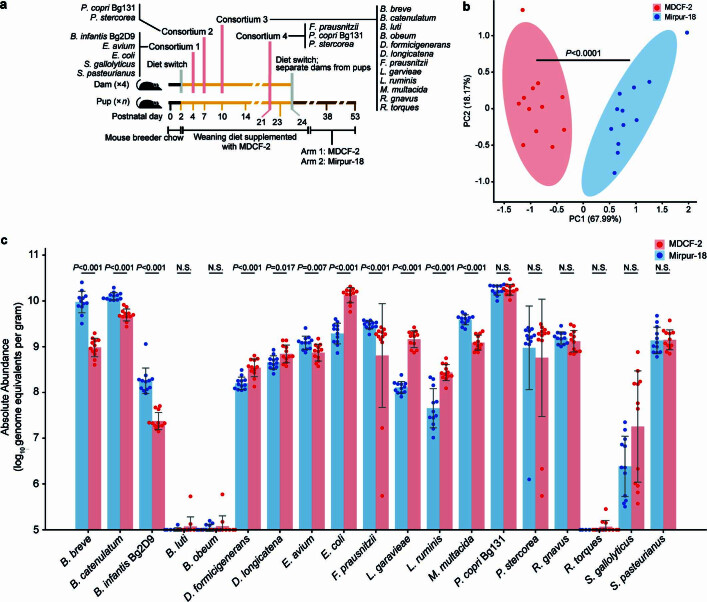
Microbiota-directed complementary food (MDCF) formulations have been designed to repair the gut communities of malnourished children. A randomized controlled trial demonstrated that one formulation, MDCF-2, improved weight gain in malnourished Bangladeshi children compared to a more calorically dense standard nutritional intervention. Metagenome-assembled genomes from study participants revealed a correlation between ponderal growth and expression of MDCF-2 glycan utilization pathways by Prevotella copri strains. To test this correlation, here we use gnotobiotic mice colonized with defined consortia of age- and ponderal growth-associated gut bacterial strains, with or without P. copri isolates closely matching the metagenome-assembled genomes. Combining gut metagenomics and metatranscriptomics with host single-nucleus RNA sequencing and gut metabolomic analyses, we identify a key role of P. copri in metabolizing MDCF-2 glycans and uncover its interactions with other microbes including Bifidobacterium infantis. P. copri-containing consortia mediated weight gain and modulated energy metabolism within intestinal epithelial cells. Our results reveal structure-function relationships between MDCF-2 and members of the gut microbiota of malnourished children with potential implications for future therapies.


Conflict of interest statement

A.L.O. and D.A.R. are co-founders of Phenobiome, a company pursuing development of computational tools for predictive phenotype profiling of microbial communities. C.B.L is a co-founder of Infinant Health, interVenn Bio and one.bio, companies involved in the characterization of glycans and developing carbohydrate applications for human health. The remaining authors of this paper declare no competing interests.

Figures

Fig. 1
Fig. 1. Identifying factors that affect the efficiency of colonization of gnotobiotic dam–pup dyads with P. copri in the presence of other cultured age-discriminatory and WLZ-associated bacterial strains and the effects of colonization on pup weight gain.
a, Energy contribution from different modules of the ‘weaning diet supplemented with MDCF-2’. b,c, Study design (n = 2 dams and 8, 5 and 7 offspring for arms 1, 2 and 3, respectively). b, The timing of bacterial colonization of dams and diet switches. c, The gavages administered to members of each treatment arm. d, Body weights of the offspring of dams, normalized to P23. e, Absolute abundance of B. infantis Bg2D9 (arm 1) and B. infantis Bg463 (arm 2) in faecal samples obtained from pups. f, Absolute abundance of P. copri in faecal samples collected from pups in the indicated treatment arms at the indicated postnatal time points. Inset: the absolute abundance of P. copri in faecal samples collected from pups at P21. g, Principal components analysis of absolute abundances of other community members in faecal samples obtained from pups at P21 and P53. Mean values ± s.d. are shown in d–f. Each dot in d–f represents an individual animal. P values were calculated using a linear mixed-effects model (d, Methods), a two-sided Mann–Whitney U test (f, inset) or PERMANOVA (g). Centroids are denoted by a coloured ‘X’. Shaded ellipses represent the 95% confidence interval of the sample distribution. Each dot represents an individual animal. Data generated from all of the offspring were used in the analyses shown in dg.
Fig. 2
Fig. 2. snRNA-seq analysis and targeted mass spectrometric analysis of intestinal tissue and plasma collected from mice containing bacterial communities with or without P. copri and two different strains of B. infantis.
Jejunal tissue samples collected from arm 1 (with P. copri and with B. infantis Bg2D9) and arm 3 (without P. copri and with B. infantis Bg463) at the end of the experiment (P53) described in Fig. 1a were analysed (n = 4 samples/treatment arm for ad and f). a, The number of Recon2 reactions with statistically significant differences in their predicted flux between mice in Arm 1 and Arm 3. TA, transit amplifying. b, The number of Recon2 reactions in each Recon2 subsystem that are predicted to have statistically significant differences in their activities between the two treatment groups. Colours denote values normalized to the sum of all statistically significantly different Recon2 reactions found in all selected cell clusters for a given Recon2 subsystem in each treatment group. c, Proportional representation of cell clusters identified by snRNA-seq. Asterisks denote ‘statistically credible differences’ as defined by scCODA (Supplementary Table 10c and Methods). Mean values ± s.d. are shown. d, Selected Recon2 reactions in enterocyte clusters distributed along the villus involved in the urea cycle and glutamine metabolism. e, Targeted mass spectrometric quantifications of citrulline levels along the length of the gut and in plasma. Mean values ± s.d. and P values from the two-sided Mann–Whitney U test are shown. Each dot represents an individual animal (n = 8 and 7 for arms 1 and 3, respectively). f, Effect of colonization with bacterial consortia containing or lacking P. copri on extracellular transporters for monosaccharides, amino acids and dipeptides. Ala, alanine; Arg, arginine; Asp, aspartate; Cys, cysteine; Gal, galactose; Glc, glucose; Gln, glutamine; Glu, glutamate; Gly, glycine; His, histidine; Ile, isoleucine; Leu, leucine; Lys, lysine; Met, methionine; Orn, ornithine; Phe, phenylalanine; Pro, proline; Sar, sarcosine; Ser, serine; Thr, threonine; Trp, tryptophan; Tyr, tyrosine; Val, valine. These transporters were selected, and the spatial information of their expressed region along the length of the villus was assigned based on published experimental evidence. Arrows in d and f indicate the ‘forward’ direction of each Recon2 reaction. The Wilcoxon rank-sum test was used to evaluate the statistical significance of the net reaction scores (a, b, d and e) between the two treatment groups. P values were calculated from Wilcoxon rank-sum tests and adjusted for multiple comparisons (Benjamini–Hochberg method); q < 0.05 was used as the cut-off for statistical significance.
Fig. 3
Fig. 3. Testing the effects of pre-weaning colonization with two P. copri strains closely related to MAGs Bg0018 and Bg0019 on host weight gain and MDCF-2 glycan degradation.
a, Comparison of PULs highly conserved in the two P. copri MAGs with their representation in the three cultured P. copri strains. b, Study design (n = 2 dams and 13 offspring per treatment arm). c, Absolute abundance of P. copri strains and total bacterial load in caecal contents collected at the end of the experiment (P53). Exact P values for comparisons of BgD5_2 and BgF5_2 and total bacterial load are 2 × 10−5 and 2 × 105, respectively. d, Body weights of the offspring of dams, normalized to P23. The P value for the group difference is P = 4 × 105 (linear mixed effects model (Methods)). e, GSEA of expression of PULs shared by P. copri BgD5_2 and BgF5_2 in the caecal contents of animals. Benjamini–Hochberg adjusted P values were calculated using GSEA ranking genes by their mean log2 TPM across the P. copri colonized samples, with each PUL comprising a gene set against the background of all predicted PUL genes. Violin plots show the log2 TPM of all genes assigned to any of the 22 predicted PULs in each isolate (n = 201 genes) in each of the samples, split to show homologues of consensus PUL 17 (arabinan, starch; n = 22 genes), PUL 4 (pectin; n = 13 genes) and PUL 16 (pectic galactan; n = 15 genes) in colour compared to the remainder of all PUL genes in grey. Internal box plots show the median (circle) and quartiles (box boundaries) for all genes assigned to PULs. P = 1 × 10−4 for PUL 17. f, UHPLC-QqQ-MS analysis of total arabinose and galactose in glycans present in caecal contents collected at P53. The P value for both arabinose and galactose is 2 × 10−5. g,h, UHPLC-QqQ-MS of glycosidic linkages containing arabinose (g) and galactose (h) in caecal contents. The exact P values for t-Araf, 2-Araf, 2,3-Araf, 3,4-Xylp/3,5-Araf and 5-Araf (g) are 2 × 10−5, 8 × 10−5, 2 × 10−5, 2 × 10−5 and 2 × 10−5, respectively. The exact P values for 2,4,6-galactose, 3,4,6-galactose and 4-galactose are 3 × 10−5, 2 × 10−5 and 2 × 10−5, respectively. Mean values ± s.d. are shown. P values were calculated using a two-sided Mann–Whitney U test (c,fh). Each dot in bh represents an individual animal.
Extended Data Fig. 1
Extended Data Fig. 1. Determining the relationship between P. copri colonization efficiency and pre-colonization with B. longum subsp. infantis.
(a) Phylogenetic tree of cultured P. copri isolates used in the mouse studies described and the two MAGs positively associated with WLZ in the randomized controlled human study. The phylogenetic distance between each pair of comparisons is shown in the matrix. (b) Experimental design (n = 9 offspring per group in experiment 1 and n = 10 offspring per group in experiment 2). Mice were weaned at P28 and P25 for experiments 1 and 2, respectively. (c) Total absolute abundances of P. copri strains in fecal samples collected from mice at P42. Mean values ± SD are shown. Each dot represents a separate animal. P-values were calculated using a two-sided Mann-Whitney U test and are 4x10⁻⁴ and 3x10⁻⁴ for experiments 1 and 2, respectively.
Extended Data Fig. 2
Extended Data Fig. 2. Absolute abundances of other bacterial species in the defined community across different time points and locations.
(a) Absolute abundances of organisms which were significantly higher with either B. infantis Bg2D9 (Arm 1 vs. Arm 2), or with the combination of B. infantis Bg2D9 and Prevotella (Arm 1 vs. Arm 3) in fecal samples collected at P53 (n = 8, 5, and 7 offspring for arms 1, 2, and 3, respectively). The adjusted P-values for B. obeum (Arm 1 vs. Arm 3) and D. longicatena (Arm 1 vs. Arm 2) are 2x10⁻⁴ and 7x10⁻⁴, respectively. (b, c) Absolute abundances of the same organisms in cecal contents collected at P53 (panel b) and in fecal samples collected before weaning at P21 (panel c). Mean values ± SD are shown. Each dot represents an individual animal. P-values were calculated by the Kruskal-Wallis test followed by post-hoc Dunn’s test with Bonferroni correction. N.S., not significant (P > 0.05).
Extended Data Fig. 3
Extended Data Fig. 3. Targeted mass spectrometric and microbial RNA-Seq analyses of consortia of cultured age-discriminatory and WLZ-associated bacteria strains that colonized gnotobiotic mice.
Cecal contents collected at the end of the experiment described in Fig. 1a were analyzed. (a,b) UHPLC-QqQ-MS-based quantitation of levels of total arabinose (panel a) and arabinose-containing glycosidic linkages (panel b) in cecal glycans collected at P53. Abbreviations: Araf, arabinofuranose; Arap, arabinopyranose; Xylp, xylopyranose. Each dot represents an individual animal (n = 8, 5, and 7 offspring for arms 1, 2, and 3, respectively). Mean values ± s.d. are shown. P values were calculated by the Kruskal-Wallis test followed by post-hoc Dunn’s test with Bonferroni correction for panels a and b. (c) PCA of profiles of normalized meta-transcriptomic counts (see Methods). Centroids are denoted by a colored ‘X’ for each group. P-values were calculated by PERMANOVA. (d) MTXmodel abundance-normalized differential expression analysis of genes involved in specific carbohydrate utilization and amino acid biosynthetic pathways in the four arabinose-utilizing bacteria. Violin plots show the distribution of log2 fold-differences for all expressed genes with metabolic pathway annotations in the indicated organism. Dots in panel d represent differential expression test results for individual genes involved in the corresponding pathway and are coloured if their Benjamini-Hochberg adjusted P-value is less than 0.1 (see Methods). Abbreviations: BCAA, branched-chain amino acid; Glu, glutamate; Gln, glutamine.
Extended Data Fig. 4
Extended Data Fig. 4. Expression of P. copri and P. stercorea PULs and targeted mass spectrometric analysis of their predicted targets.
(a,b) GSEA of expression of PULs shared by P. copri Bg131 (panel a) and P. stercorea (panel b) in the two Prevotella-containing arms of the experiment described in Fig. 1 (n = 8 and 5 offspring for arms 1 and 2 respectively). Benjamini-Hochberg adjusted P-values were calculated using GSEA ranking genes by their mean log2 TPM across the Prevotella-colonized samples in Arms 1 and 2, with each PUL comprising a gene set against the background of all predicted PUL genes. Violin plots show the log2 TPM of all genes assigned to any of the PULs in each isolate; plots are split to show the indicated PUL. The exact adjusted P-value for PUL27a in Arm 2 (panel a) is 3x10⁻⁴. (c) UHPLC-QqQ-MS-based quantitation of levels of total mannose, N-acetylglucosamine, and N-acetylgalactosamine in cecal glycans collected at P53 (n = 8, 5, and 7 offspring for arms 1, 2, and 3 respectively). Mean values ± SD are shown. Each dot represents an individual animal. P-values were calculated by the Kruskal-Wallis test followed by post-hoc Dunn’s test with Bonferroni correction.
Extended Data Fig. 5
Extended Data Fig. 5. snRNA-Seq analysis of differential intestinal gene expression in mice colonized with bacterial consortia with or without P. copri.
Jejunal tissue samples collected from ‘w/ P. copri & w/ B. infantis Bg2D9’ and ‘w/o P. copri & w/ B. infantis Bg463’ groups at the end of the experiment described in Fig. 1 were analyzed. (a) Dot plot of marker gene expression across epithelial cell types. The average expression level and percentage of nuclei that express a given gene within a cell type are indicated by dot color and size, respectively. (b) Integrated UMAP plot for all jejunal nuclei isolated from animals in both arms (n = 4 mice/arm). (c) The number and directionality of statistically significant differentially expressed genes in each cell cluster.
Extended Data Fig. 6
Extended Data Fig. 6. NicheNet-based analysis of the effects of P. copri colonization on cell-cell signaling activities.
Each row represents different sender cell clusters. Each column represents ligands expressed by these sender cells. Cells are colored based on the log2-fold difference in expression of ligands in the sender cell clusters between mice in ‘w/ P. copri & w/ B. infantis Bg2D9’ and ‘w/o P. copri & w/ B. infantis Bg463’ groups from the experiment described in Fig. 1. Ligands (columns) are grouped based on receiver cell clusters and the indicated functions of downstream signaling pathways in these receiver cells.
Extended Data Fig. 7
Extended Data Fig. 7. Normalized number of Recon2 reactions in Recon2 subsystems predicted to have statistically significant differences in their activities between mice in the ‘w/ P. copri & w/ B. infantis Bg2D9’ and ‘w/o P. copri & w/ B. infantis Bg463’ groups.
See legend to Fig. 2b, which shows other affected subsystems, for details.
Extended Data Fig. 8
Extended Data Fig. 8. Validating the effects of P. copri colonization on postnatal weight gain and host metabolism in gnotobiotic dam-pup dyads.
(a) Study design (n = 4 dams and 18 and 19 offspring for arms 1 and 2, respectively). (b) Body weights of the offspring of dams, normalized to postnatal day 23 [linear mixed effects model (see Methods)]. (c-e) Targeted mass spectrometric analysis of jejunal citrulline (panel c) and acylcarnitine levels (panel d), plus colonic acylcarnitine levels (panel e). Exact P-values for jejunal C3 and jejunal C18:1 (panel d) are 1x10⁻⁵ and 7x10⁻⁴, respectively. Exact P-values for colonic C4/Ci4, C5, C16, and C18:1 (panel e) are 3x10⁻⁶, 2x10⁻⁶, 3x10⁻⁴, and 7x10⁻⁴, respectively. (f) Plasma levels of non-esterified fatty acids. Each dot represents a single animal. Mean values ± SD are shown for panels b-f. P-values were calculated from the linear mixed effect model (panel b) or two-sided Mann-Whitney U test (panels c-f). N.S., P-value > 0.05.
Extended Data Fig. 9
Extended Data Fig. 9. Evaluating the effect of diet on the defined community in gnotobiotic dam-pup dyads.
(a) Experimental design (n = 2 dams and 12 offspring/diet treatment). (b) Principal component analysis showing the significant differences in community structure in the cecums of mice euthanized on P53 (P = 1x10⁻⁵; PERMANOVA). Ellipses represent 95% confidence intervals. (c) Absolute abundances of the defined community members in cecal contents at P53. Exact P-values for B. breve, B. catenulatum, B. infantis Bg2D9, D. formicigenerans, E. coli, F. prausnitzii, L. garavieae, L. ruminis, and M. multacida are 4×10⁻⁵, 4×10⁻⁵, 4×10⁻⁵, 6×10⁻⁴, 4×10⁻⁵, 2×10⁻⁴, 4×10⁻⁵, 1×10⁻⁴, and 4×10⁻⁵, respectively. P-values were calculated by PERMANOVA (panel b) and a two-sided Mann-Whitney U test (panel c). N.S., P-value > 0.05. Mean values ± SD are shown. Each dot represents an individual animal.
Extended Data Fig. 10
Extended Data Fig. 10. LC-MS of ileal and colonic acylcarnitines in gnotobiotic mice colonized with P. copri BgD5_2 and BgF5_2.
(a) LC-MS of ileal acylcarnitines corresponding to soybean oil lipids. (b) LC-MS of colonic acylcarnitines corresponding to soybean oil lipids. Each dot represents an individual animal (n = 13 animals in each group). Mean values ± SD are shown. P-values were calculated using a two-sided Mann-Whitney U test for panel a and b.

Update of

References

    1. Bäckhed F, et al. Dynamics and stabilization of the human gut microbiome during the first year of life. Cell Host Microbe. 2015;17:690–703. doi: 10.1016/j.chom.2015.04.004. - DOI - PubMed
    1. Stewart CJ, et al. Temporal development of the gut microbiome in early childhood from the TEDDY study. Nature. 2018;562:583–588. doi: 10.1038/s41586-018-0617-x. - DOI - PMC - PubMed
    1. Yatsunenko T, et al. Human gut microbiome viewed across age and geography. Nature. 2012;486:222–227. doi: 10.1038/nature11053. - DOI - PMC - PubMed
    1. Subramanian S, et al. Persistent gut microbiota immaturity in malnourished Bangladeshi children. Nature. 2014;510:417–421. doi: 10.1038/nature13421. - DOI - PMC - PubMed
    1. Blanton LV, et al. Gut bacteria that prevent growth impairments transmitted by microbiota from malnourished children. Science. 2016;351:aad3311. doi: 10.1126/science.aad3311. - DOI - PMC - PubMed

Publication types

Supplementary concepts