Clinical Trial
. 2024 Apr;30(4):1023-1034.
doi: 10.1038/s41591-024-02877-z. Epub 2024 Mar 19.

Neoadjuvant nivolumab or nivolumab plus LAG-3 inhibitor relatlimab in resectable esophageal/gastroesophageal junction cancer: a phase Ib trial and ctDNA analyses

Affiliations
Clinical Trial

Neoadjuvant nivolumab or nivolumab plus LAG-3 inhibitor relatlimab in resectable esophageal/gastroesophageal junction cancer: a phase Ib trial and ctDNA analyses

Ronan J Kelly et al. Nat Med. 2024 Apr.

Abstract

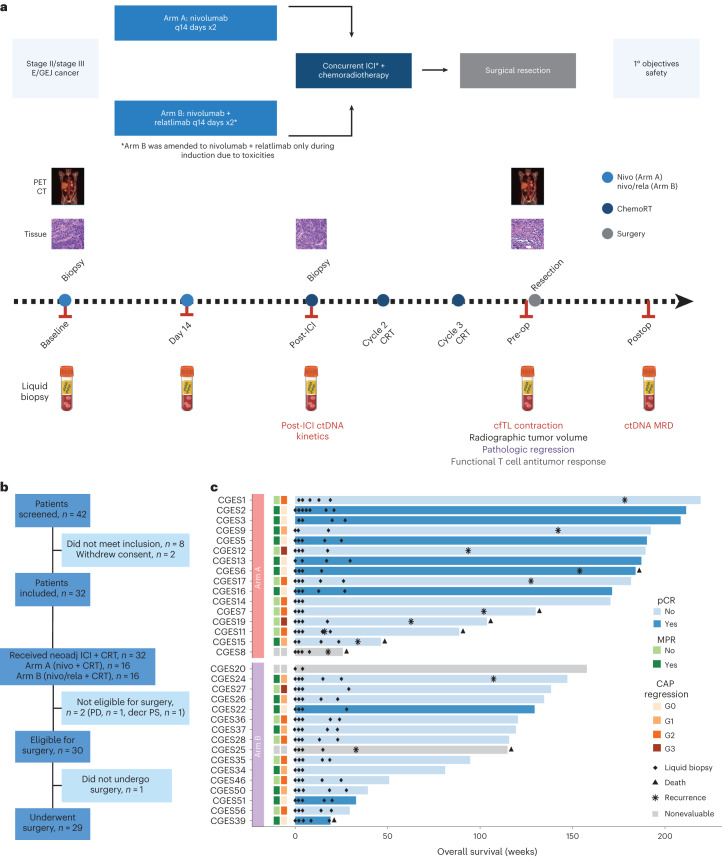
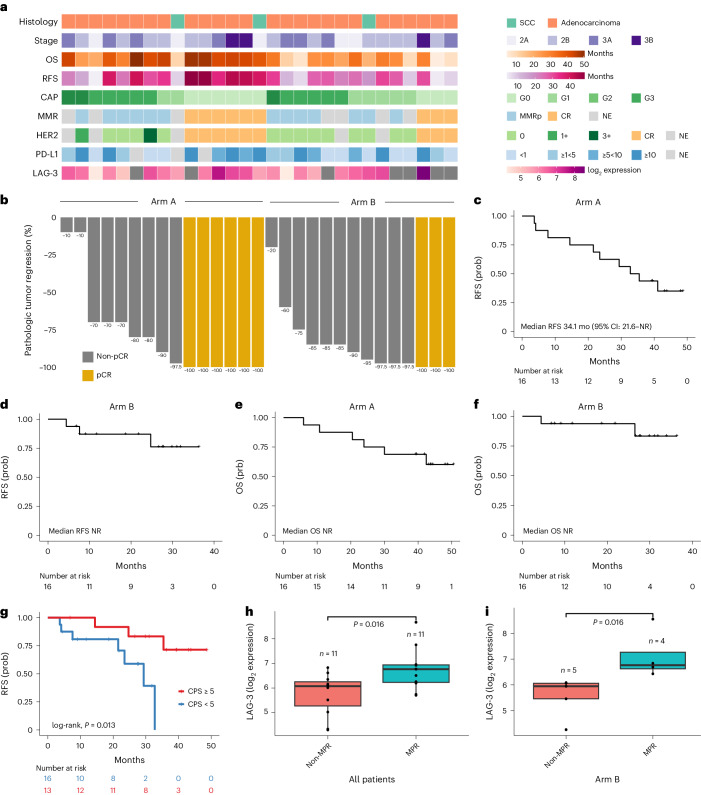
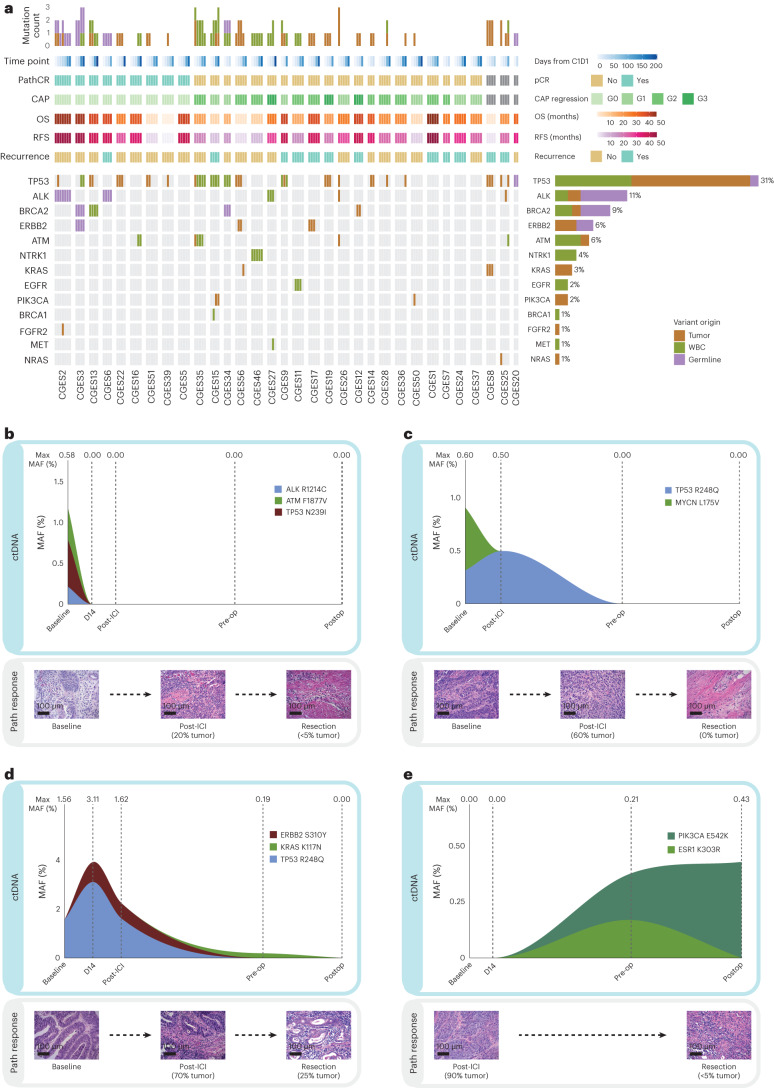
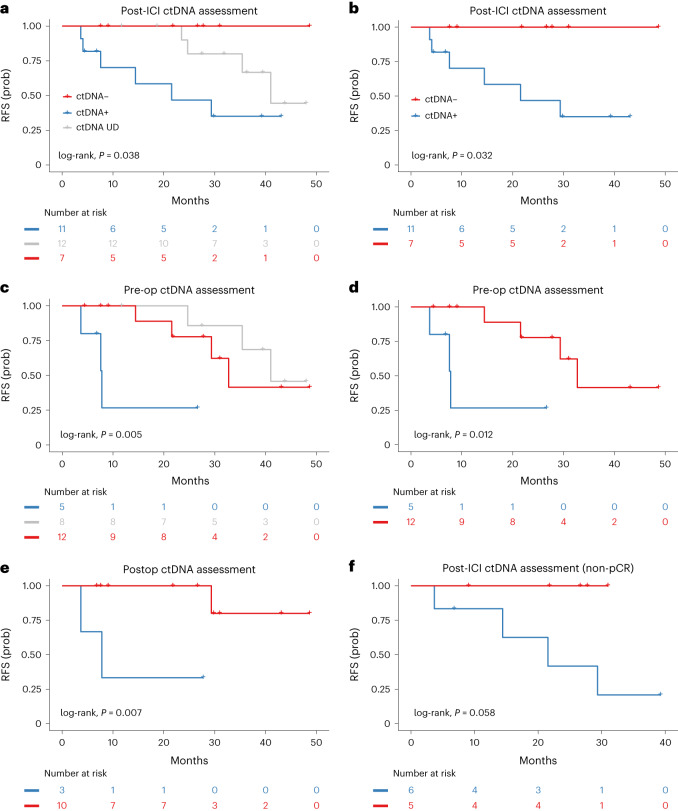
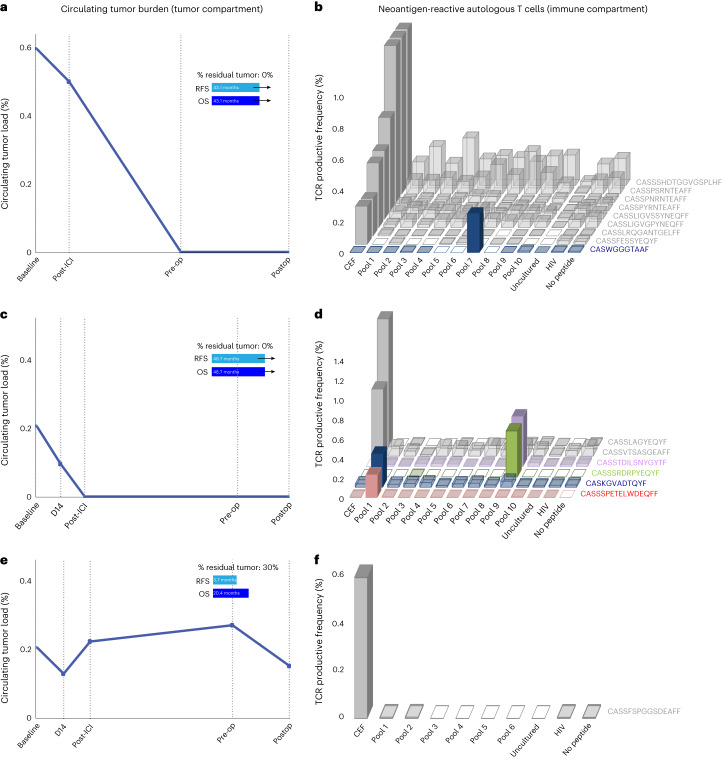
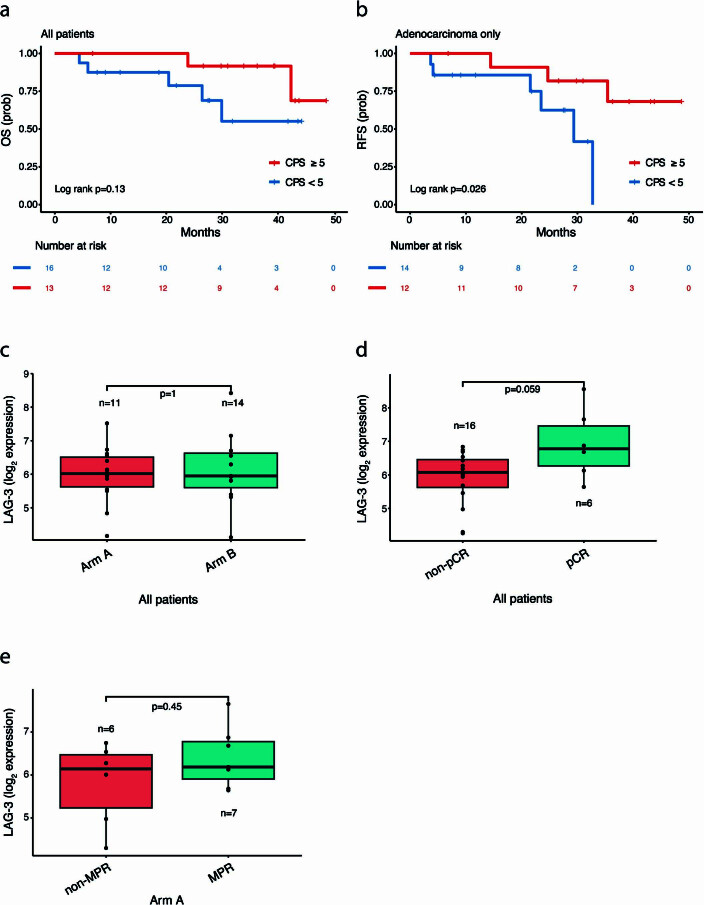
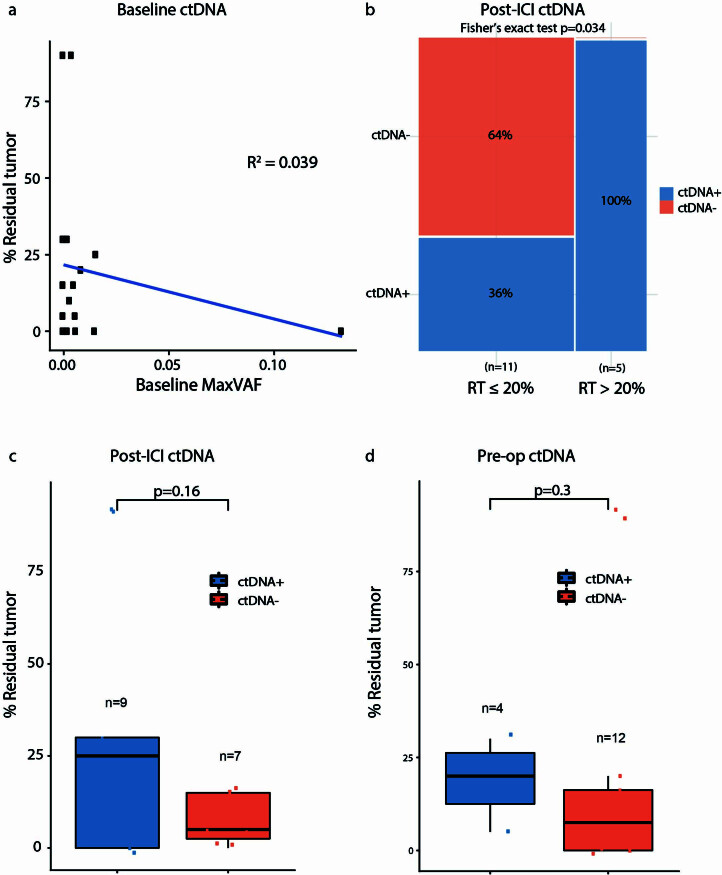
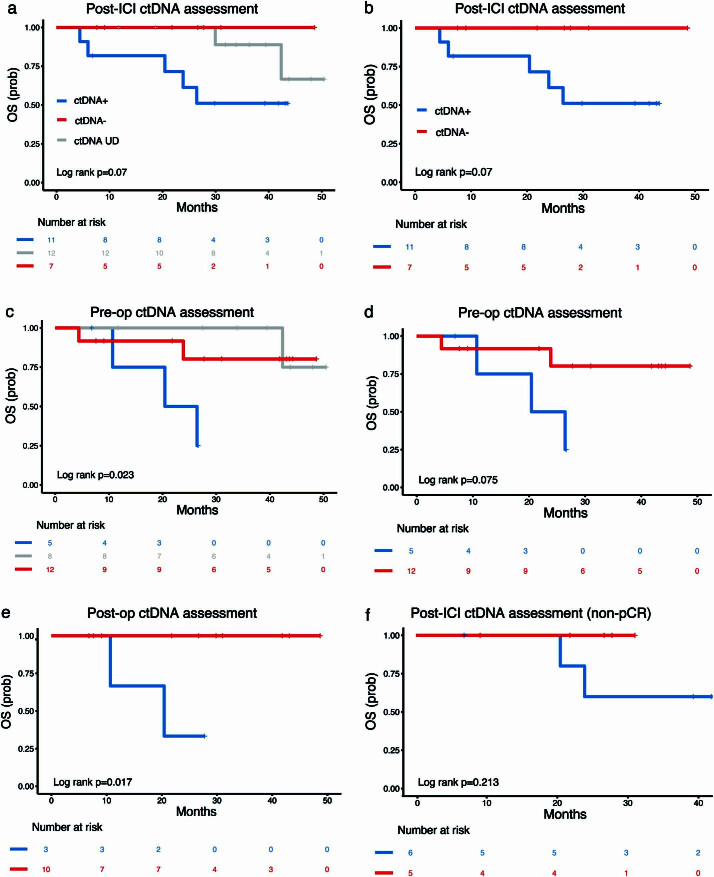
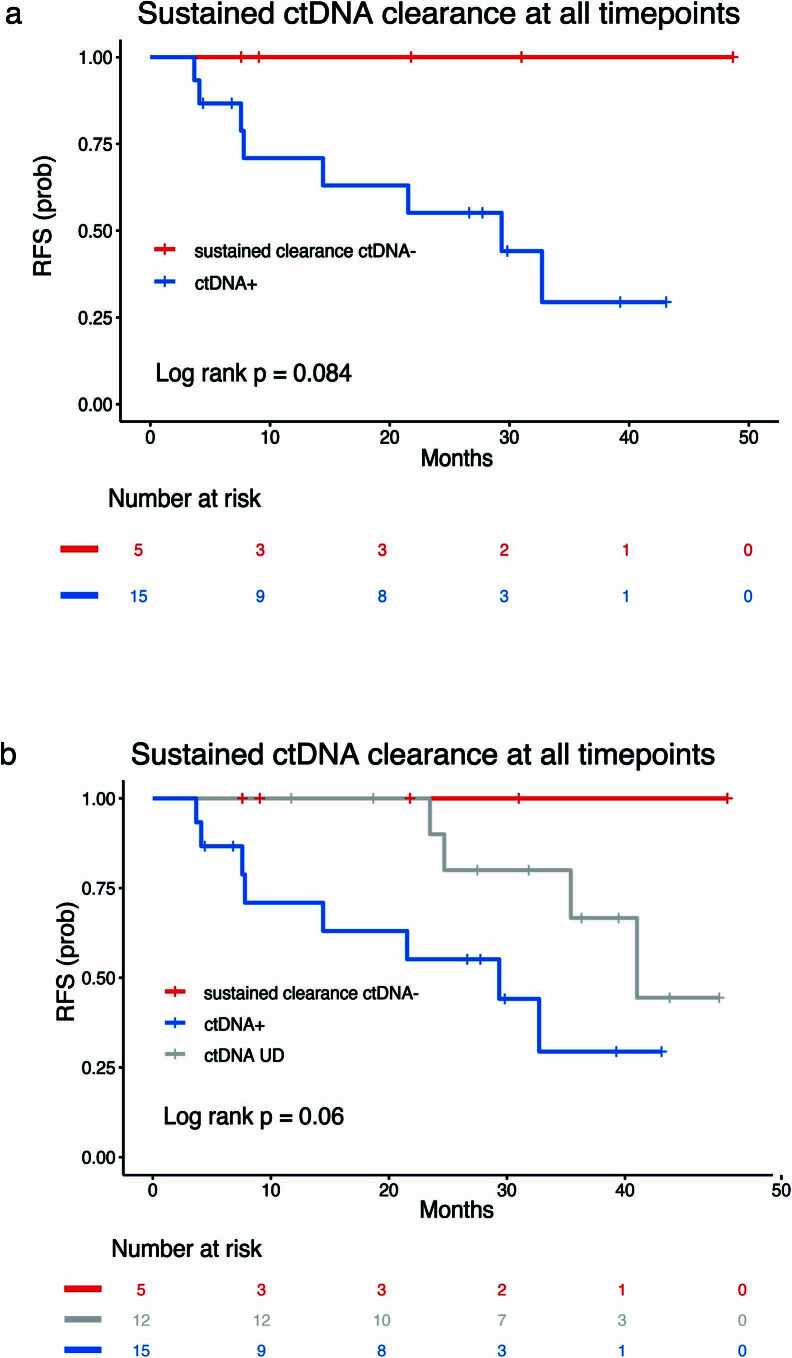
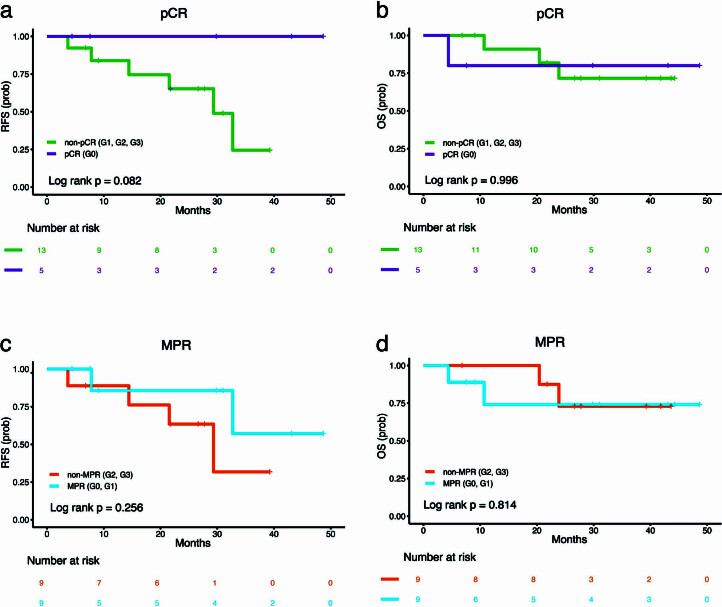
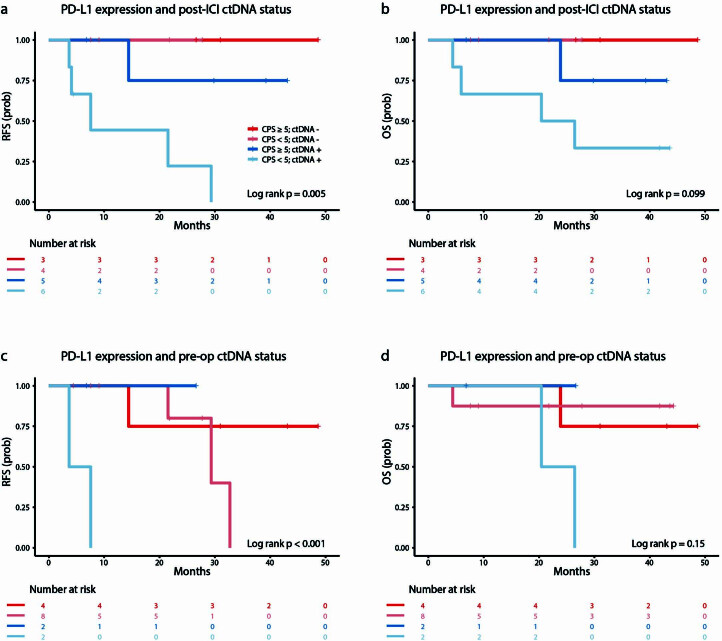
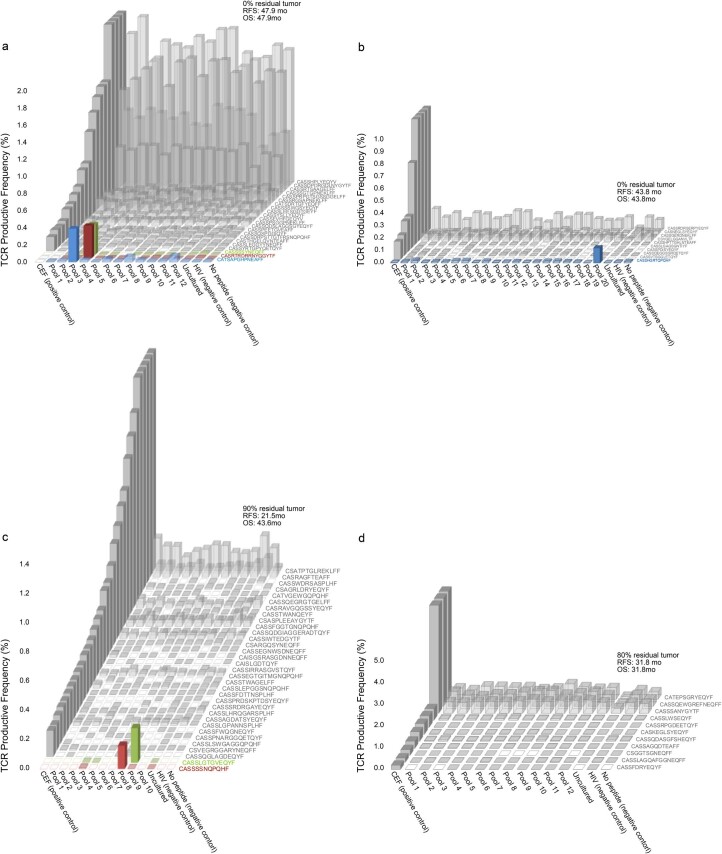
Gastroesophageal cancer dynamics and drivers of clinical responses with immune checkpoint inhibitors (ICI) remain poorly understood. Potential synergistic activity of dual programmed cell death protein 1 (PD-1) and lymphocyte-activation gene 3 (LAG-3) inhibition may help improve immunotherapy responses for these tumors. We report a phase Ib trial that evaluated neoadjuvant nivolumab (Arm A, n = 16) or nivolumab-relatlimab (Arm B, n = 16) in combination with chemoradiotherapy in 32 patients with resectable stage II/stage III gastroesophageal cancer together with an in-depth evaluation of pathological, molecular and functional immune responses. Primary endpoint was safety; the secondary endpoint was feasibility; exploratory endpoints included pathological complete (pCR) and major pathological response (MPR), recurrence-free survival (RFS) and overall survival (OS). The study met its primary safety endpoint in Arm A, although Arm B required modification to mitigate toxicity. pCR and MPR rates were 40% and 53.5% for Arm A and 21.4% and 57.1% for Arm B. Most common adverse events were fatigue, nausea, thrombocytopenia and dermatitis. Overall, 2-year RFS and OS rates were 72.5% and 82.6%, respectively. Higher baseline programmed cell death ligand 1 (PD-L1) and LAG-3 expression were associated with deeper pathological responses. Exploratory analyses of circulating tumor DNA (ctDNA) showed that patients with undetectable ctDNA post-ICI induction, preoperatively and postoperatively had a significantly longer RFS and OS; ctDNA clearance was reflective of neoantigen-specific T cell responses. Our findings provide insights into the safety profile of combined PD-1 and LAG-3 blockade in gastroesophageal cancer and highlight the potential of ctDNA analysis to dynamically assess systemic tumor burden during neoadjuvant ICI that may open a therapeutic window for future intervention. ClinicalTrials.gov registration: NCT03044613 .


Conflict of interest statement

R.J.K. reports receiving advisory board/consulting fees from Astellas, AstraZeneca, Bristol Myers Squibb, Daiichi Sankyo, Eisai, Eli Lilly, EMD Serono, Exact Sciences, Grail, Ipsen, Merck, Novartis, Novocure, Phillips, Takeda, Toray and grant support paid to Johns Hopkins University and Baylor University Medical Center from Bristol Myers Squibb and Eli Lilly. E.J.S. is a consultant for Boston Scientific. A.H.Z. has served in a consultant/advisory role for Previse, has received research funding from Eli Lilly, Prognomiq, BilliontoOne, Genece Health and Tempus and has equity interest in Previse, Tg Therapeutics and Gritstone Bio. K.A.M. is a consultant for AstraZeneca, Amgen, Puma Biotechnology, Jannsen, Mirati Therapeutics, Daiichi Sankyo/Lilly and Regeneron and receives research funding from Mirati, Bristol Myers Squibb and AstraZeneca. K.N.S. has received honoraria from Illumina and Adaptive Biotechnologies, research funding to Johns Hopkins University from Bristol Myers Squibb, AstraZeneca and Abbvie, is an inventor on a patent application related to the MANAFEST technology described herein (16/341,862) that has been licensed to one or more entities and owns founder’s equity in ManaT Bio. J.L.F. has served in a consultant/advisory role for Genentech, Eli Lilly, AstraZeneca, Merck, Takeda, Coherus, Regeneron and Pfizer and has received research funding (directly to the institution) from AstraZeneca, Pfizer and Bristol Myers Squibb. V.L. has served in a consultant/advisory role for Anheart Therapeutics, Takeda, Seattle Genetics, Bristol Myers Squibb, AstraZeneca and Guardant Health and has received research funding from GlaxoSmithKline, Bristol Myers Squibb, AstraZeneca, Merck and Seattle Genetics. V.A. receives research funding to Johns Hopkins University from AstraZeneca and Personal Genome Diagnostics, has received research funding to Johns Hopkins University from Bristol Myers Squibb and Delfi Diagnostics in the past 5 years, is an advisory board member for AstraZeneca and Neogenomics and receives honoraria from Foundation Medicine and Personal Genome Diagnostics. V.A. is an inventor on patent applications (63/276,525, 17/779,936, 16/312,152, 16/341,862, 17/047,006 and 17/598,690) submitted by Johns Hopkins University related to cancer genomic analyses, ctDNA therapeutic response monitoring and immunogenomic features of response to immunotherapy that has been licensed to one or more entities. Under the terms of these license agreements, the University and inventors are entitled to fees and royalty distributions. The other authors declare no competing interests.

Figures

Fig. 1
Fig. 1. Clinical trial schema, CONSORT flow diagram and patient characteristics.
a, Patients with resectable clinical stage II/stage III distal E/GEJ adenocarcinoma or SCC were consecutively enrolled in the following two treatment cohorts: nivolumab every 2 weeks for two induction cycles then three additional doses given concurrently with chemoradiation (Arm A) or nivolumab and relatlimab every 2 weeks according to the same schedule (Arm B). Patients were enrolled in Arm B after safety and feasibility objectives were met in Arm A. The primary endpoint of the trial was safety; the secondary endpoint was feasibility; exploratory endpoints included OS, RFS, MPR and pCR rates and biomarker analyses. Baseline CT and PET/CT scans were obtained before the first dose of neoadjuvant treatment, and PET/CT was obtained after completion of neoadjuvant treatment (presurgery). Tumor samples were collected at baseline, after two cycles of induction immunotherapy, and at the time of surgery. Serial blood samples were collected at baseline, start of cycle 2, start of cycle 3, before surgery and within 3–12 weeks after surgery. b, CONSORT flow diagram depicting patient disposition as follows: of the 42 patients screened, 8 did not meet inclusion criteria and 2 withdrew consent. The remaining 32 patients were enrolled in the study; 2 patients were not eligible for surgery (1 patient because of disease progression—PD—and 1 patient because of declining performance status related to CRT). Of the 30 patients eligible for surgery, 1 patient elected not to undergo surgery and the remaining 29 patients underwent Ivor Lewis esophagectomy. c, Swimmer’s plot depicting pCR, MPR, CAP tumor regression, recurrence, death and OS, together with blood collection for liquid biopsy analyses for each patient. Patients are grouped by trial arm and ordered by OS within each arm. The bar color indicates pCR. CONSORT, Consolidated Standards of Reporting Trials; ICI, immune checkpoint inhibitors; neoadj, neoadjuvant; PD, progressive disease; cfTL, cell-free tumor load.
Fig. 2
Fig. 2. Clinical outcomes, pathological response and biomarker expression.
a, Select clinical and pathological features for each patient that underwent resection after neoadjuvant nivolumab + CRT (Arm A; n = 15) and nivolumab + relatlimab + CRT (Arm B; n = 14). b, Waterfall plot of pathological tumor regression (computed as % viable tumor − 100%) for each patient. c, Kaplan–Meier curve of probability of RFS in all patients treated in Arm A (n = 16). d, Kaplan–Meier curve of probability of RFS in all patients treated in Arm B (n = 16). e, Kaplan–Meier curve of the probability of OS in all patients treated in Arm A (n = 16). f, Kaplan–Meier curve of the probability of OS in all patients treated in Arm B (n = 16). g, Kaplan–Meier curve of probability of RFS in patients based on baseline tumor PD-L1 CPS; patients with a CPS ≥5 at baseline (n = 16) had a longer RFS compared to patients with a CPS <5 (n = 13; median RFS not reached versus 29.34 months for CPS ≥5 and <5, respectively; log-rank, P = 0.013). h, Patients who attained an MPR (n = 11) had a higher LAG-3 expression at baseline compared to patients with a non-MPR (n = 11; median LAG-3 expression 6.68 versus 6.01, respectively, two-sided Wilcoxon rank-sum test, P = 0.016). i, These findings were driven by Arm B, as patients who attained an MPR (n = 4) had a higher baseline LAG-3 expression (median LAG-3 expression 6.77 versus 5.95, respectively, two-sided Wilcoxon rank-sum test, P = 0.016). All box plots depict the median value, with the lower and upper hinge corresponding to the first and third quartiles, respectively. The upper whisker extends from the upper hinge to at most 1.5× interquartile range and the lower whisker extends from the lower hinge to at most 1.5× interquartile range. MMRp, mismatch repair proficiency. Prob, probability.
Fig. 3
Fig. 3. Landscape of ctDNA genomic alterations and ctDNA dynamics in patients with differential tumor regression and long-term outcomes with neoadjuvant immune checkpoint inhibition.
a, The origin of each variant is shown along with its detection across time points. Genes displayed on the left are ones that fall within the overlapping regions of interest of the two targeted NGS gene panels used (Methods). Alteration prevalence for each gene is listed on the right. The mutation count per sample is displayed at the top followed by rows indicating sample time point, pCR, CAP regression grading, OS, RFS and recurrence. Liquid biopsy analyses revealed 74 alterations in the 141 evaluable serial plasma samples obtained from the 32 patients. The variant repertoire consisted of 12 germline-derived variants, 27 CH-derived variants and 35 tumor-derived variants. b, Patient CGES26, with a PD-L1 CPS of 35, cleared ctDNA on day 14 after one dose of neoadjuvant ICI. ctDNA levels remained undetectable throughout the treatment course, before surgery and postoperatively, which accurately reflected tumor regression on day 28 as well as <5% residual tumor at the time of resection; without evidence of clinical progression within 30.9 months. c, For patient CGES13, with a PD-L1 CPS of 5, ctDNA persistence was noted post-ICI, which was reflective of 60% residual tumor upon rebiopsy. Nevertheless, ctDNA clearance at the time of resection captured the complete tumor regression at that time point and undetectable ctDNA at the postoperative assessment was consistent with a RFS and OS of 43 months. d, Similarly, detectable ctDNA at the preoperative time point was reflective of residual tumor of 30% for patient CGES56, with a PD-L1 CPS of 25, who however cleared ctDNA postoperatively and this was reflected in the absence of disease recurrence. e, ctDNA status more accurately captured the clinical course of patient CGES15 (PD-L1 not evaluable), which showed persistence of ctDNA in the preoperative and postoperative time points despite a tumor regression of 95% at the time of resection based on pathological assessment and had disease recurrence at 7.8 months on trial. The original magnification of microscopic images is 20×; scale bar: 100 µm.
Fig. 4
Fig. 4. Association of ctDNA assessment and RFS.
ctDNA detection was assessed at the post-ICI, preoperative and postoperative timepoints. a, Patients with undetectable DNA throughout the study (gray) or undetectable ctDNA post-ICI (red) had a longer RFS compared to patients with detectable ctDNA (blue) post-ICI (median RFS 41.02 months versus not reached versus 21.54 months, respectively; log-rank, P = 0.038). b, Patients with undetectable ctDNA at the post-ICI time point had a longer RFS compared to patients with detectable ctDNA post-ICI (median RFS not reached versus 21.54 months, respectively; log-rank, P = 0.032). c,d, Patients with undetectable ctDNA throughout the study or at the preoperative time point had a longer RFS compared to patients that had detectable ctDNA at the preoperative time point (median RFS 41.02 versus 32.72 versus 7.80 months, respectively; log-rank, P = 0.005 (c), and median RFS 32.72 versus 7.80 months, respectively; log-rank, P = 0.012 (d)). e, Patients with undetectable ctDNA at the postoperative time point had a longer RFS compared to patients with detectable ctDNA (median RFS not reached versus 7.80 months, respectively; log-rank, P = 0.007). f, When ctDNA was assessed among patients who did not attain a pCR, non-pCR patients with undetectable ctDNA post-ICI had a longer RFS compared to non-pCR patients with detectable ctDNA post-ICI (median RFS not reached versus 21.54, respectively; log-rank, P = 0.058).
Fig. 5
Fig. 5. Neoantigen-specific T cell reactivity and ctDNA dynamics for patients with differential outcomes with neoadjuvant immune checkpoint inhibition.
Overall, neoantigen-specific T cell responses were observed in all patients with pCR and TCR expansions mirrored systemic tumor burden regression. a,b, Patient CGES13 attained a complete pathological response, which was consistent with ctDNA clearance at the preoperative time point (a). In tandem, the neoantigen-specific T cell clone CASWGGGTAAF (CDR3 region) was detected expanding after pulsing with mutation-associated neoantigens contained in pool 7 (b). c,d, Similarly, patient CGES2 showed ctDNA clearance after two cycles of ICI (c), which was reflected in complete pathological response at the time of resection and neoantigen-specific clone expansions for CASSSPETELWDEQFF, CASKGVADTQYF, CASSSRDRPYEQYF and CASSTDILSNYGYTF (d). e,f, In contrast, patient CGES11 showed sustained ctDNA throughout the course of the study (e), which was reflective of a residual tumor of 30% residual tumor at the time of resection. For this patient, there were no neoantigen-specific T cell expansions noted (f).
Extended Data Fig. 1
Extended Data Fig. 1. Radiotherapy plan for patient CGES22.
(a) Representative radiotherapy plan of patient CGES22 who developed adrenal insufficiency toxicity. Radiotherapy DICOMs are shown in representative axial, sagittal and coronal slices. (b) Dose volume histogram (DVH) of target and normal structures; all target and normal structure dose objectives met protocol-specified markers of plan quality, which mirror national guidelines. (c) DVH of right, left and combined adrenal glands; listed below the DVH are dose statistics (max, mean) for adrenal glands. As there are no metrics for goal dose in adrenal glands in the literature, these are contoured and reported after therapeutic radiation administration.
Extended Data Fig. 2
Extended Data Fig. 2. Radiotherapy plan for patient CGES26.
(a) Representative radiotherapy plan of patient CGES26 who experienced adrenal insufficiency toxicity. Radiotherapy DICOMs are shown in representative axial, sagittal and coronal slices. (b) Dose volume histogram (DVH) of target and normal structures; all target and normal structure dose objectives met protocol-specified markers of plan quality, which mirror national guidelines. (c) DVH of right, left and combined adrenal glands; listed below the DVH are dose statistics (max, mean) for adrenal glands. As there are no metrics for goal dose in adrenal glands in the literature, these are contoured and reported after therapeutic radiation administration.
Extended Data Fig. 3
Extended Data Fig. 3. Clinical outcomes of patients with differential baseline PD-L1 and LAG-3 expression.
(a) A trend toward a longer OS was noted for patients with a baseline PD-L1 CPS ≥5 compared to patients with a CPS <5 (log-rank p = 0.13). (b) When considering patients with adenocarcinoma (n = 26), patients with a baseline PD-L1 CPS ≥5 had a longer RFS compared to patients with a CPS <5 (median RFS not reached vs 29.34 months, respectively, log-rank p = 0.026). (c) There was no difference in normalized LAG-3 expression in baseline tumors by treatment arm (median LAG-3 normalized log2 expression of 6.12 vs 6.09 for arms A and B, respectively, two-sided Wilcoxon rank-sum test, p = 1). (d) Patients who attained a pCR showed a trend toward a higher baseline LAG-3 expression compared to patients who did not attain a pCR (median LAG-3 expression 6.78 vs 6.08, respectively, two-sided Wilcoxon rank-sum test, p = 0.059). (e) When considering Arm A patients (n = 13), there was no difference in baseline LAG-3 expression based on MPR status (median LAG-3 expression 6.14 vs 6.19 for non-MPR and MPR, respectively, two-sided Wilcoxon rank-sum test, p = 0.45). All box plots depict the median value, with the lower and upper hinge corresponding to the first and third quartiles, respectively. The upper whisker extends from the upper hinge to at most 1.5× the interquartile range and the lower whisker extends from the lower hinge to at most 1.5× the interquartile range.
Extended Data Fig. 4
Extended Data Fig. 4. Correlation between ctDNA status at different time points and residual tumor volume at the time of surgery.
(a) The level of ctDNA at baseline, represented by the maximal mutant allele frequency of tumor-derived variants, did not correlate with the percent of residual tumors at the time of resection (Pearson’s correlation coefficient R2 = 0.039). (b) Detectable ctDNA post-ICI induction was associated with >20% residual tumor (two-sided Fisher’s exact, p = 0.034). (c) Patients with undetectable ctDNA post-ICI (orange) showed a trend toward a lower residual tumor volume at the time of resection compared to patients with detectable ctDNA at that time point (blue; median residual tumor 5% vs 25%, respectively, two-sided Wilcoxon rank-sum test, p = 0.16). (d) Patients with undetectable ctDNA at the preop time point had a numerically lower residual tumor volume at the time of resection when compared to patients with detectable ctDNA at the same time point; however, this did not reach statistical significance (median residual tumor 7.5% vs 20%, respectively, two-sided Wilcoxon rank-sum test, p = 0.3). All box plots depict the median value, with the lower and upper hinge corresponding to the first and third quartiles, respectively. The upper whisker extends from the upper hinge to at most 1.5× the interquartile range and the lower whisker extends from the lower hinge to at most 1.5× the interquartile range.
Extended Data Fig. 5
Extended Data Fig. 5. Association of ctDNA status and overall survival.
(a) We observed a trend toward a longer overall survival for patients with undetectable ctDNA throughout the study or patients with undetectable ctDNA post-ICI compared to patients with detectable ctDNA post-ICI induction (median OS not reached for all groups, log-rank p = 0.07). (b) Patients with undetectable ctDNA post-ICI had a trend toward a longer OS compared to patients with detectable ctDNA at post-ICI (median OS not reached for both groups, log-rank p = 0.07). (c) Patients with undetectable ctDNA throughout the study or undetectable ctDNA at the preop timepoint had a longer OS compared to patients with detectable ctDNA (median OS not reached vs not reached vs 23.43 months, respectively, log-rank p = 0.023). (d) When patients with undetectable ctDNA throughout the study were excluded, we observed a trend toward longer OS for patients with undetectable ctDNA preop compared to patients with detectable ctDNA at that time point (median OS not reached vs 23.43 months, respectively, log-rank p = 0.075). (e) Patients with undetectable ctDNA postop had a longer OS compared to patients with detectable ctDNA postop (median OS not reached vs 20.43, respectively, log-rank p = 0.017). (f) In evaluating non-pCR patients, overall survival was not statistically significantly different with respect to post-ICI ctDNA status, likely due to the small number of cases (log-rank p = 0.213).
Extended Data Fig. 6
Extended Data Fig. 6. Association between clinical outcomes and sustained ctDNA clearance.
ctDNA sustained clearance was defined as ctDNA presence at baseline/D14 followed by sustained clearance for the duration of the study (in all post-ICI, preop and postop time points). (a) Patients with sustained ctDNA clearance had a trend toward longer RFS (median RFS not reached vs 29.34 months, log-rank p = 0.084) (b) Patients with sustained ctDNA clearance or undetectable ctDNA throughout the study attained a numerically longer RFS; however, this finding did not reach statistical significance (median RFS 41.02 for undetectable ctDNA vs not reached for sustained ctDNA clearance vs 29.34 months for ctDNA positive, log-rank p = 0.06).
Extended Data Fig. 7
Extended Data Fig. 7. Prediction of recurrence-free and overall survival based on pathological complete or major pathological response for the subset of patients with evaluable ctDNA.
(a) In a subset analysis that included only patients with evaluable ctDNA and pathologic responses (n = 18), we observed a trend toward a longer RFS for patients that attained a complete pathological response compared to patients that did not attain a complete pathological response (median RFS not reached vs 29.34 months, respectively, log-rank p = 0.082). (b) In the same subset of patients (n = 18), there were no differences noted in overall survival by pathological complete response status (median OS not reached for both groups, log-rank p = 0.996). (c,d) Similarly, for the 18 patients with evaluable ctDNA, patients with a major pathological response did not have a longer RFS or OS compared to patients that did not attain a major pathological response (median RFS not reached vs 29.34 months, respectively, log-rank p = 0.256, and median OS not reached for both groups, log-rank p = 0.814).
Extended Data Fig. 8
Extended Data Fig. 8. Survival analyses based on combined baseline PD-L1 expression and ctDNA status.
Baseline PD-L1 CPS binarized using a CPS threshold of 5 and combined with ctDNA status post-ICI and preop. (a,b) Patients with undetectable ctDNA post-ICI had a statistically significantly longer RFS and numerically longer OS compared to patients with detectable ctDNA independent of PD-L1 CPS (log-rank p = 0.005 and p = 0.099, respectively). (c,d) Patients with detectable ctDNA preop and a CPS < 5 had a significantly shorter RFS and numerically shorter OS (log-rank p = 0.0003 and p = 0.15, respectively).
Extended Data Fig. 9
Extended Data Fig. 9. Neoantigen-specific T cell responses for patients with differential ctDNA and pathological responses.
Patients CGES3 (a) and CGES5 (b) both had undetectable ctDNA throughout the study, attained a complete pathological response and did not have disease recurrence within the study interval. For patient CGES3 (a), 3 neoantigen-specific TCR clone expansions were noted (CATSAPGHPNEAFF, CASRTRDRRNYGGYTF and CASSSSYNEQFF); similarly, for patient CGES5 (b), one neoantigen-specific TCR clone expansion (CASSHGRTQPQHF) was noted. (c) Two neoantigen-specific TCR clone expansions (CASSSSNQPQHF and CASSLGTGVEQYF) were noted for patient CGES12, who had detectable ctDNA until the time of surgery reflective of 90% residual tumor at the time of resection, and later experienced disease recurrence. (d) No neoantigen-specific TCR clonal expansions were noted for patient CGES27, with undetectable ctDNA throughout the study and 80% residual tumor at the time of resection.

Comment in

References

    1. Bray F, et al. Global cancer statistics 2018: GLOBOCAN estimates of incidence and mortality worldwide for 36 cancers in 185 countries. CA Cancer J. Clin. 2018;68:394–424. doi: 10.3322/caac.21492. - DOI - PubMed
    1. Kelly RJ, et al. Adjuvant nivolumab in resected esophageal or gastroesophageal junction cancer. N. Engl. J. Med. 2021;384:1191–1203. doi: 10.1056/NEJMoa2032125. - DOI - PubMed
    1. Thompson ED, et al. Patterns of PD-L1 expression and CD8 T cell infiltration in gastric adenocarcinomas and associated immune stroma. Gut. 2017;66:794–801. doi: 10.1136/gutjnl-2015-310839. - DOI - PMC - PubMed
    1. Kelly RJ, et al. The dynamic and transient immune microenvironment in locally advanced esophageal adenocarcinoma post chemoradiation. Ann. Surg. 2018;268:992–999. doi: 10.1097/SLA.0000000000002410. - DOI - PubMed
    1. Kelly R, et al. O-7 adjuvant nivolumab vs placebo in resected esophageal or gastroesophageal junction cancer following neoadjuvant chemoradiotherapy: first report of comprehensive biomarker analyses from CheckMate 577. Ann. Oncol. 2023;34:S183. doi: 10.1016/j.annonc.2023.04.022. - DOI

Publication types

MeSH terms

Associated data