. 2024 Mar;30(3):863-874.
doi: 10.1038/s41591-024-02856-4. Epub 2024 Mar 19.

A visual-language foundation model for computational pathology

Affiliations

A visual-language foundation model for computational pathology

Ming Y Lu et al. Nat Med. 2024 Mar.

Abstract

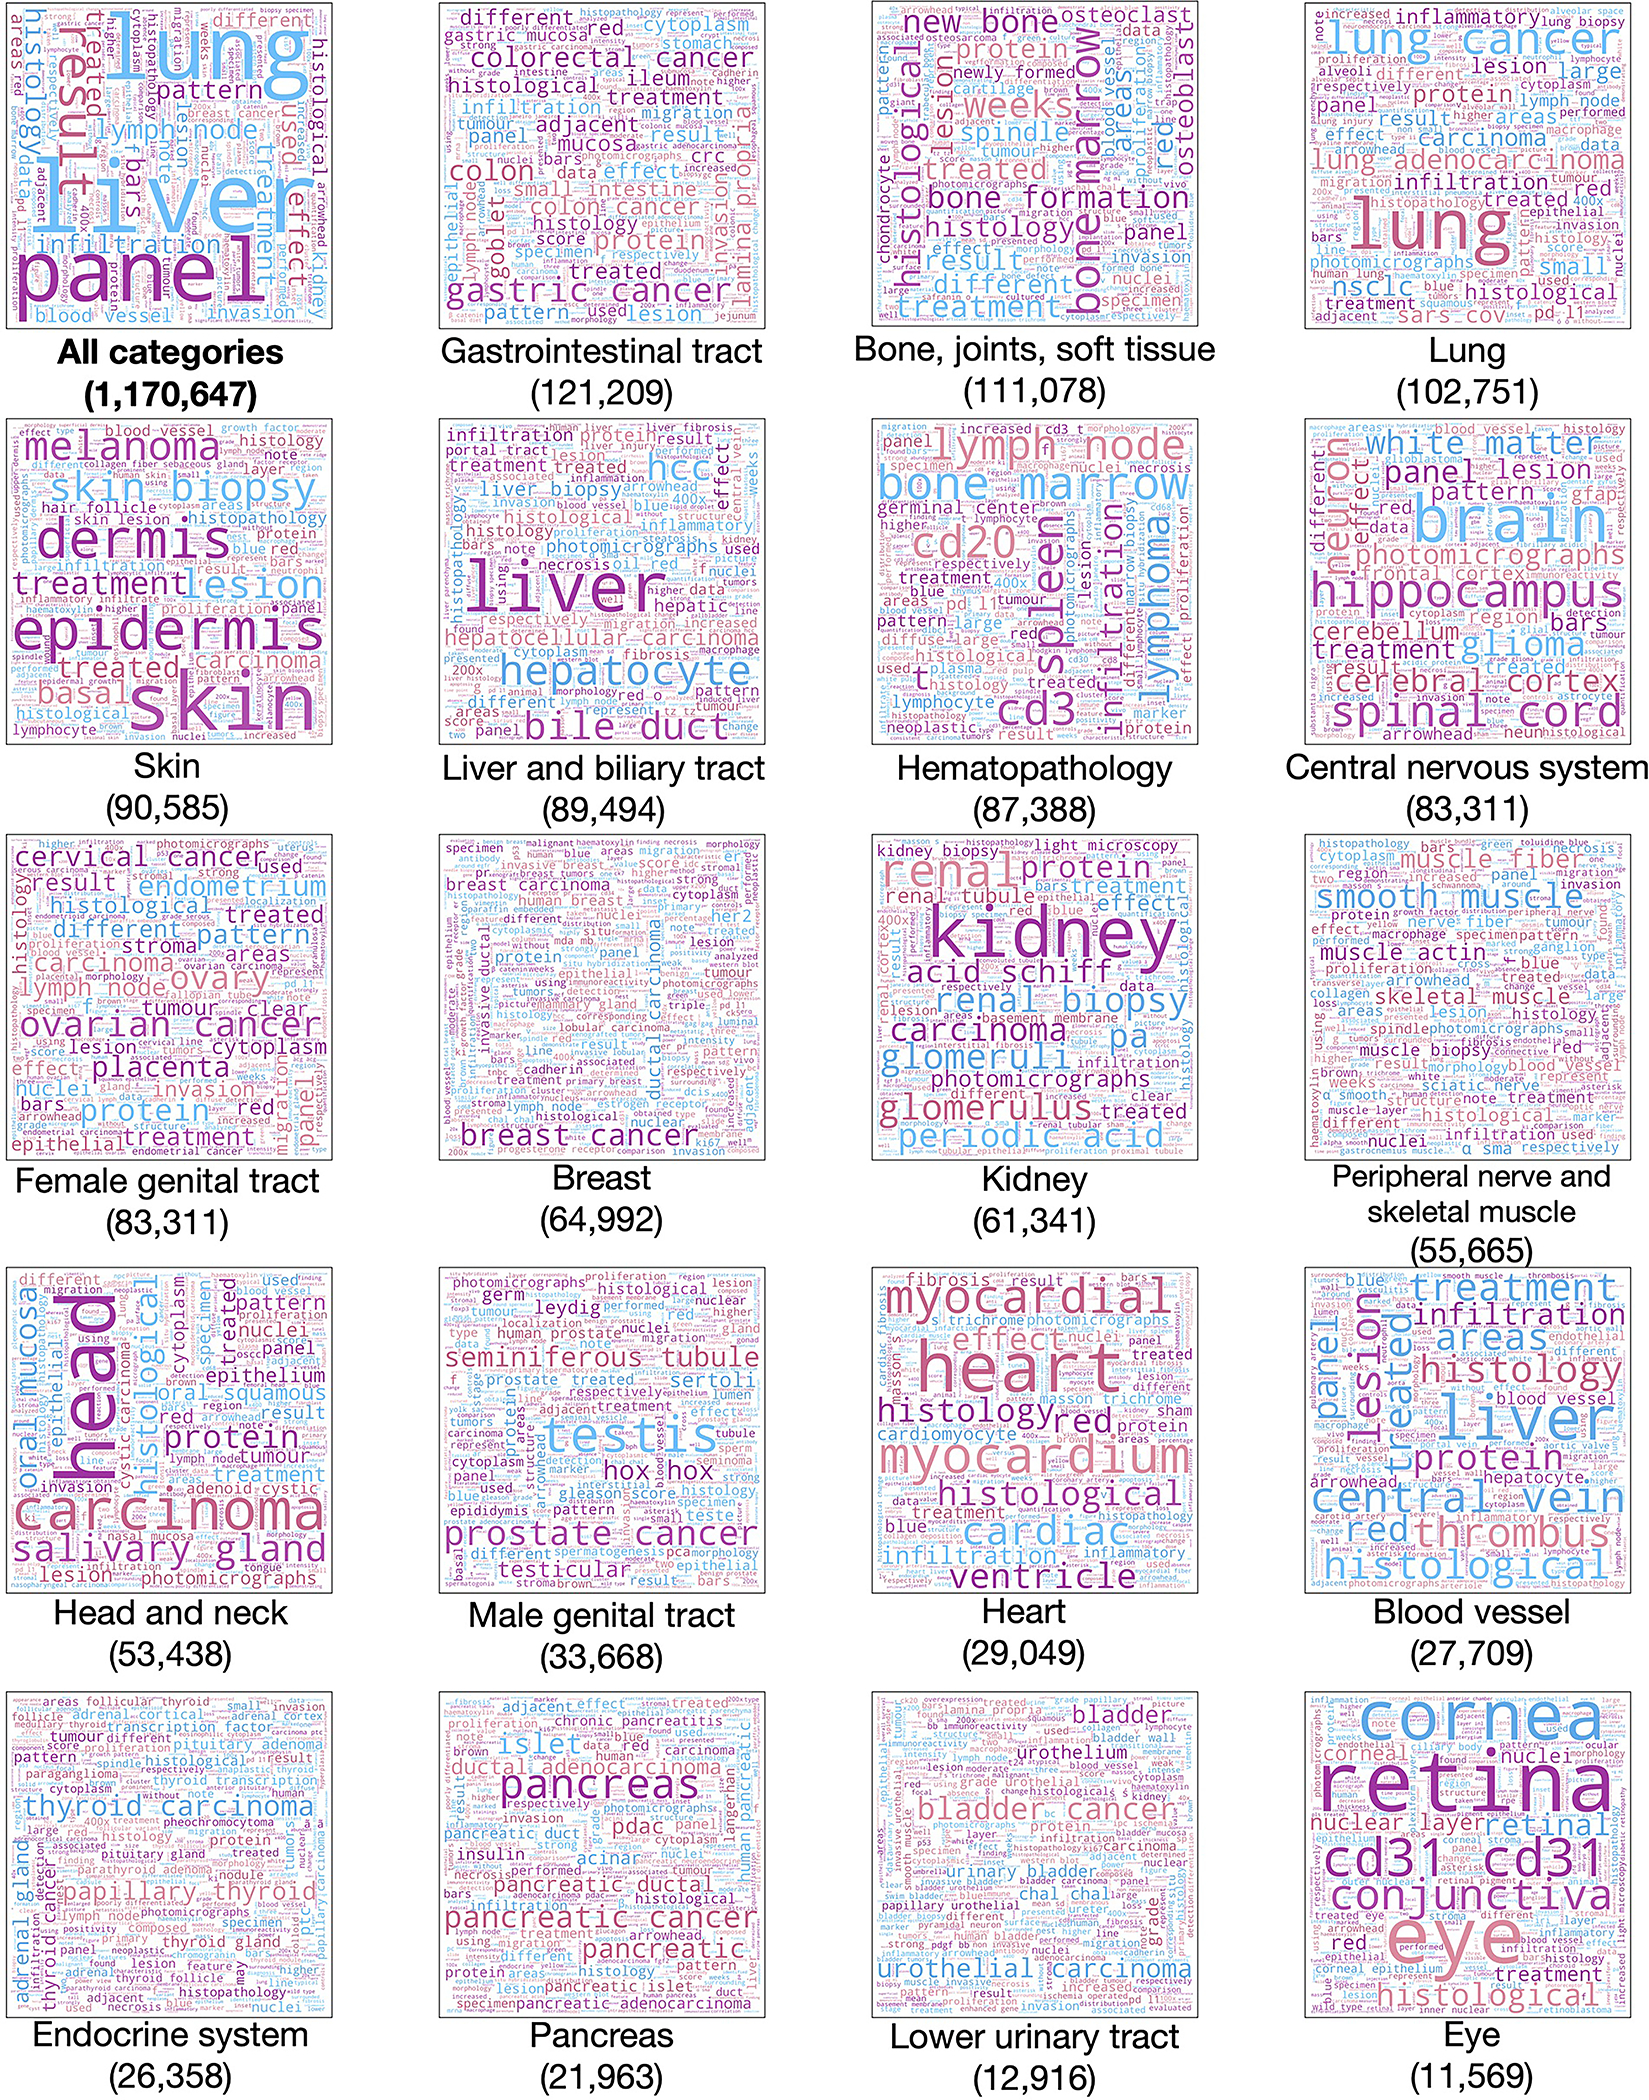
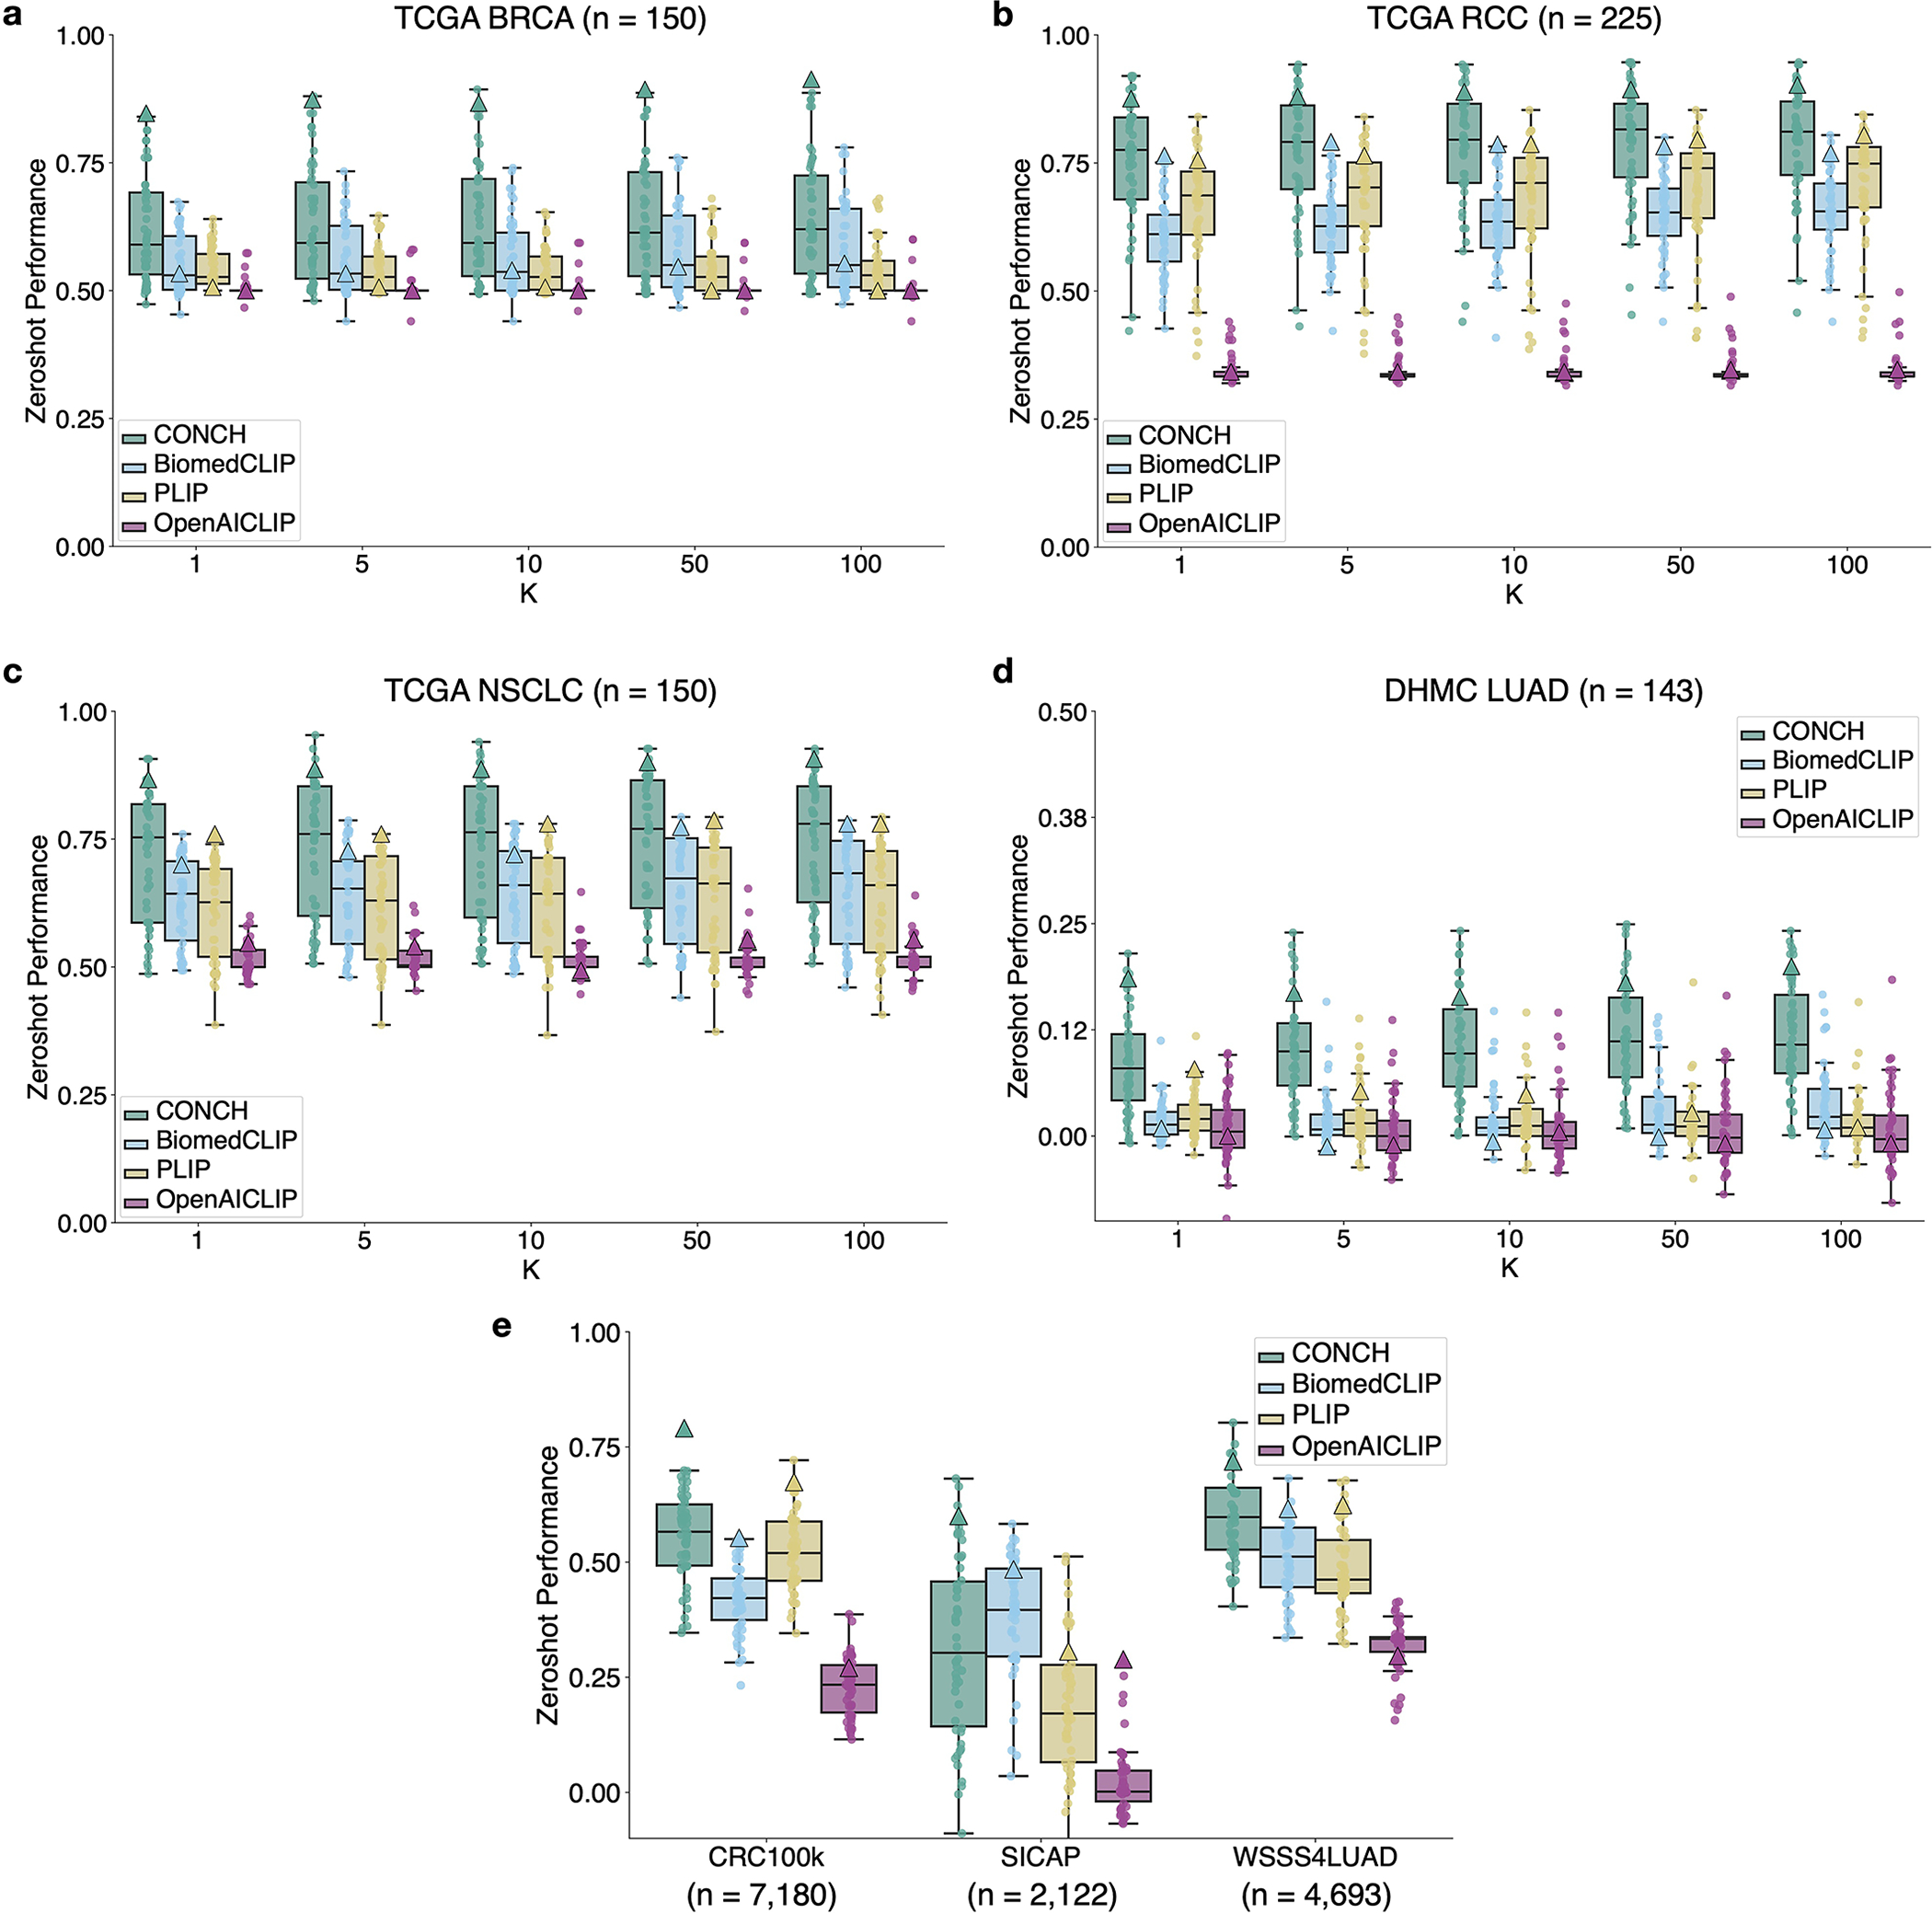
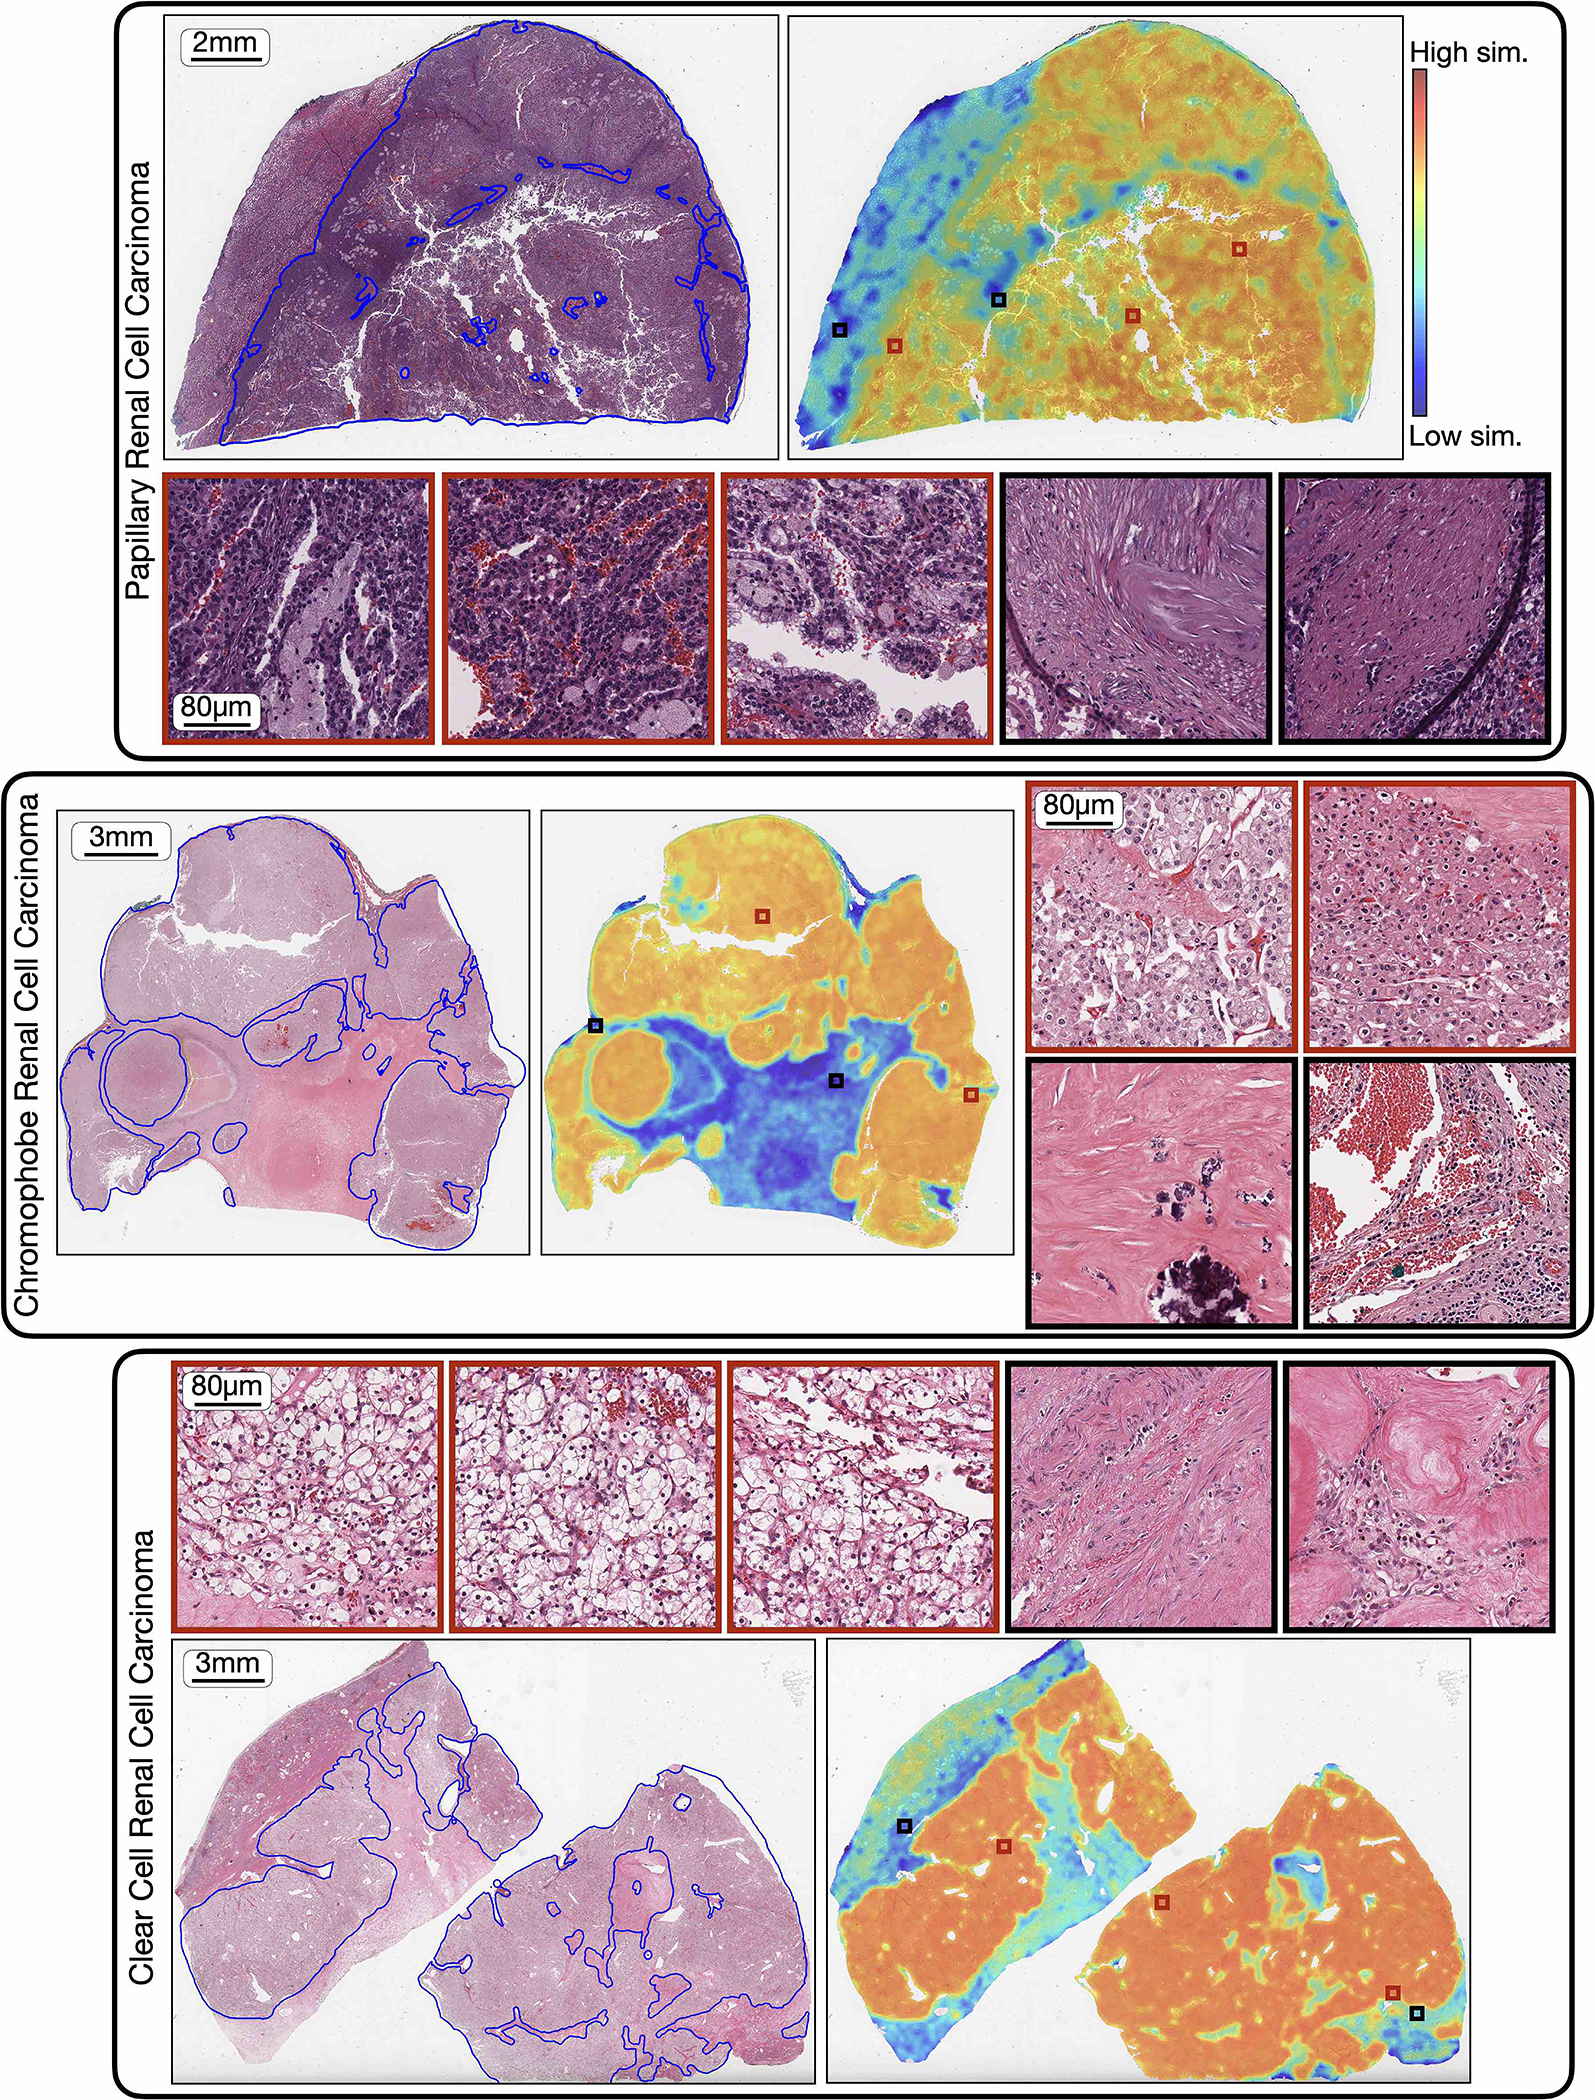
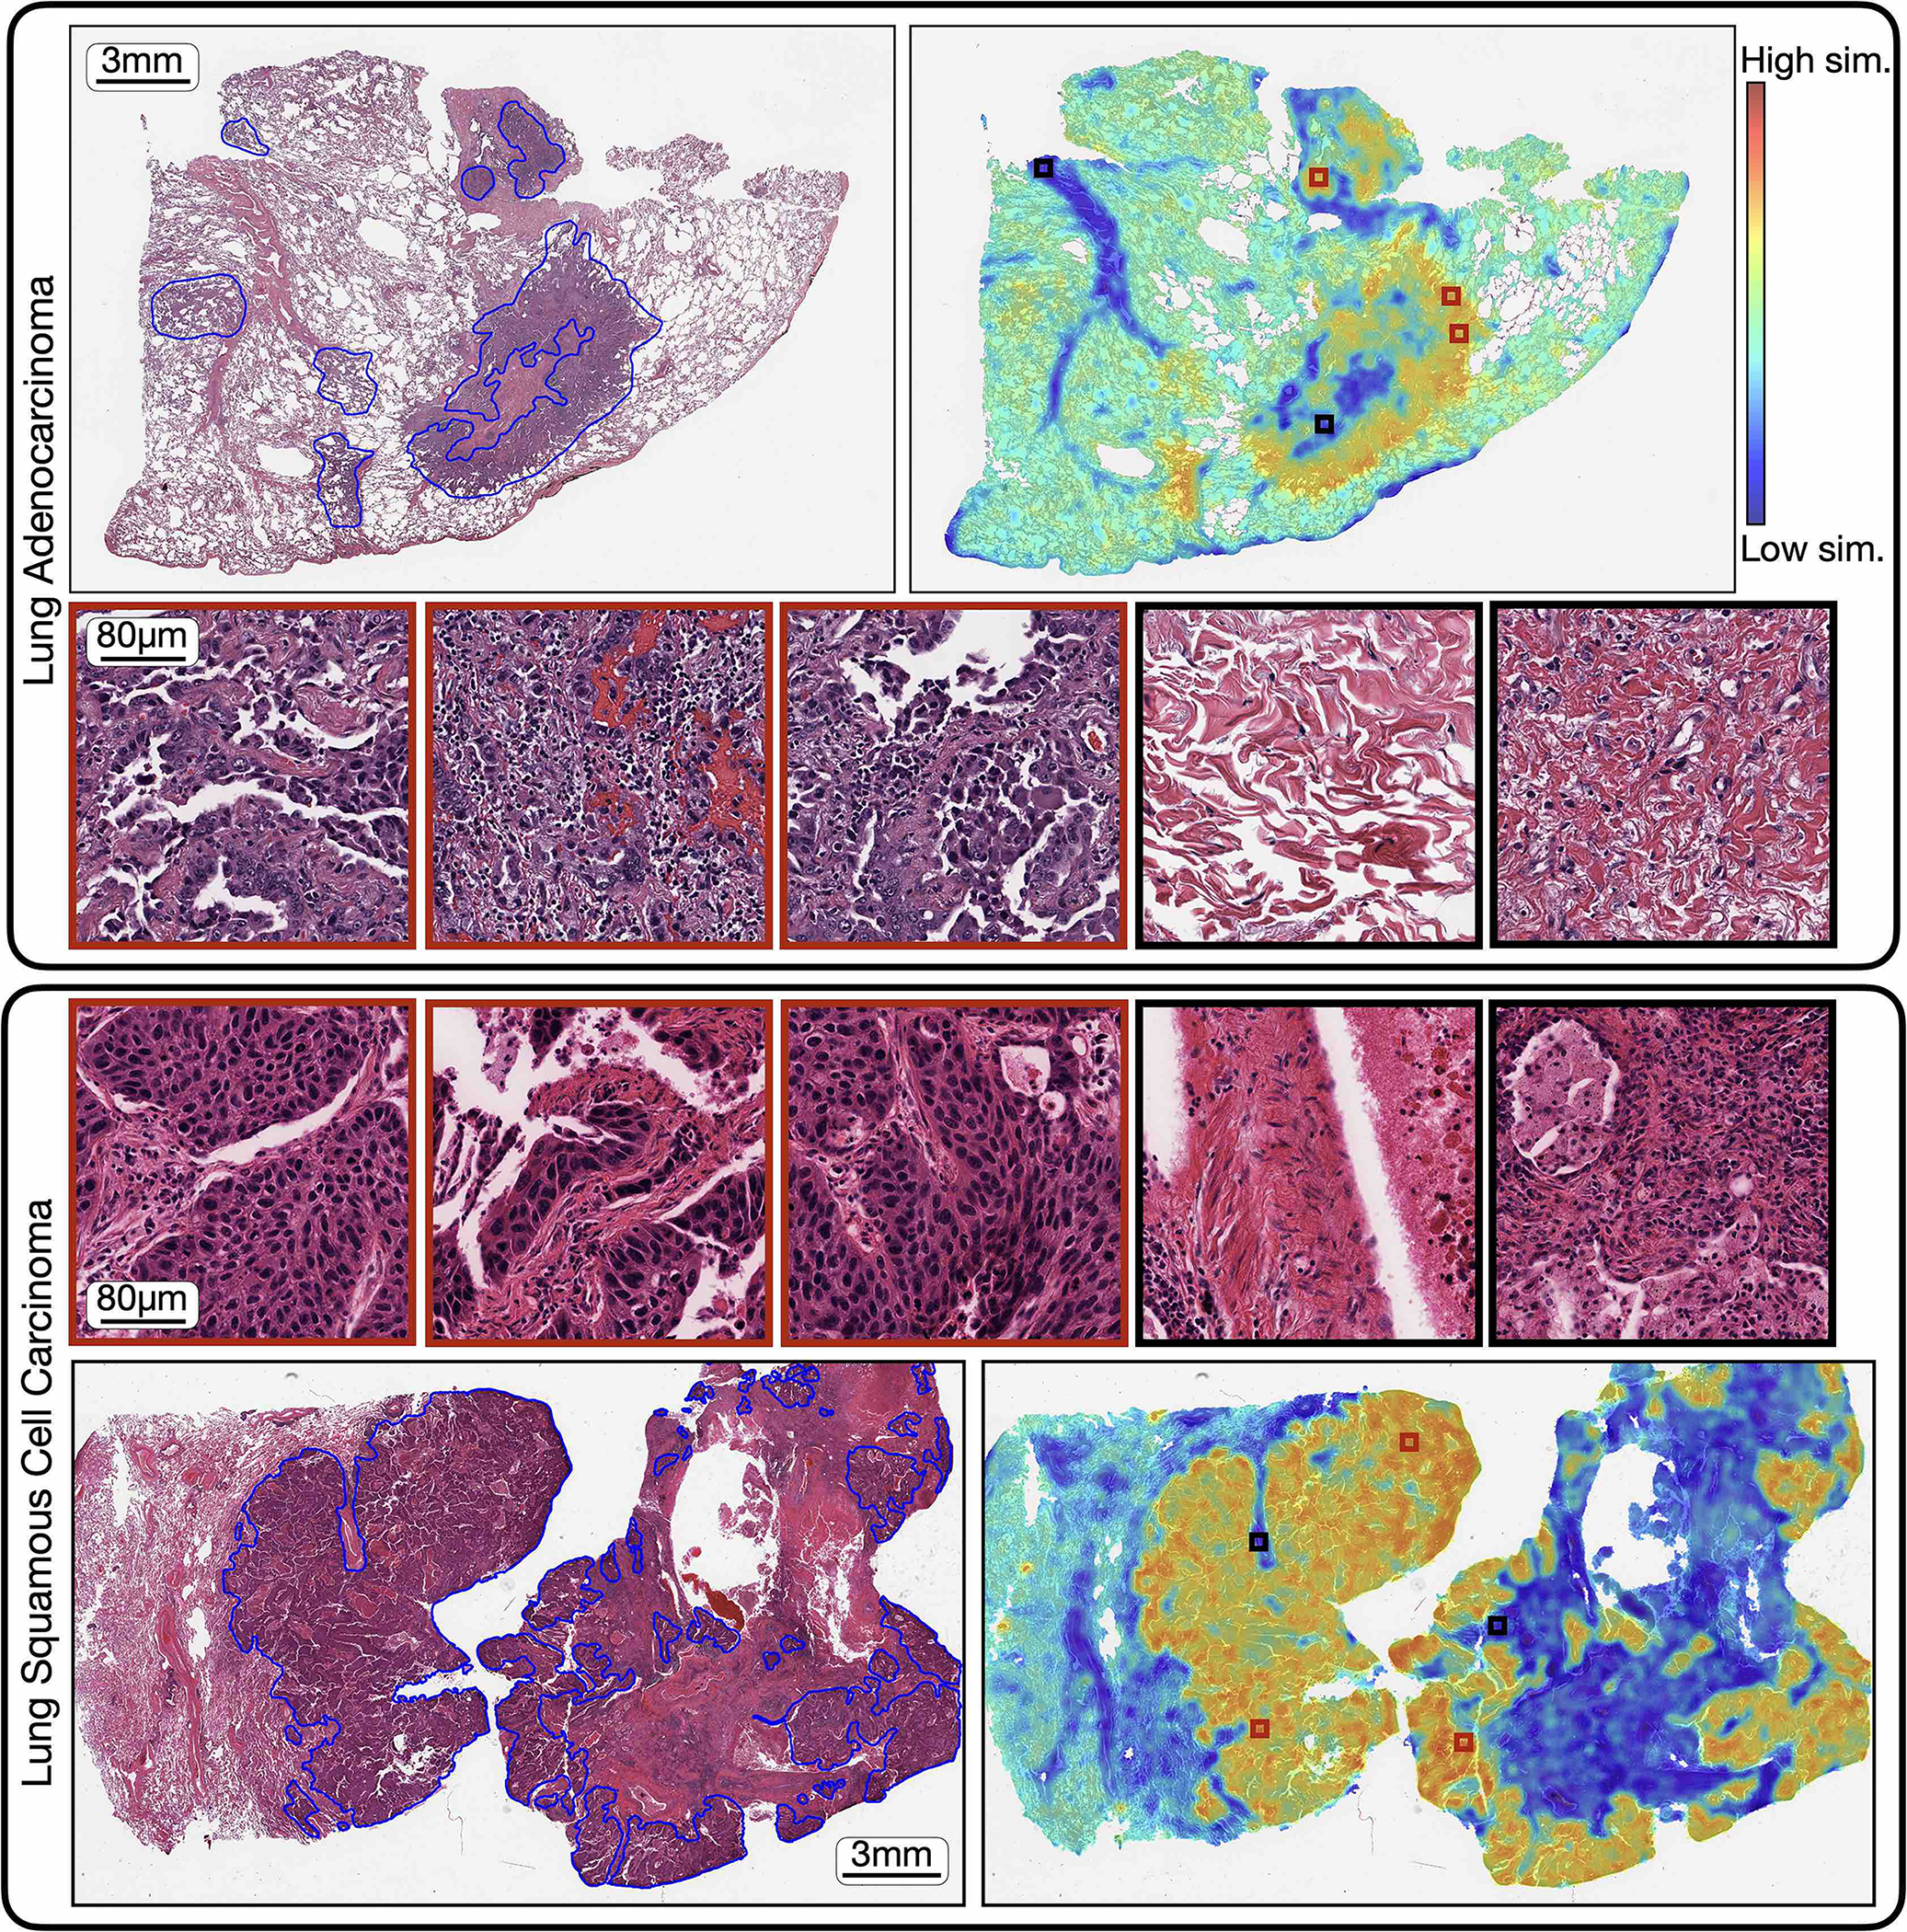
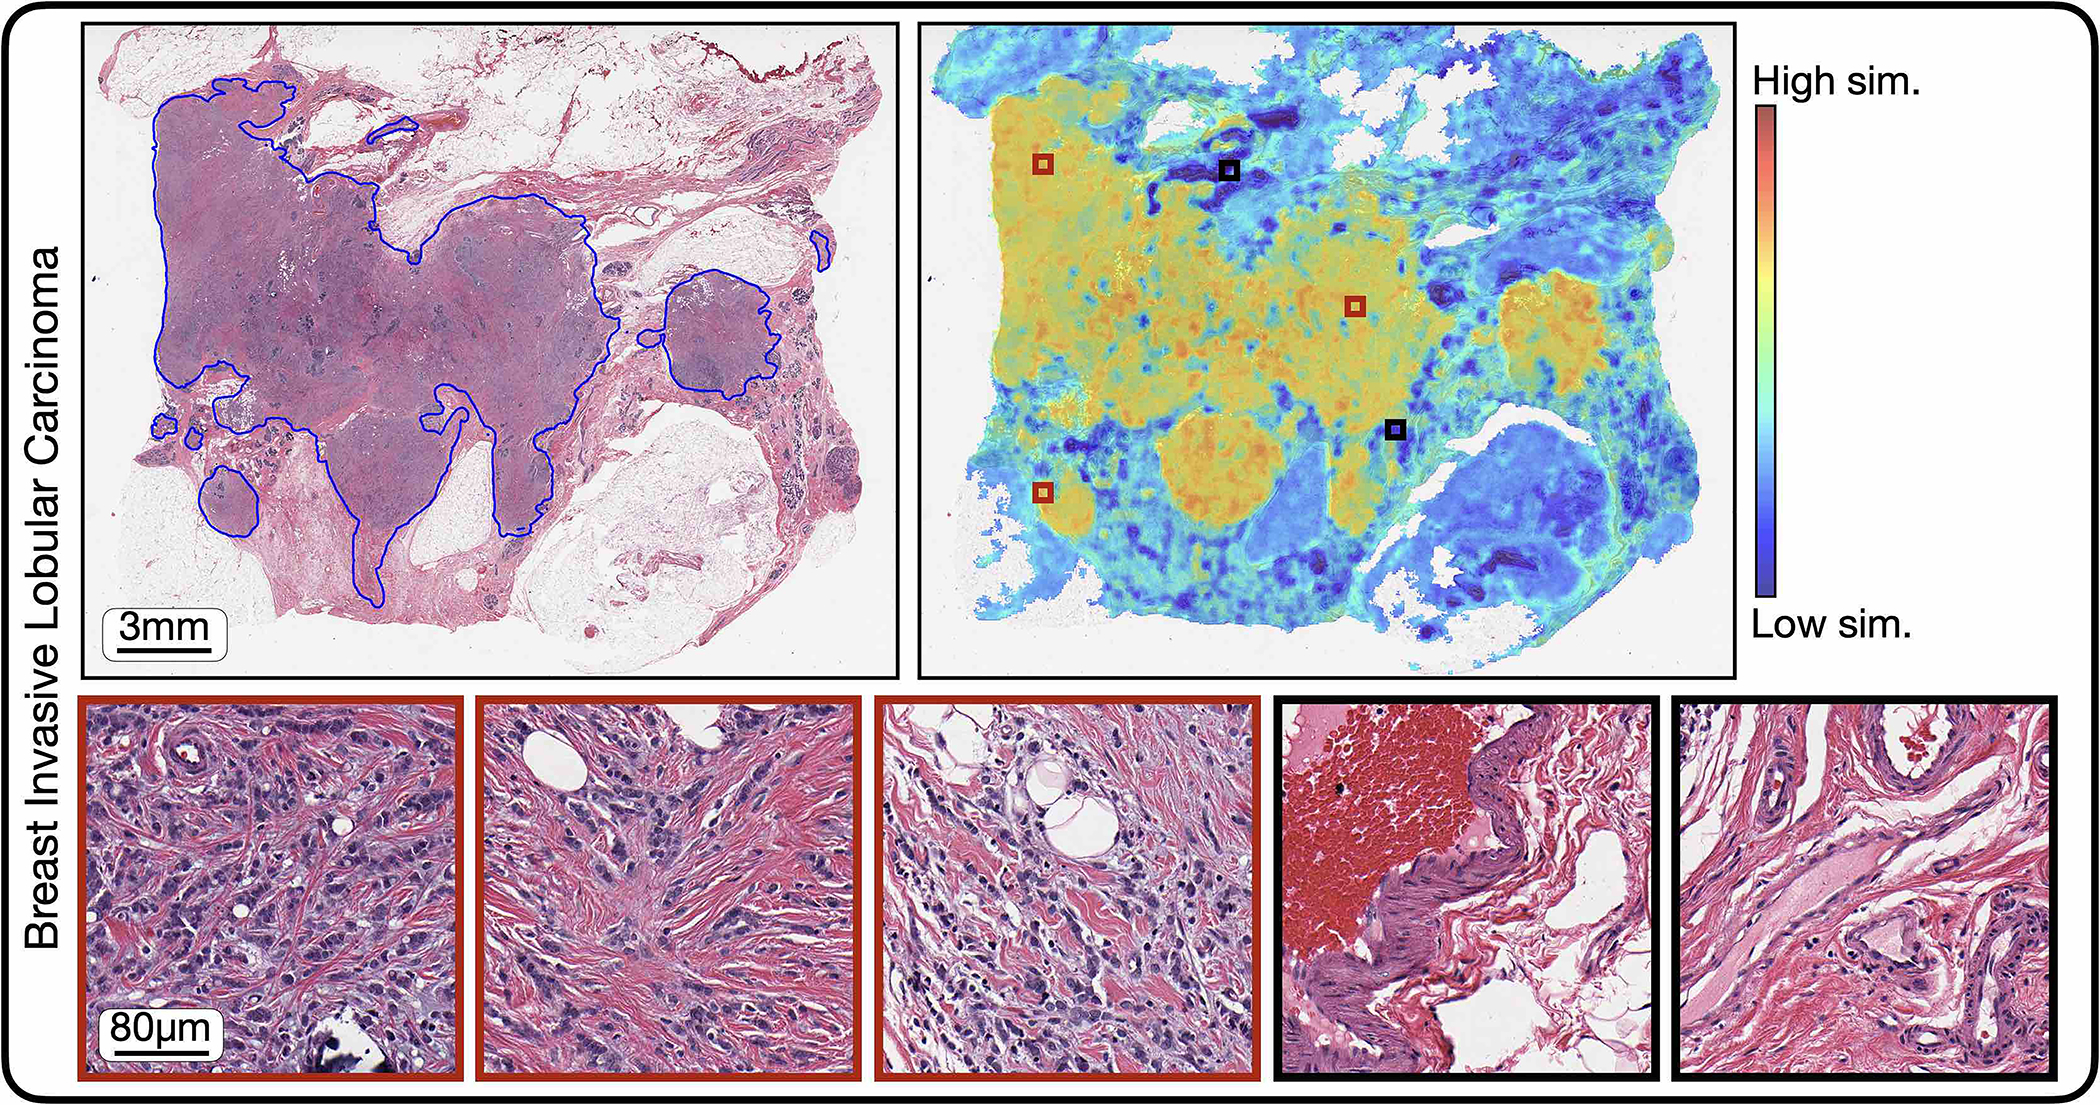
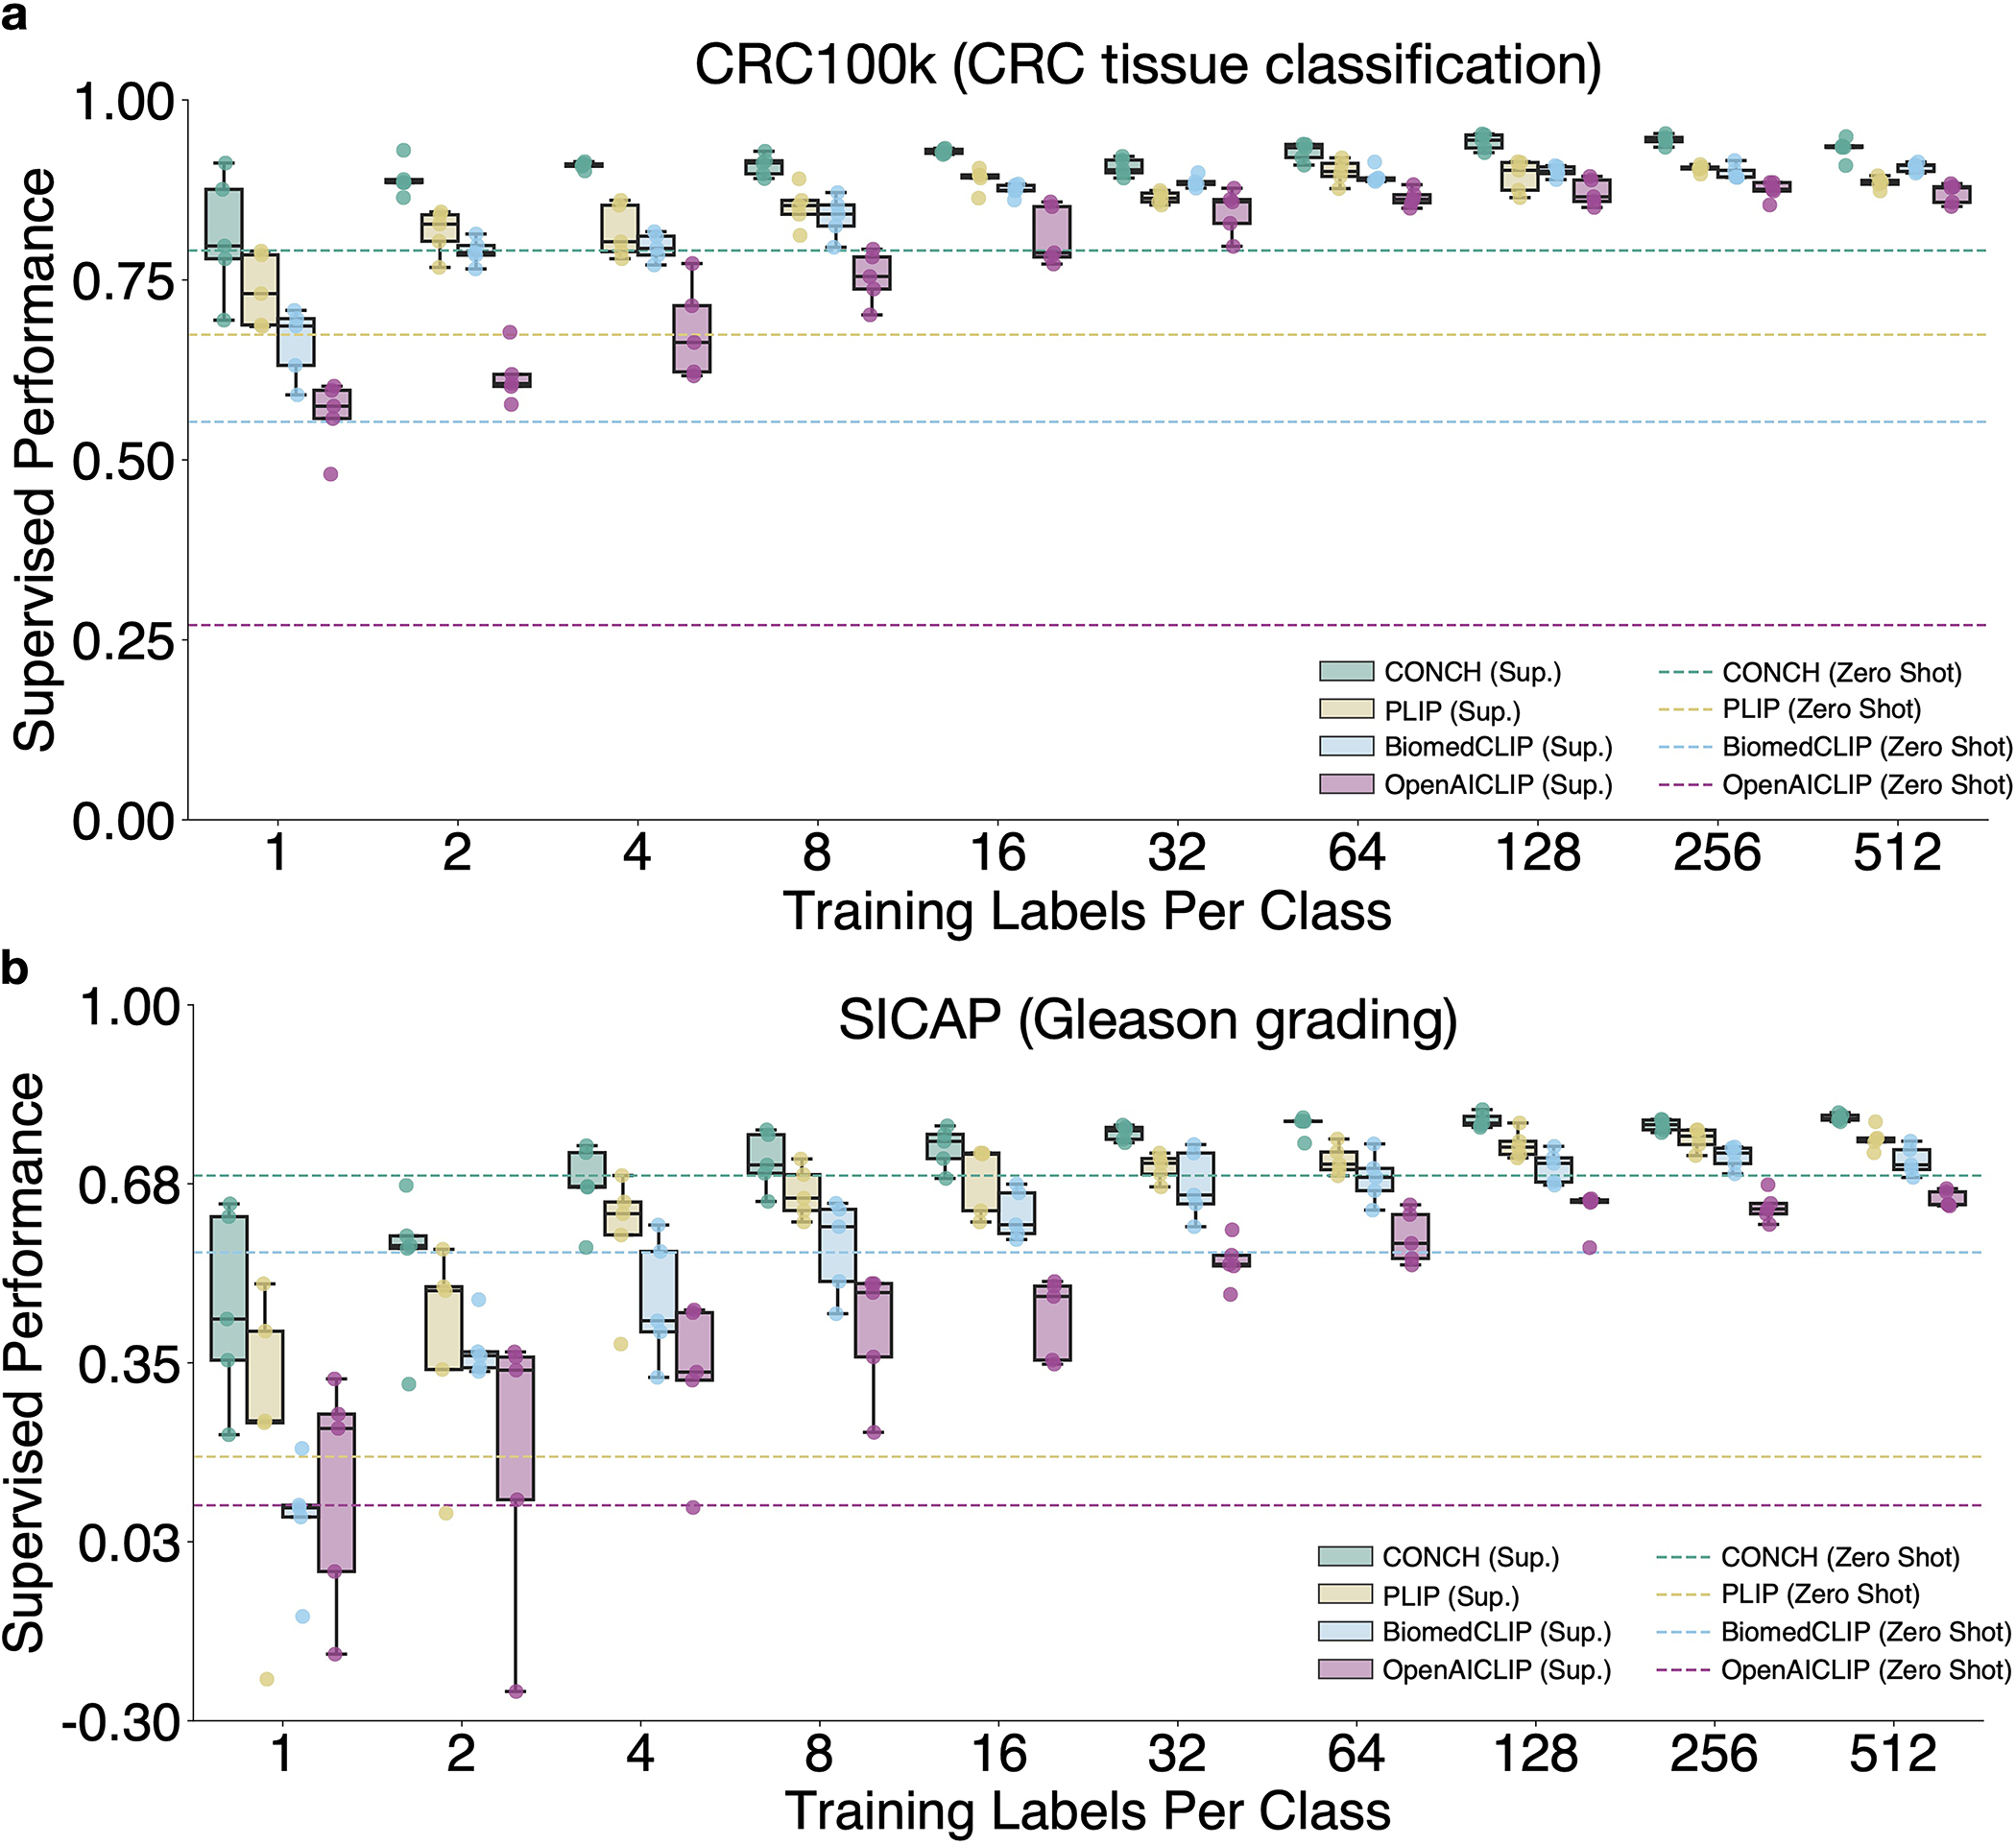
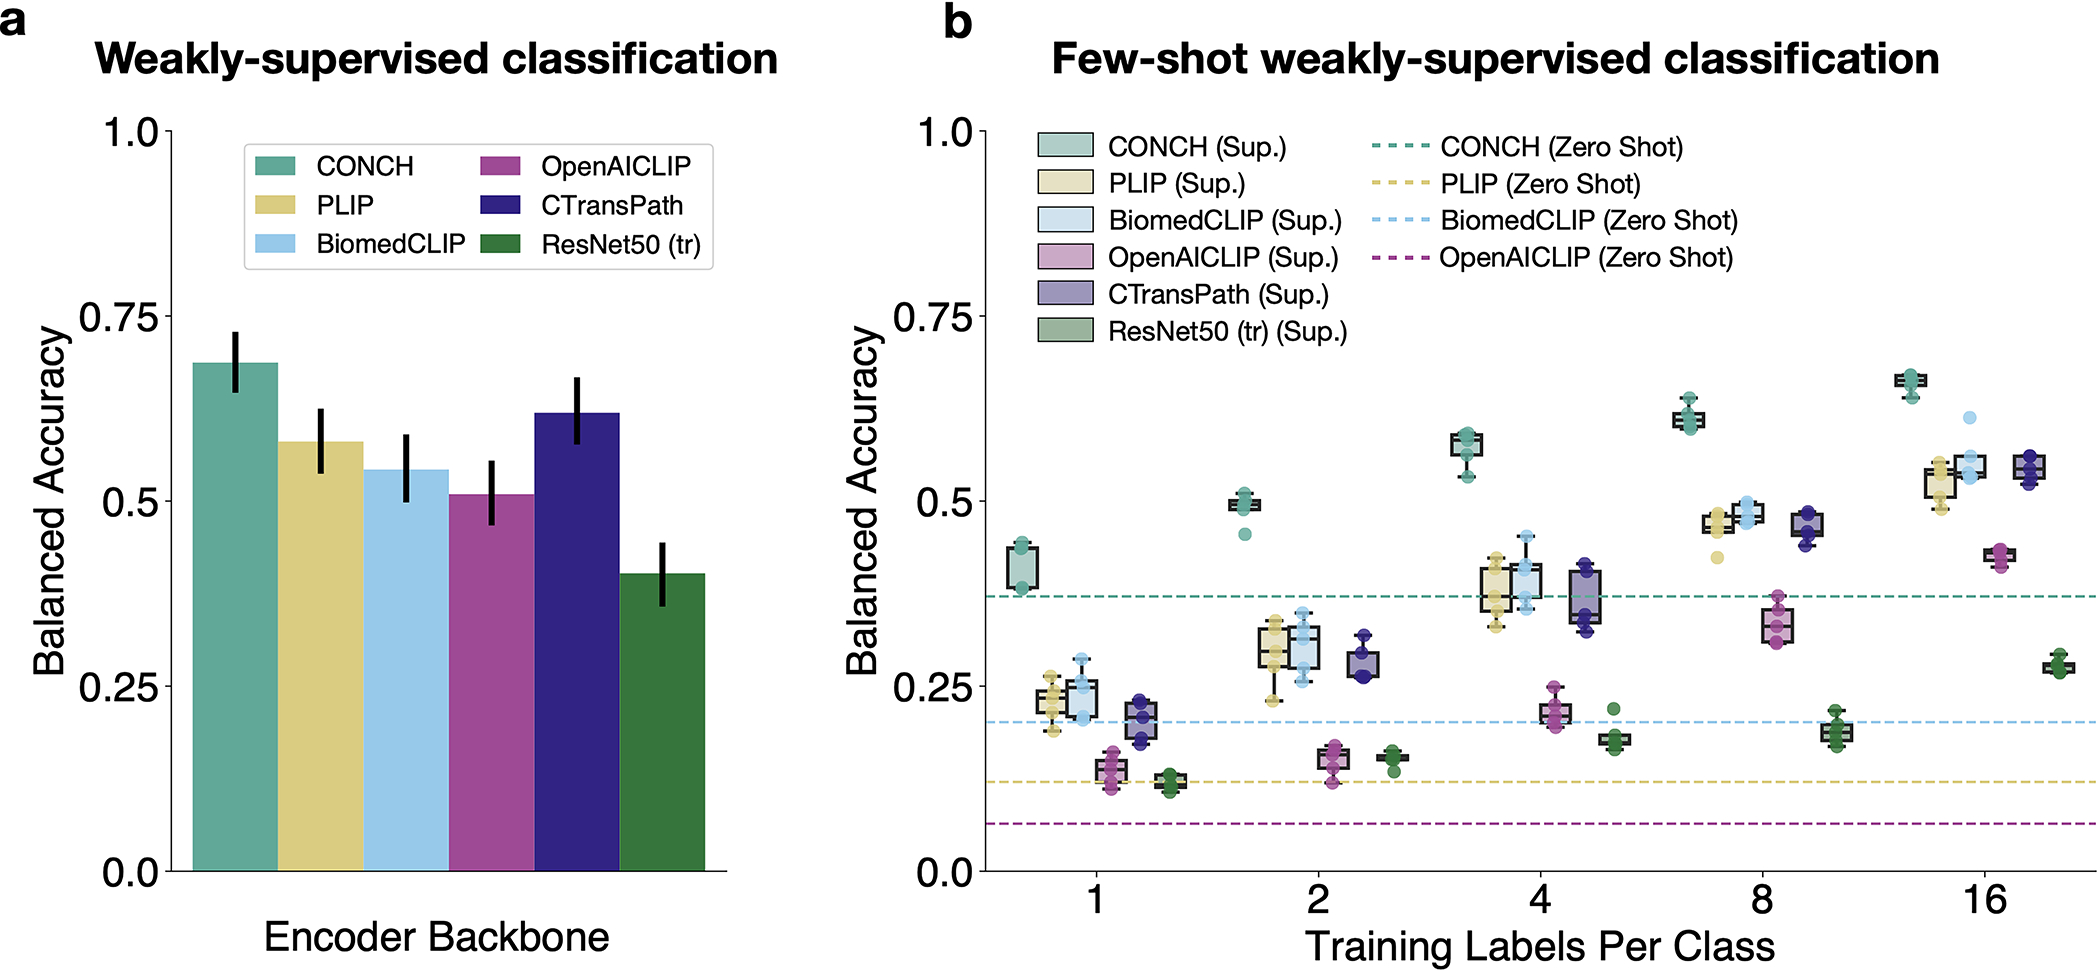
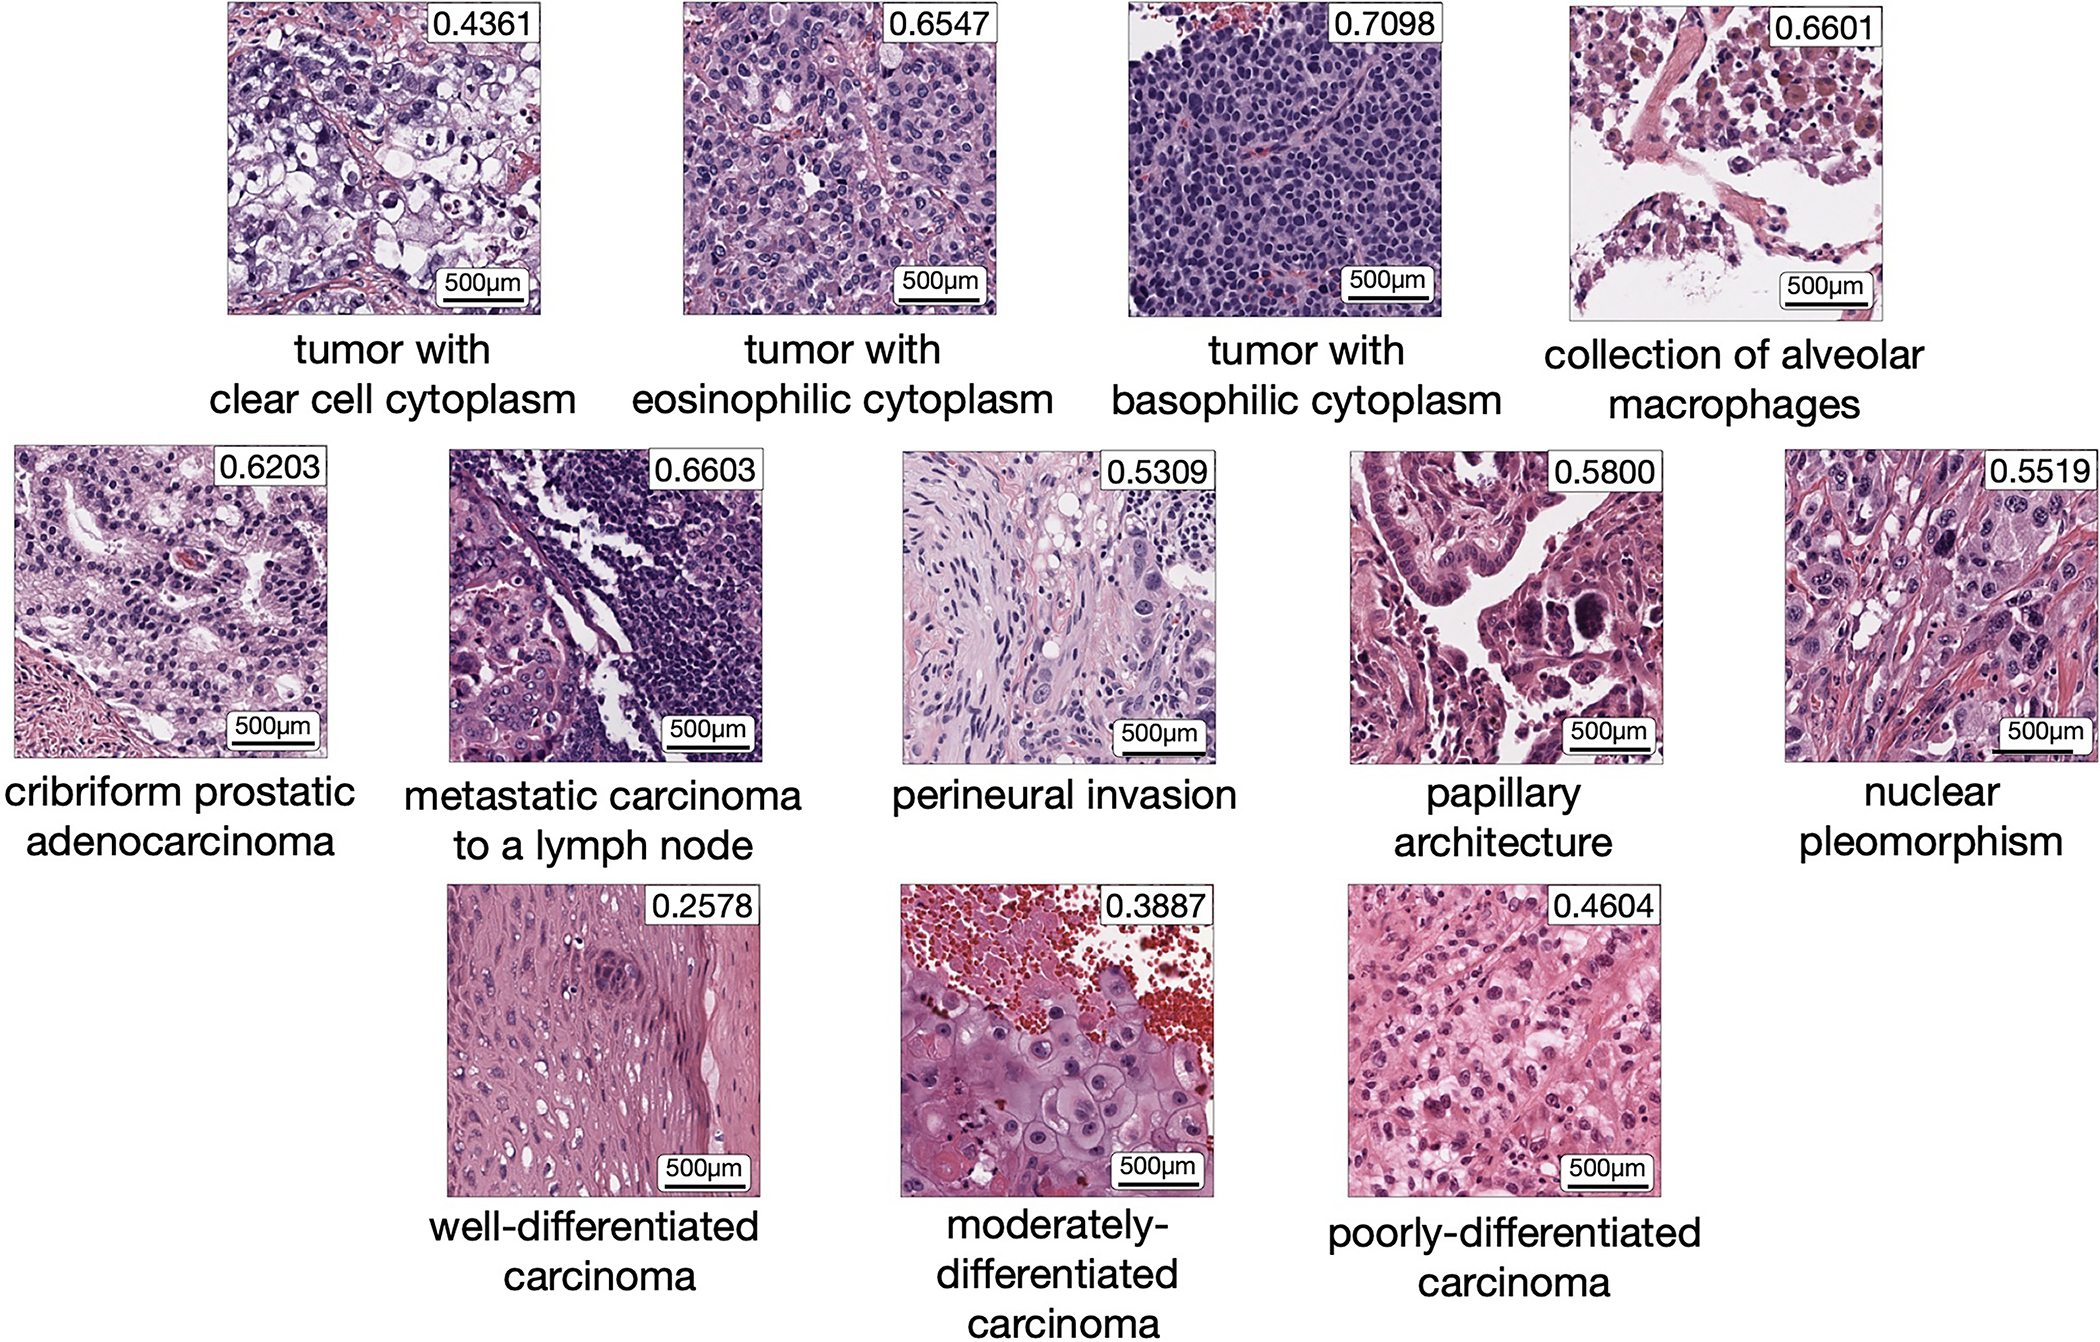
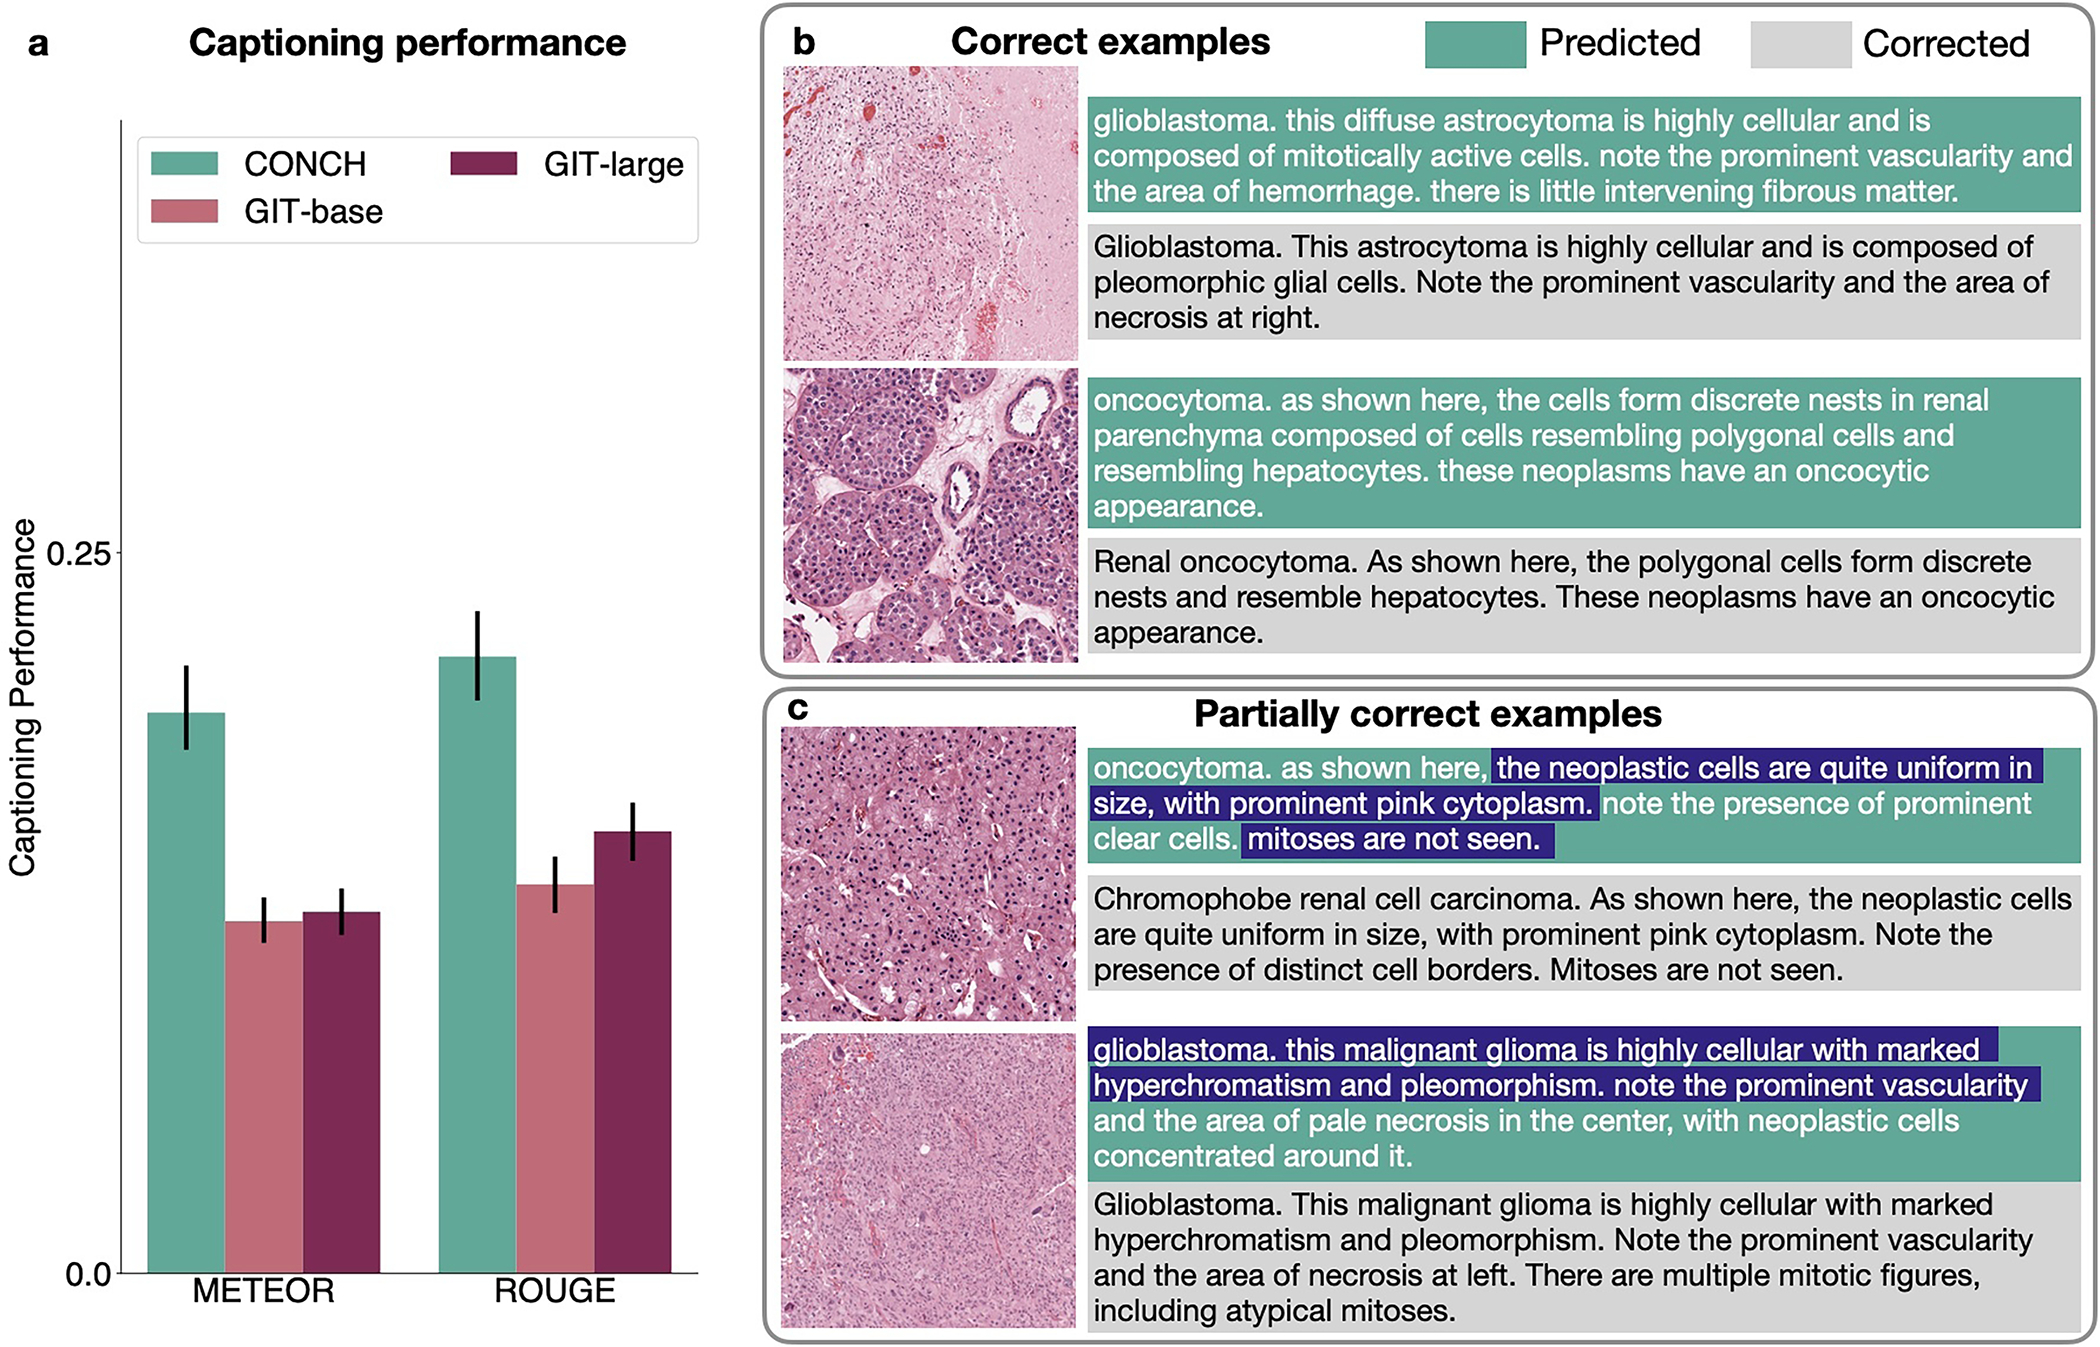
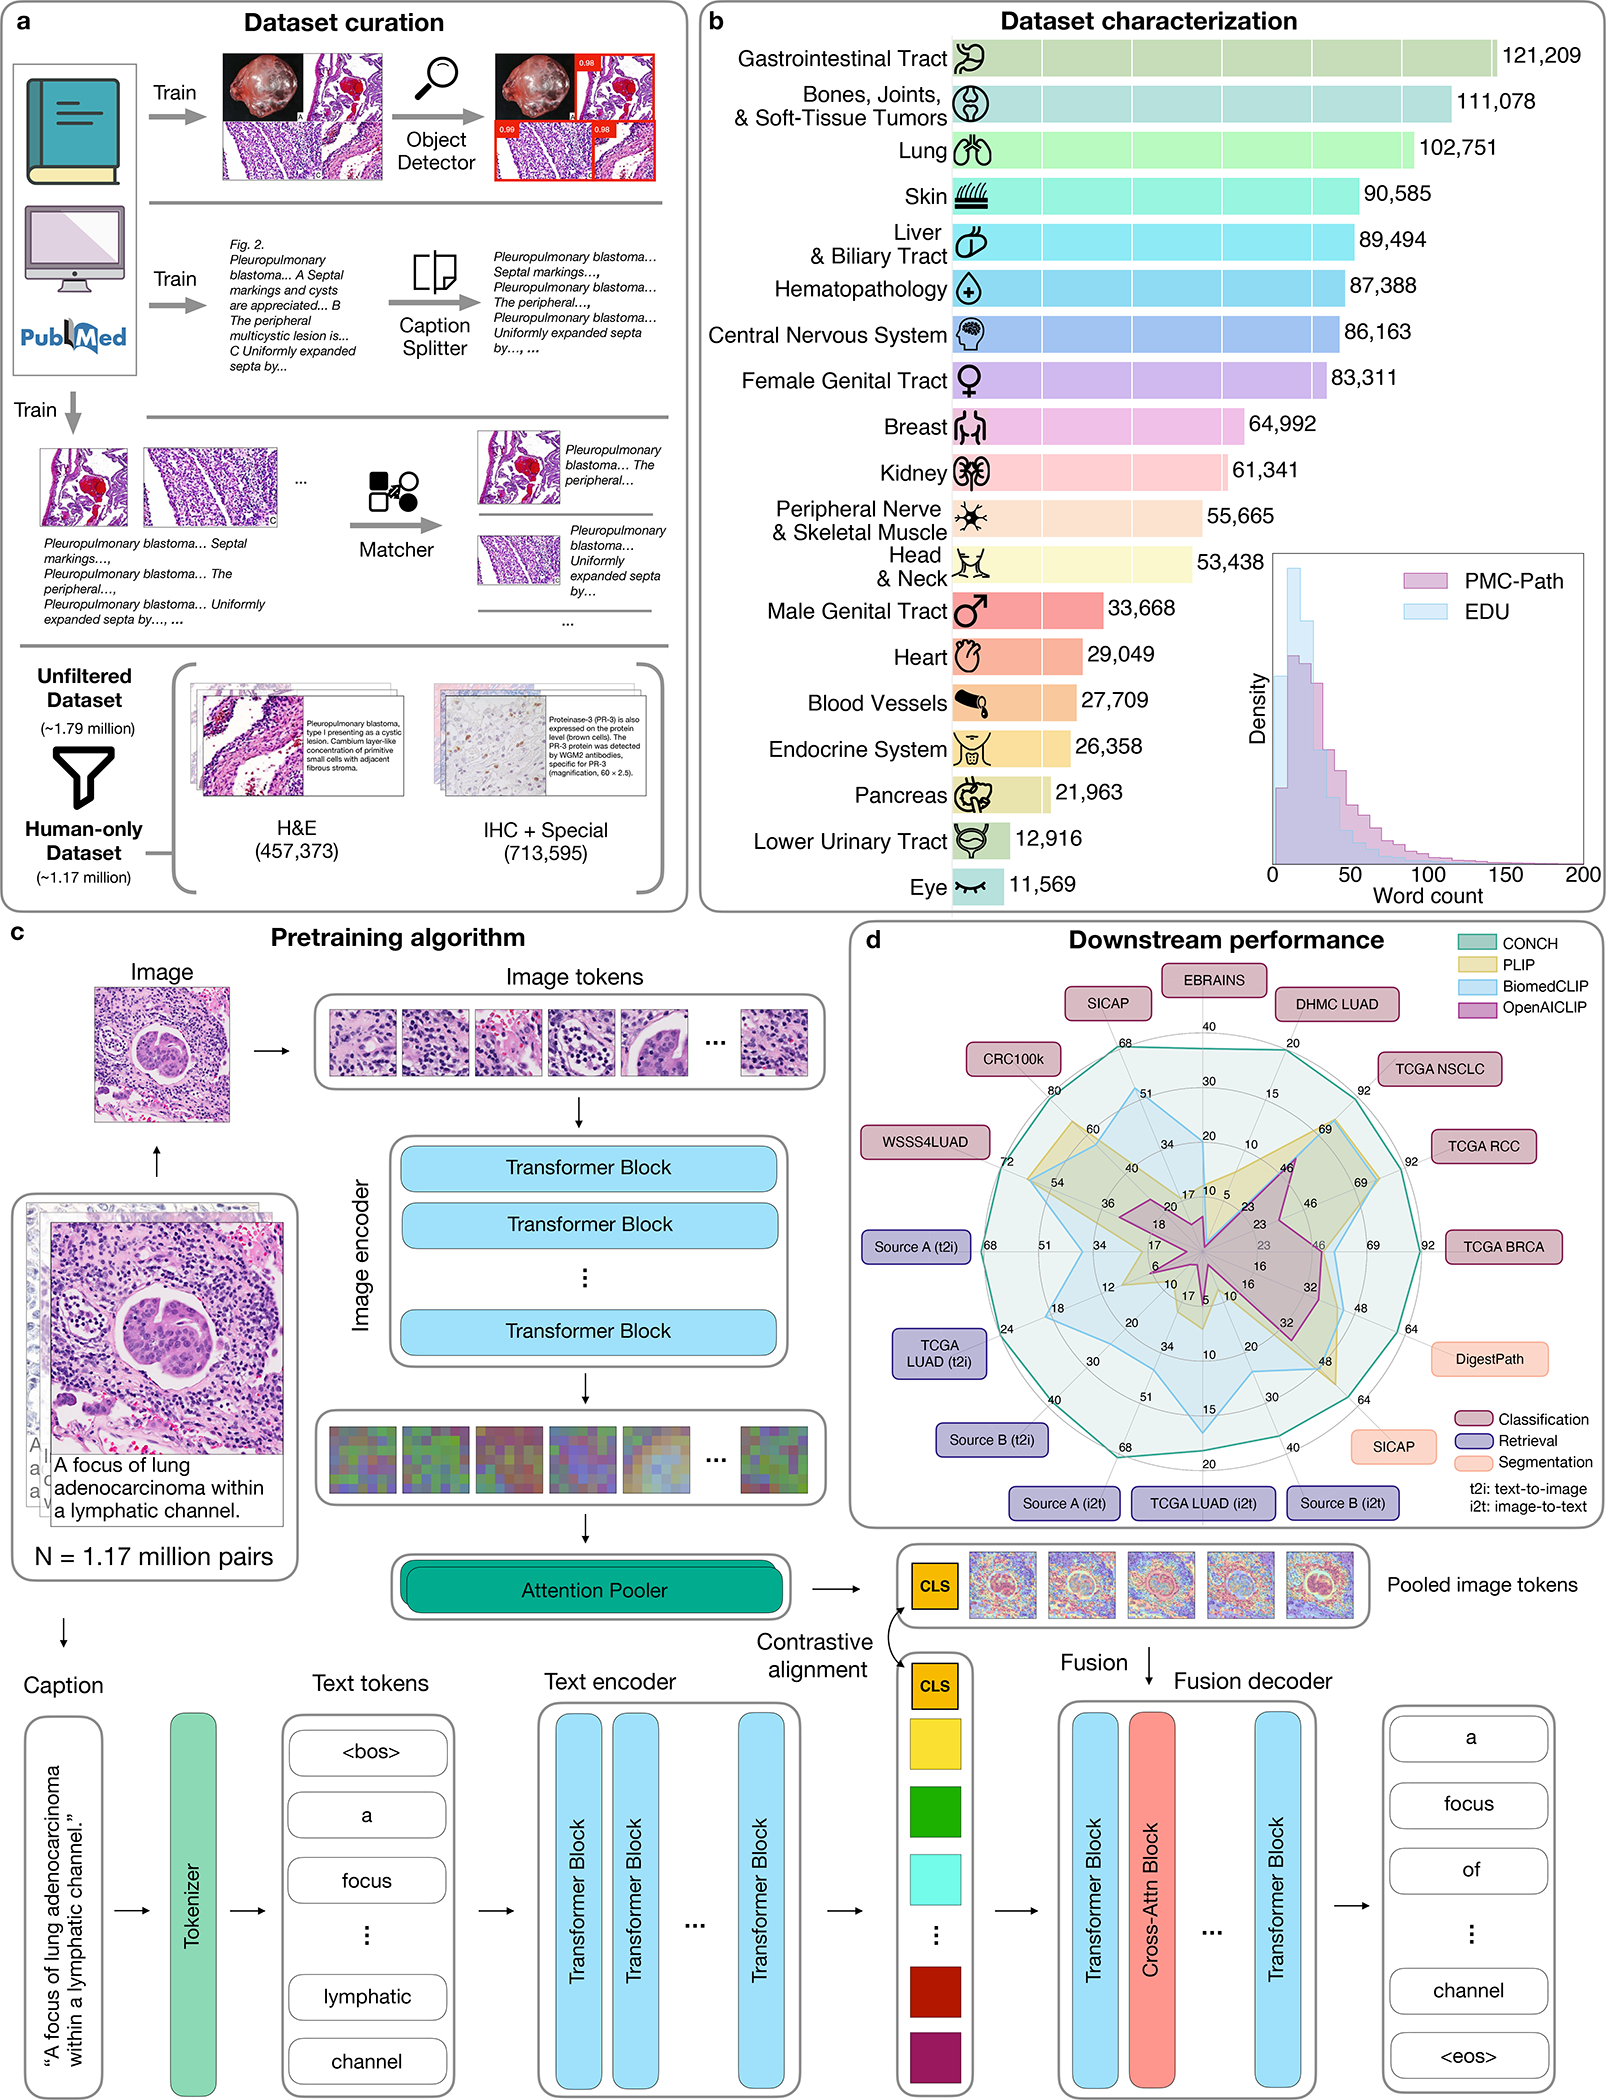
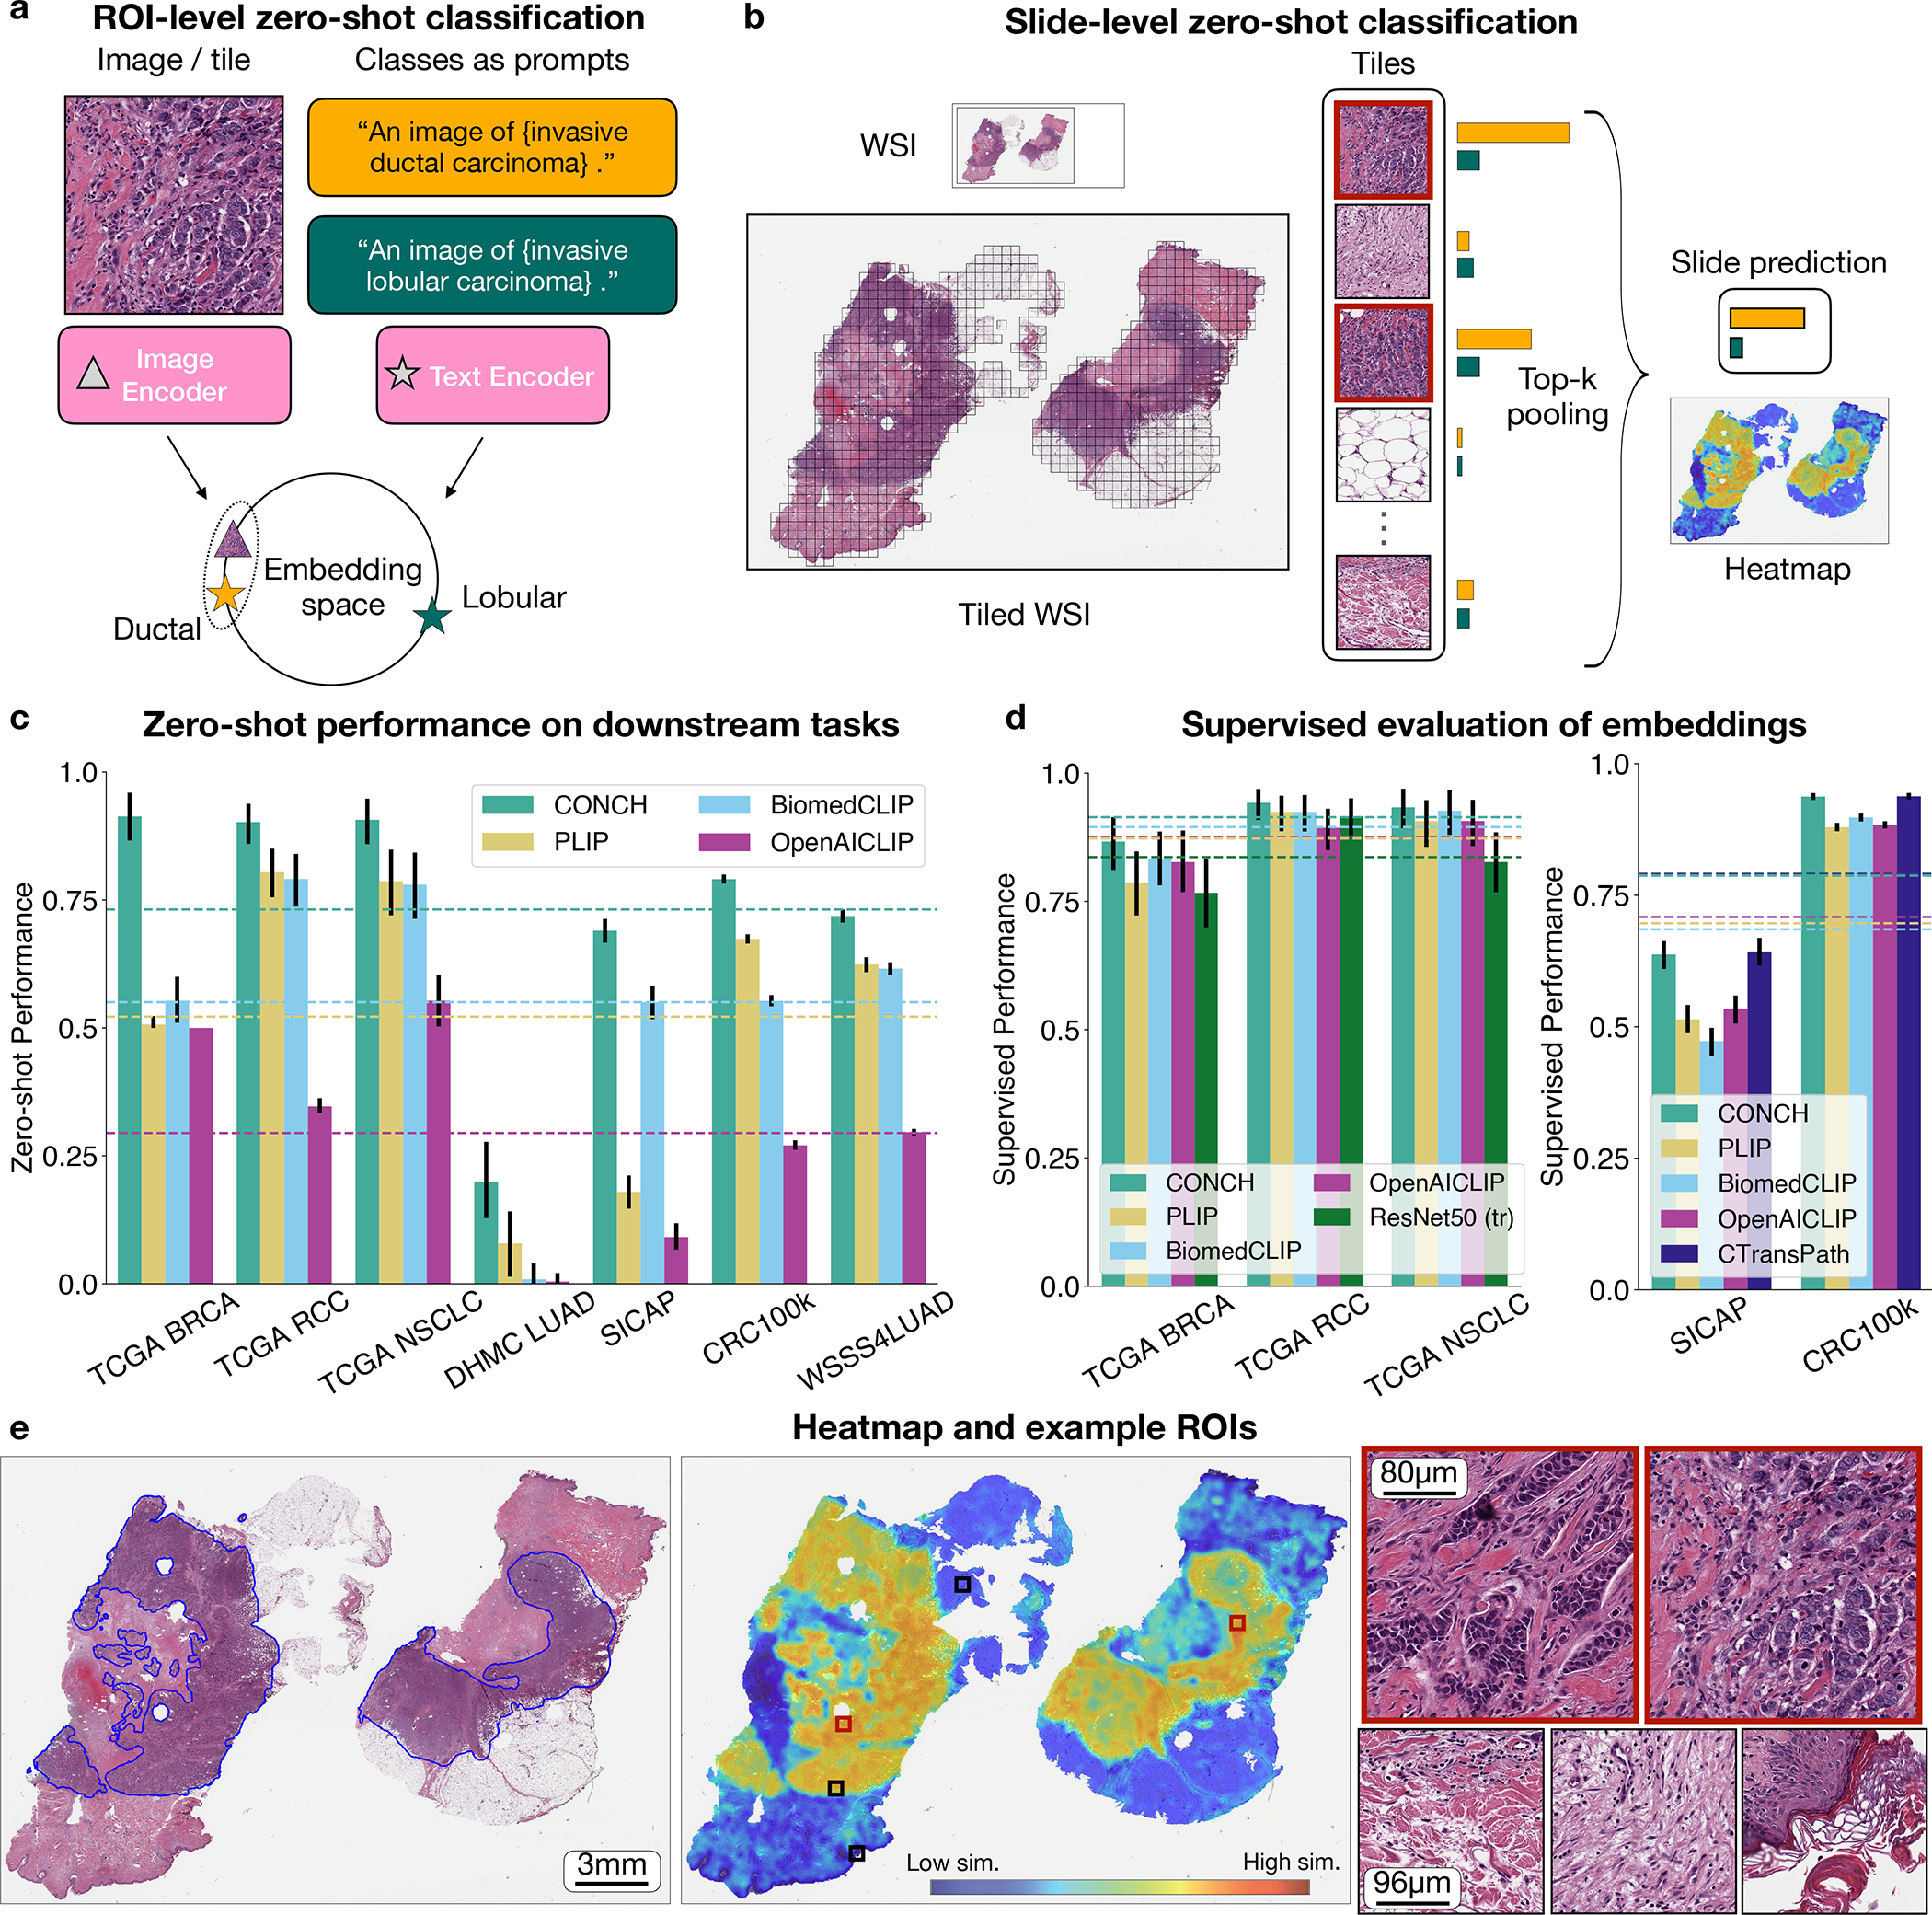
The accelerated adoption of digital pathology and advances in deep learning have enabled the development of robust models for various pathology tasks across a diverse array of diseases and patient cohorts. However, model training is often difficult due to label scarcity in the medical domain, and a model's usage is limited by the specific task and disease for which it is trained. Additionally, most models in histopathology leverage only image data, a stark contrast to how humans teach each other and reason about histopathologic entities. We introduce CONtrastive learning from Captions for Histopathology (CONCH), a visual-language foundation model developed using diverse sources of histopathology images, biomedical text and, notably, over 1.17 million image-caption pairs through task-agnostic pretraining. Evaluated on a suite of 14 diverse benchmarks, CONCH can be transferred to a wide range of downstream tasks involving histopathology images and/or text, achieving state-of-the-art performance on histology image classification, segmentation, captioning, and text-to-image and image-to-text retrieval. CONCH represents a substantial leap over concurrent visual-language pretrained systems for histopathology, with the potential to directly facilitate a wide array of machine learning-based workflows requiring minimal or no further supervised fine-tuning.


Conflict of interest statement

Competing interests

M.Y.L., B.C., R.J.C. and F.M. are inventors on a provisional US patent (application number 63/610,645) filed corresponding to the methodological aspects of this work.

Figures

Extended Data Fig. 1 |
Extended Data Fig. 1 |. Caption content of pre-training dataset.
Wordclouds of captions to qualitatively visualize the caption content of each category in the pretraining dataset. Larger words are more represented in the captions. Common articles, nouns, and verbs are ignored.
Extended Data Fig. 2 |
Extended Data Fig. 2 |. Zero-shot classification: single prompt vs. ensembling.
a-d, slide-level tasks. e, ROI-level tasks. We compare using a single text prompt per class vs. ensembling over multiple class names and templates. Since zeroshot performance of a visual-language pretrained model can be sensitive to the prompts used when using a single prompt per class, for each class, we independently randomly sample a prompt from the pool of candidate templates and class names (see Supplementary Data Tables 34–38 for the prompt pools). We randomly sample 50 sets of prompts for each task, and plot the resulting distribution of zero-shot performance for each model using boxplot. Each dot corresponds to a single set of prompts (n = 50 for each box). Boxes indicate quartile values, and whiskers extend to data points within 1.5 × the interquartile range. Triangles indicate the performance of prompt ensembling. For slidelevel tasks, we show performance for all Ks used in top-K pooling. We observe prompt ensembling can substantially boost performance (relative to the median performance of randomly sampled single prompts) for most models in most tasks, except when the median performance is near random chance, such as for OpenAICLIP on most tasks and PLIP on TCGA BRCA. The poor median performance in these scenarios indicates that the model fails to perform under the majority of prompts sampled and therefore it is unsurprising that the ensembled prompt performs equally bad or worse. See Supplementary Data Tables 1–14 for more results.
Extended Data Fig. 3 |
Extended Data Fig. 3 |. CONCH heatmaps, renal cell carcinomas.
Pathologist annotated H&E images, corresponding cosine-similarity heatmaps of, from top to bottom, papillary, chromophobe, and clear cell renal cell carcinomas. Tiles of high similarity (red border) and low similarity (black border) with the predicted class label are randomly sampled and displayed next to each heatmap. We find excellent agreement between the annotated image and the regions of the slide with high similarity, with the tiles demonstrating stereotypical morphology of the tumors within the high-similarity regions and stroma or other normal constituents of the kidney in the low similarity regions.
Extended Data Fig. 4 |
Extended Data Fig. 4 |. CONCH heatmaps, non-small cell lung carcinomas.
Pathologist-annotated H&E images, corresponding cosine-similarity heatmaps of adenocarcinoma (top) and squamous cell carcinoma (bottom) of the lung. Tiles of high similarity (red border) and low similarity (black border) with the predicted class label are randomly sampled and displayed next to each heatmap. We find excellent agreement between the annotated image and the regions of the slide with high similarity, with the tiles demonstrating stereotypical morphology of the tumors within the high-similarity regions and stroma or other normal constituents of the lung in the low similarity regions.
Extended Data Fig. 5 |
Extended Data Fig. 5 |. CONCH heatmap, lobular carcinoma of the breast.
Pathologist-annotated H&E image, corresponding cosine-similarity heatmap of lobular carcinoma of the breast. Tiles of high similarity (red border) and low similarity (black border) with the predicted class label are randomly sampled and displayed next to the heatmap. As with the ductal carcinoma heatmap in Fig. 2e, we find excellent agreement between the annotated image and the regions of the slide with high similarity, with the tiles demonstrating stereotypical morphology of lobular caricnoma within the high-similarity regions and stroma or other normal constituents of the breast in the low similarity regions.
Extended Data Fig. 6 |
Extended Data Fig. 6 |. ROI-level few-shot classification experiments.
a, b. We investigate the label efficiency of different visual-language pretrained encoders in the few-shot setting where we vary the number of training labels per class (nc), for nc=1,2,4,8,16,... up to 512. For each nc, we sample 5 different sets of training examples and perform linear probing on each training set using associated image labels (see Supervised classification experiments for details). We show their individual model performance via boxplot (i.e., n = 5 for each box) to study the variance in model performance when performing supervised learning with very few training examples. Boxes indicate quartile values and whiskers extend to data points within 1.5 × the interquartile range. For reference, the zero-shot performance of each model is shown as a dotted line on the same plot. In terms of few-shot supervised learning, CONCH achieves better performance (i.e. in terms of the median accuracy of 5 runs) than other encoders for different sizes of training set and for all tasks. Additionally, in SICAP, we find CONCH zero-shot performance to be competitive with PLIP and BiomedCLIP few-shot up to 64 labels per class.
Extended Data Fig. 7 |
Extended Data Fig. 7 |. Rare disease classification results on EBRAINS.
a. Weakly-supervised ABMIL performance for CONCH and other pretrained encoder models on the EBRAINS 30-class brain tumor subtyping task (n = 573). Error bars represent 95% confidence intervals; the center is the computed value of balanced accuracy. b. We investigate the label efficiency of different pretrained encoders in the few-shot setting where we vary the number of training labels per class (nc), for nc{1,2,4,8,16}. For each nc, we sample 5 different sets of training examples and follow the experimental protocol in a to train an ABMIL model on each training set using associated slide labels (see Supervised classification experiments for details). We show their individual model performance via boxplot (i.e., n = 5 for each box) to study the variance in model performance when performing supervised learning with very few training examples. Boxes indicate quartile values and whiskers extend to data points within 1.5 × the interquartile range. For reference, the zero-shot performance of each model is shown as a dotted line on the same plot. Additional metrics are reported in Supplementary Data Table 20 – 21. We find that CONCH consistently outperform all other visual language pretrained models in zeroshot classification and all pretrained encoders in weakly-supervised learning in terms of both performance and label efficiency.
Extended Data Fig. 8 |
Extended Data Fig. 8 |. Additional Retrieval Examples.
Retrieved examples (among top 10) using complex prompts with detailed morphological information. Images are from an in-house dataset of tiles sampled from 1,620 cases held-out during pretraining, spanning 108 OncoTree codes (5 for each code). Similarity scores between each image and prompt are shown in the top-right corner of each image.
Extended Data Fig. 9 |
Extended Data Fig. 9 |. Image captioning results.
a. Captioning performance of CONCH and baselines fine-tuned on Source A (train n=558, validation n=77, test n=162). The METEOR and ROUGE metrics are both calculated to evaluate the quality of generated captions. Captions were generated using top-K sampling with K=50 as the decoding strategy. Error bars representing 95% confidence intervals; the center is the computed value of each metric indicated by the x-axis label. CONCH outperforms both GIT baselines with p < 0.01. Although our absolute performance on these metrics is not ideal, image captioning is a considerably more difficult task than classification and retrieval, and we show that our pretraining data and approach can significantly improve performance over general visual-language models. b. Examples of captions generated by CONCH considered by a pathologist to be high quality. The green text boxes show generated captions and gray text boxes show captions corrected by a pathologist. c. Examples of partially correct captions generated by CONCH. Reasonably correct portions of the generated caption are highlighted in blue. In general, we noticed that some of the generated captions are regurgitated verbatim from the training dataset, likely due to the limited scale of fine-tuning (training split: n=558). Given that our current pretraining scale is still relatively small compared to works in the general visual-language domain, we expect the fine-tuned captioning performance to potentially improve substantially with more high-quality training data.
Extended Data Fig. 10 |
Extended Data Fig. 10 |. CONCH pretraining ablations.
In a, b, error bars represent 95% confidence intervals and the centres correspond to computed values of each metric as specified by the legend (left) or the y-axis label (middle, right). a. Comparison between CONCH pretrained on human-only data (n = 1,170,647) using CoCa vs. human-only data using CLIP vs. H&E only data (n = 457,372) vs. the full unfiltered dataset (n = 1,786,362). Left. Zero-shot performance on downstream subtyping (TCGA BRCA, n = 150; TCGA RCC, n = 225; TCGA NSCLC, n = 150; DHMC LUAD, n = 143; CRC100k, n = 7, 180; WSSS4LUAD, n = 4, 693) and grading (SICAP, n = 2, 122) tasks. Following pre-established conventions, quadratically weighted Cohen’s κ is reported for SICAP and Cohen’s κ is reported for DHMC LUAD, while balanced accuracy is reported for all other tasks. CONCH performs the best on average. Middle and right. Model performance in cross-modal retrieval on 3 datasets of image-text pairs (Source A, n = 797; Source B, n = 1,755; TCGA LUAD, n = 165). CONCH (CLIP) performs the best on average. b. Comparison between CONCH and no domain-specific unimodal pretraining. CONCH (No vision pretraining) replaces the image encoder pretrained on histopathology image patches with an analogous encoder pretrained on ImageNet. CONCH (No language pretraining) initializes the text encoder randomly instead of pretraining on pathology-related text. Left. Zeroshot performance on subtyping and grading tasks. Middle and right. Crossmodal retrieval performance.
Fig. 1 |
Fig. 1 |. Data curation and model schematic.
a, Automated data cleaning pipeline. Educational sources (EDU) and parts of the PubMed Central Open Access Dataset (PMC OA) were manually cleaned and used to train an object detector to detect histopathology images, a language model to split captions referring to multiple images and a matching model to match detected images to their corresponding captions. The cleaning process yielded a dataset of 1.79 million image–text pairs, and we then filtered out pairs referring to nonhumans to create our CONCH (human-only) pretraining dataset of 1.17 million (see Methods for details on data cleaning and Discussion on ablation experiments investigating data filtering). b, Estimated distribution of image–text pairs in the human-only pretraining dataset by topic. Note that pretraining data cover a diverse range of pathology topics. Inset, comparison of the distribution of caption lengths between PMC-Path and EDU (see Extended Data Fig. 1 for wordclouds of captions from each category). c, Visual-language pretraining setup. CONCH consists of an image encoder, a text encoder and a multimodal text decoder. The pretraining process uses both contrastive and captioning objectives. The contrastive objectives align the image and text encoders by maximizing the cosine-similarity scores between paired image and text embeddings, while the captioning objective maximizes the likelihood of generating the correct text conditioned on the image and previously generated text (see Methods for details). <bos>, beginning of sentence; attn, attention; <eos>, end of sentence. d, Radar plot comparing the performance of CONCH and baselines on various downstream tasks. CONCH outperforms baselines by a significant margin on a diverse set of tasks spanning zero-shot classification, retrieval and zero-shot segmentation (see Results for detailed descriptions of each task and metric).
Fig. 2 |
Fig. 2 |. Zero-shot and supervised classification.
a, Schematic of zero-shot classification using contrastively aligned image and text encoders. A prompt is constructed for each class, and the image is classified according to the prompt whose embedding is closest to that of the image in the shared embedding space. b, Zero-shot classification of WSIs. Each WSI is divided into tiles and processed as in a. The similarity scores for tiles are aggregated using top-K pooling to form slide-level similarity scores, the highest of which corresponds to the slide-level prediction. In c,d, dashed lines represent the average over tasks. Error bars represent 95% confidence intervals, and the centers correspond to computed values of each metric, as specified below. c, Zero-shot performance on downstream subtyping (TCGA BRCA, n = 150; TCGA RCC, n = 225; TCGA NSCLC, n = 150; DHMC LUAD, n = 143; CRC100k, n = 7,180; WSSS4LUAD, n = 4,693) and grading (SICAP, n = 2,122) tasks. Cohen’s κ is reported for DHMC LUAD and quadratically weighted Cohen’s κ is reported for SICAP, while balanced accuracy is reported for all other tasks. Additional metrics are reported in Supplementary Tables 1–7. d, Supervised evaluation of embeddings of each model. Linear probing is used for ROI-level tasks (CRC100k and SICAP), while ABMIL is used for slide-level tasks, with the same metrics reported as in c (see Supplementary Tables 15–19 for more detailed results). e, From left to right: pathologistannotated IDC, corresponding heatmap and selected tiles at higher power. The heatmap is colored on the basis of the cosine-similarity score between each tile within the slide and the text prompt corresponding to the predicted class label. We find excellent agreement between the annotated image and high-similarity regions, with the tiles demonstrating classic IDC morphology within the highsimilarity (high sim.) regions and stroma or other normal constituents of the breast in the low-similarity (low sim.) regions.
Fig. 3 |
Fig. 3 |. Slide-level few-shot classification experiments.
ac, We investigated the label efficiency of different visual-language pretrained encoders in the few-shot setting where we varied the number of training labels per class (nc), for nc=1,2,4,8,16... until we reached the maximum number of available labels in the training set. For each nc, we sampled five different sets of training examples and trained a weakly supervised ABMIL model on each training set using slidelevel labels (see Methods, ‘Supervised and weakly supervised classification experiments’ for details). We show their individual model performance for BRCA subtyping (a), RCC subtyping (b) and NSCLC subtyping (c) by boxplot (n = 5 for each box) to study the variance in model performance when performing supervised learning with very few training examples. Boxes indicate quartile values and whiskers extend to data points within 1.5× the interquartile range. For reference, the zero-shot performance of each model is shown as a dashed line on the same plot. In terms of few-shot supervised learning, CONCH achieves better performance (in terms of the median accuracy of five runs) than other encoders for different sizes of training set and for all tasks. Additionally, the zero-shot performance of CONCH is surprisingly competitive, exceeding the few-shot performance of PLIP, BiomedCLIP and OpenAICLIP with up to 64 labels per class in the case of BRCA and NSCLC subtyping. Sup., supervised learning.
Fig. 4 |
Fig. 4 |. Zero-shot cross-modal retrieval.
a, Model performance in cross-modal retrieval was evaluated on three datasets of image–text pairs (source A, n = 797; source B, n = 1,755; TCGA LUAD, n = 165). Similarity in the embedding space was computed between the query image and all text samples in the database. The top-K most similar texts were retrieved. We report Recall@K for K{1,5,10} and the mean recall, which averages over K. We show both text-to-image (top row) and image-to-text (bottom row) retrieval for each retrieval task (columns). The rightmost column reports the average across tasks for each metric. CONCH outperforms other baselines on all retrieval tasks. Error bars indicate 95% confidence intervals. b, Schematic for zero-shot image-to-text retrieval (the text-to-image direction is analogous). c, Examples of images in the top five retrieved results from TCGA LUAD using LUAD-relevant queries with cosine-similarity scores shown in the top-right corner. Examples of other datasets using more diverse queries are shown in Extended Data Fig. 7. In general, we found that the images retrieved by the model matched what was described in the text prompt.
Fig. 5 |
Fig. 5 |. Zero-shot segmentation.
a, Schematic illustrating zero-shot segmentation on WSIs (or large tissue sections). To perform segmentation, we divided each WSI into tiles and used zero-shot classification to predict the label of each tile. The tile-level predictions were stitched together to form the predicted segmentation mask. b,c, Zero-shot segmentation performance of CONCH and baselines on SICAP (n = 31) (b) and DigestPath (n = 250) (c) datasets. The macroaveraged Dice score, precision and recall are reported. Error bars represent 95% confidence intervals. d,e, Examples of CONCH segmentation prediction on WSIs for SICAP (d) and DigestPath (e). The left panel shows the ground truth, and the right panel shows the predicted segmentation mask, with example regions enlarged. Red and blue indicate tumor and normal tissue, respectively. In general, in these examples, CONCH displays excellent sensitivity to tumor regions with slightly lower specificity, although most of the regions that CONCH segments as tumor that are in fact nontumor are adjacent to cancerous glands or contain cancer-associated stroma for both SICAP and DigestPath.

Similar articles

Cited by

References

    1. Song AH et al. Artificial intelligence for digital and computational pathology. Nat. Rev. Bioeng. 1, 930–949 (2023).
    1. Bera K, Schalper KA, Rimm DL, Velcheti V & Madabhushi A Artificial intelligence in digital pathology—new tools for diagnosis and precision oncology. Nat. Rev. Clin. Oncol. 16, 703–715 (2019). - PMC - PubMed
    1. Shmatko A, Ghaffari Laleh N, Gerstung M & Kather JN Artificial intelligence in histopathology: enhancing cancer research and clinical oncology. Nat. Cancer 3, 1026–1038 (2022). - PubMed
    1. Lipkova J et al. Artificial intelligence for multimodal data integration in oncology. Cancer Cell 40, 1095–1110 (2022). - PMC - PubMed
    1. Bejnordi BE et al. Diagnostic assessment of deep learning algorithms for detection of lymph node metastases in women with breast cancer. JAMA 318, 2199–2210 (2017). - PMC - PubMed

LinkOut - more resources