. 2024 Mar;30(3):850-862.
doi: 10.1038/s41591-024-02857-3. Epub 2024 Mar 19.

Towards a general-purpose foundation model for computational pathology

Affiliations

Towards a general-purpose foundation model for computational pathology

Richard J Chen et al. Nat Med. 2024 Mar.

Abstract

Quantitative evaluation of tissue images is crucial for computational pathology (CPath) tasks, requiring the objective characterization of histopathological entities from whole-slide images (WSIs). The high resolution of WSIs and the variability of morphological features present significant challenges, complicating the large-scale annotation of data for high-performance applications. To address this challenge, current efforts have proposed the use of pretrained image encoders through transfer learning from natural image datasets or self-supervised learning on publicly available histopathology datasets, but have not been extensively developed and evaluated across diverse tissue types at scale. We introduce UNI, a general-purpose self-supervised model for pathology, pretrained using more than 100 million images from over 100,000 diagnostic H&E-stained WSIs (>77 TB of data) across 20 major tissue types. The model was evaluated on 34 representative CPath tasks of varying diagnostic difficulty. In addition to outperforming previous state-of-the-art models, we demonstrate new modeling capabilities in CPath such as resolution-agnostic tissue classification, slide classification using few-shot class prototypes, and disease subtyping generalization in classifying up to 108 cancer types in the OncoTree classification system. UNI advances unsupervised representation learning at scale in CPath in terms of both pretraining data and downstream evaluation, enabling data-efficient artificial intelligence models that can generalize and transfer to a wide range of diagnostically challenging tasks and clinical workflows in anatomic pathology.


Figures

Extended Data Fig. 1:
Extended Data Fig. 1:. Few-shot slide classification.
To study the label efficiency of UNI in slide classification, we compare UNI with other pretrained encoders on: a. breast metastasis detection in CAMELYON16, b. NSCLC subtyping in CPTAC (trained on TCGA) c. RCC subtyping in CPTAC-DHMC (trained on TCGA), d. RCC subtyping in DHMC, e. BRCA coarse-grained subtyping in BRACS, f. BRCA fine-grained subtyping in BRACS, g. CRC screening in HunCRC, h. Prostate ISUP Grading in PANDA, i. glioma IDH1 prediction in EBRAINS (trained on TCGA), j. glioma histomolecular subtyping in EBRAINS (trained on TCGA), k. brain tumor coarse-grained subtyping in EBRAINS, l. brain tumor fine-grained subtyping in EBRAINS, and m. heart transplant assessment in BWH-EMB. The performance is measured across different few-shot settings with K ∈ 1, 2, 4, 8, 16, 32 training examples used per class. Boxes indicate quartile values of model performance (n = 5 runs) and whiskers extend to data points within 1.5 × the interquartile range. Overall, we observe that UNI consistently demonstrates superior label efficiency over other baselines.
Extended Data Fig. 2:
Extended Data Fig. 2:. Comparing supervised performance on PRAD tissue classification in AGCC.
Qualitative illustrations comparing UNI to CTransPath, REMEDIS, and ResNet-50 (IN) via KNN probing on PRAD tissue classification in AGCC. UNI achieves better accuracy (acc.) on all three examples. The reported results are based on partial annotations (left-most panel) provided by pathologists.
Extended Data Fig. 3:
Extended Data Fig. 3:. ROI retrieval.
We evaluate content-based image retrieval for ROI-level classes with at least 5 classes, for a. CRC tissue classification in CRC-100K, b. CRC tissue classification in HunCRC, c. ESCA subtyping on CHA (trained on UKK, WNS and TCGA), d. PRAD tissue classification in AGGC, e. CRC polyp classification in UniToPatho, and f. pan-cancer tissue classification in TCGA, and. UNI consistently outperforming all pretrained encoders. Error bars represent 95% confidence intervals and the center is the computed value of the corresponding retrieval metric. Detailed performance metrics are further provided in Supplementary Tables 63–68.
Extended Data Fig. 4:
Extended Data Fig. 4:. ROI classification across different image resolutions.
To assess how image resolution affects performance, we compare UNI and other baselines on various resized and center-cropped ROIs for a. BRCA subtyping and b. CRC polyp classification tasks. The original image sizes are 2048 × 1536 and 1812 × 1812 pixels, respectively. All models are evaluated on linear, SimpleShot (1-NN), and KNN (20-NN) probe settings. UNI consistently outperforms all baselines across all resolutions. The performance metrics are further provided in Supplementary Tables 45, 46, 51, 52.
Extended Data Fig. 5:
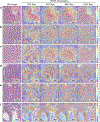
Extended Data Fig. 5:. Multi-head self-attention (MHSA) heatmap visualization of UNI across different image resolutions in BRCA Subtyping in BACH.
Each colored square represents a 16 × 16 patch token encoded by UNI, with heatmap color corresponding to the attention weight of that patch token to the global [CLS] token of the penultimate layer in UNI. We show MHSA visualizations for resized and center-cropped ROIs at 2242, 4482, 8962, 1,3442 resolutions for the a. normal, b. benign, c. in situ, and d. invasive classes in BACH. In each, the left-most image is the original H&E ROI and the right four images are the MHSA visualizations. For comparative purposes, we resize all images within the figure to have the same dimension, but note that at higher resolutions, each colored square has an original image resolution of 16 × 16 pixels at 0.42 mpp. As the resolution increases, the heatmaps demonstrate increasing and increasingly fine-grained attention focused on epithelial structures, with relatively lower attention on stroma or other background, neither of which are contributory to the diagnoses in these ROIs.
Extended Data Fig. 6:
Extended Data Fig. 6:. Multi-head self-attention (MHSA) heatmap visualization of UNI across different image resolutions for CRC polyp classification in UniToPatho.
Each colored square represents a 16 × 16 patch token encoded by UNI, with heatmap color corresponding to the attention weight of that patch token to the global [CLS] token of the penultimate layer in UNI. We show MHSA visualizations for resized and center-cropped ROIs at 2242, 4482, 8962, 17922 resolutions for a. normal tissue, b. hyperplastic polyp, c. tubular adenoma with low-grade dysplasia, d. tubular adenoma with high- grade dysplasia, e. tubulo-villous adenoma with high-grade dysplasia, and f. tubulo-villous adenoma with low-grade dysplasia. In each, the left-most image is the original H&E ROI and the right four images are the MHSA visualizations. For comparative purposes, we resize all images within the figure to have the same dimension, but note that at higher resolutions, each colored square has an original image resolution of 16 × 16 pixels at 0.48 mpp. As resolution increases, the heatmaps demonstrate increasing and increasingly fine-grained attention focused on the crypts, in all cases except the hyperplastic polyp in b, focusing on areas a pathologist would use to make the diagnosis.
Extended Data Fig. 7:
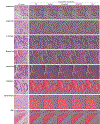
Extended Data Fig. 7:. Visualizing segmentation results in SegPath.
Using the Mask2Former head, we visualize the tissue segmentation of each class in SegPath created by all pretrained encoders. Overall, we find that UNI is competitive with convolutional and hierarchical models like CTransPath and REMEDIS in matching the segmentation masks obtained via immunofluorescence and DAPI nuclear staining.
Extended Data Fig. 8:
Extended Data Fig. 8:. Few-shot ROI classification using class prototypes.
Similar to slide-level classification, we also assess the label efficiency of UNI on ROI-level tasks, and observe superior label efficiency of UNI on most tasks except CRC tissue classification on HunCRC. We evaluate all pretrained encoders using the nonparametric SimpleShot framework for a. CRC tissue classification in CRC-100K, b. Breast metastasis detection in CAMELYON17-WILDS, c. RCC tissue classification on HEL (trained on TCGA), d. BRCA subtyping in BACH, e. CRC tissue classification in HunCRC, f. ESCA subtyping on CHA (UKK+WNS+TCGA), g. PRAD tissue classification in AGGC, h. CRC polyp classification in UniToPatho, i. CRC MSI screening in TCGA, j. pan-cancer tissue classification in TCGA, and k. pan-cancer TIL detection in TCGA. The performance is measured across different few-shot settings with K ∈ 1, 2, 4, 8, 16, 32, 64, 128, 256 training examples used per class (or support set size). Boxes indicate quartile values of model performance (n = 1000 runs) and whiskers extend to data points within 1.5 × the interquartile range. We adapt the SimpleShot framework for slide-level classification, called ‘MI- SimpleShot’. ROI class prototypes are constructed by averaging the pre-extracted ROI features for each class using the ‘TCGA Uniform Tumor’ dataset, which we use as ‘prompts’ for assigning the slide-level label. We assess and compare the few-shot performance of all pretrained encoders on NSCLC subtyping (a) and RCC subtyping task (b), using the same runs (n = 5) in the few-shot setting for ABMIL for K ∈ 1, 2, 4, 8, 16, 32 training examples used per class. We compare performance of top-5 and top-50 pooling of nearest patches in the test set, as well as show performance on both the internal test fold in TCGA and external cohort. Boxes indicate quartile values of model performance (n = 5 runs) and whiskers extend to data points within 1.5 × the interquartile range. Overall, we observe that the formed prototypes by UNI can be used to classify slides based on the MI-SimpleShot frame- work. a. On NSCLC subtyping, we observe that 2-shot and 4-shot performance from UNI outperforms the 32-shot performance of all other models. b. On RCC subtyping, 1-shot performance of UNI also outperforms the 32-shot performance of other models. We also observe that MI-SimpleShot can be combined with other pretrained encoders as well, but generally require more annotated ROIs for creating prototypes.
Extended Data Fig. 9:
Extended Data Fig. 9:. Few-shot slide classification using class prototypes.
We adapt the SimpleShot framework for slide-level classification, called ‘MI- SimpleShot’. ROI class prototypes are constructed by averaging the pre-extracted ROI features for each class using the ‘TCGA Uniform Tumor’ dataset, which we use as ‘prompts’ for assigning the slide-level label. We assess and compare the few-shot performance of all pretrained encoders on NSCLC subtyping (a) and RCC subtyping task (b), using the same runs (n = 5) in the few-shot setting for ABMIL for K ∈ 1, 2, 4, 8, 16, 32 training examples used per class. We compare performance of top-5 and top-50 pooling of nearest patches in the test set, as well as show performance on both the internal test fold in TCGA and external cohort. Boxes indicate quartile values of model performance (n = 5 runs) and whiskers extend to data points within 1.5 × the interquartile range. Overall, we observe that the formed prototypes by UNI can be used to classify slides based on the MI-SimpleShot frame- work. a. On NSCLC subtyping, we observe that 2-shot and 4-shot performance from UNI outperforms the 32-shot performance of all other models. b. On RCC subtyping, 1-shot performance of UNI also outperforms the 32-shot performance of other models. We also observe that MI-SimpleShot can be combined with other pretrained encoders as well, but generally require more annotated ROIs for creating prototypes.
Extended Data Fig. 10:
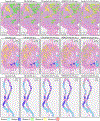
Extended Data Fig. 10:. Comparing 1-shot similarity heatmaps of pretrained encoders with class prototype.
We compare the similarity heatmaps of all pretrained encoders using annotated ROIs from a single slide per class for forming class prototypes in MI-SimpleShot (with top-5 pooling) on NSCLC subtyping (a) and RCC subtyping task (b), with top visualizing example ROIs used for each class, and bottom showing similarity heatmaps. Outlined in blue are pathologist annotations of ROIs that match the label of the histology slide. Similarity heatmaps are created with respect to the class prototype of the correct slide label (indicated in green), with a indicating a correct prediction and ✗ indicating incorrect prediction. Note that since the visualizations are created with respect to the ground truth label, the model may retrieve correct patches that match pathologist annotations but still misclassify the slide. a. On a LUAD slide, we observe strong agreement of the pathologist’s annotations with retrieved LUAD patches by UNI. Although retrieved patches by REMEDIS also have strong agreement with the pathologist’s annotations, we note that slide was misclassified as LUSC, indicating that the top-5 retrieved patches of the LUSC prototype was higher than that of the LUAD prototype. Vice versa, ResNet-50IN classifies the slide correctly but incorrectly retrieves the correct patches that agree with the pathologist’s annotations, indicating that non-LUAD patches in the slide were more LUAD-like than the pathologist-annotated LUAD patches with respect to the LUAD prototype. The similarity heatmap for CTransPath both misclassified the slide and retried incorrect patches. b. On an CCRCC slide, we observe strong agreement of the pathologist’s annotations with retrieved CCRCC patches by UNI. We observe similar mismatch in predicted class label and retrieved patches, in which REMEDIS classifies the slide correctly but retrieves the incorrect patches, and CTransPath misclassifies the slide but retrieves the correct patches.
Fig. 1:
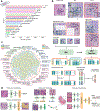
Fig. 1:. Overview of UNI.
UNI is a general-purpose, self-supervised vision encoder for anatomic pathology based on the vision transformer architecture, achieving state-of-the-art performance across 34 clinical tasks in anatomic pathology. a, Slide distribution of Mass-100K, a large-scale and diverse pretraining dataset of 100 million tissue patches sampled from over 100,000 diagnostic WSIs across 20 major organ types. b, UNI is pretrained on Mass-100K using the DINOv2 self-supervised training algorithm, which consists of a mask image modeling objective and a self-distillation objective. c, UNI generally outperforms other pretrained encoders across 34 clinical tasks in anatomical pathology (average performance of the 8 SegPath tasks reported). d, The evaluation tasks consist of ROI-level classification, segmentation, retrieval and prototyping, and slide-level classification tasks. Further details are given in Methods. class., classification; seg., segmentation; det., detection; assess., assessment.
Fig. 2:
Fig. 2:. Slide-level tasks for OT-43 and OT-108, and slide-level task performance.
a, Organ and OncoTree code distribution for the slide-level OT-43 and OT-108 classification tasks. All comparisons with UNI are evaluated on 43-way cancer type classification and 108-way OncoTree code classification tasks with OT-43 and OT-108, respectively. Further details regarding data distribution are provided in Supplementary Table 4. Gen., genitalia; GI, gastrointestinal. b,d, Comparison of macro-averaged AUROC of UNI and other pretrained encoders for OT-43 (b) and OT-108 (d) (n = 1,620 slides each). c,e, Top-1 accuracy of UNI across different pretraining data scales (Mass-1K, Mass-22K, Mass-100K) for OT-43 (c) and OT-108 (e) (n = 1,620 slides each). f, Supervised performance of UNI and its comparisons across 15 weakly supervised slide-level classification tasks. Dashed lines represent the average performance of each model across all tasks. All data are given as balanced accuracy, except for ISUP grading, which is given as quadratic weighted Cohen’s κ. Error bars represent 95% confidence intervals and the centers correspond to computed values of each metric as specified above. Detailed results for all tasks are provided in Supplementary Tables 12–35. Ext., external test set. g–j, Few-shot slide-level performance with K ∈ {1, 2, 4, 8, 16, 32} slides per class reported for four tasks. g, RCC subtyping (train, TCGA; test, CPTAC-DHMC; n = 872 slides). h, BRCA fine-grained subtyping (BRACS, n = 87 slides). i, Brain tumor coarse-grained subtyping (EBRAINS, n = 573 slides). j, ISUP grading (PANDA, n = 954 slides). Boxes indicate quartile values of model performance (n = 5 runs), and whiskers extend to data points within 1.5-fold the interquartile range. Few-shot results for all tasks are given in Extended Data Fig. 1.
Fig. 3:
Fig. 3:. ROI-level tasks.
a, Supervised linear probe performance of UNI and its comparisons across 11 ROI-level classification tasks. All results are given as balanced accuracy except for PRAD tissue classification, which is given as weighted F1 score. Dashed lines represent the average performance of each model across all tasks. Error bars represent 95% confidence intervals and the centers correspond to computed values of each metric as specified above. Detailed results for all tasks are provided in Supplementary Tables 39–60. b, Examples of UNI on ROI classification for PRAD tissue classification in AGGC. Left: ground-truth ROI- level labels overlaid on the WSI. Right: predicted patch labels. ROIs are enlarged for better visualization, with further comparisons shown in Extended Data Fig. 2. c, ROI retrieval performance of UNI on PRAD tissue classification (AGGC, n = 345,021 ROIs). We report Recall@K for K ∈ {1, 3, 5} and the mean recall, with error bars representing 95% confidence intervals and the centers corresponding to computed values of each metric. d, Supervised KNN probe performance of UNI across various image resolutions (res., in pixels) in BRCA subtyping in BACH (n = 80 ROIs). Retrieval performance for all tasks is provided in Extended Data Fig. 3 and Supplementary Tables 63–68. e, Multi-head self-attention (MHSA) heatmap visualization of UNI across different image resolutions (in pixels) in BACH. Each colored square represents a 16 × 16 pixel patch token encoded by UNI, with heatmap color corresponding to the attention weight of that patch token to the global [CLS] (that is, classification) token of the penultimate layer in UNI. Top and bottom, respectively: visualizations for the invasive- and normal-labeled images, with further visualizations and interpretations provided in Extended Data Figs. 4–6. Scale bars: b, ground truth and prediction, 2 mm; prediction(1) and prediction(2), 200 μm; insets, 30 μm; e, ROI image, 32 μm; 2242, 64 pixels; 4482, 128 pixels; 8962, 256 pixels; 1,3442, 384 pixels.
Fig. 4:
Fig. 4:. Few-shot ROI- and slide-level prototyping.
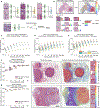
a, Prototypical few-shot ROI classification via SimpleShot. A class prototype is constructed by averaging the extracted features from ROIs of the same class. For a test ROI, SimpleShot assigns the class of the most similar class prototype (smallest Euclidean distance) as the predicted ROI label. b, Prototypical few-shot slide classification via MI- SimpleShot. Using a pre-computed set of ROI-level class prototypes (sharing the same class labels as the slide), MI-SimpleShot predicts the slide label using the class prototype with the highest average similarity of top-K patches queried from the WSI. The similarity heatmap visualizes the similarity between the ground- truth class prototype and each patch in the WSI. ce, Few-shot ROI classification performance via SimpleShot on three tasks, with boxes indicating quartiles of model performance (n = 1,000 runs) and whiskers extending to data points within 1.5-fold the interquartile range. c, Pan-cancer tissue classification (TCGA, n = 55,360 ROIs). d, CRC polyp classification (UniToPatho, n = 2,399 ROIs). e, PRAD tissue classification (AGGC, n = 345,021 ROIs). Few-shot ROI performances for all tasks are provided in Extended Data Fig. 8. f,g, Few-shot slide classification performance and similarity heatmaps via MI-SimpleShot for NSCLC subtyping (train, TCGA; test, CPTAC; n = 1,091 slides) (f) and RCC subtyping (train, TCGA; test, CPTAC-DHMC; n = 872 slides) (g). In both tasks, using pre-extracted features from UNI, we compare MI-SimpleShot in the same few-shot settings as ABMIL (boxes indicate quartile values of model performance with n = 5 runs and whiskers extend to data points within 1.5-fold the interquartile range), and visualize similarity heatmaps and the top-5 similar patches (indicated in red bounding boxes) for a LUSC (f) and CCRCC (g) slide. Scale bars: WSI, 2 mm; top-5 retrieved patches, 56 μm. Further details, comparisons and visualizations are provided in Methods and Extended Data Figs. 8–10.

Similar articles

Cited by

References

    1. Song AH et al. Artificial intelligence for digital and computational pathology. Nat. Rev. Bioeng. 1, 930–949 (2023).
    1. Bera K, Schalper KA, Rimm DL, Velcheti V & Madabhushi A Artificial intelligence in digital pathology: new tools for diagnosis and precision oncology. Nat. Rev. Clin. Oncol. 16, 703–715 (2019). - PMC - PubMed
    1. Lipkova J et al. Artificial intelligence for multimodal data integration in oncology. Cancer Cell 40, 1095–1110 (2022). - PMC - PubMed
    1. Heinz CN, Echle A, Foersch S, Bychkov A & Kather JN The future of artificial intelligence in digital pathology: results of a survey across stakeholder groups. Histopathology 80, 1121–1127 (2022). - PubMed
    1. Coudray N et al. Classification and mutation prediction from non-small cell lung cancer histopathology images using deep learning. Nat. Med. 24, 1559–1567 (2018). - PMC - PubMed

LinkOut - more resources