. 2024 Mar 19;10(1):65.
doi: 10.1038/s41531-024-00672-8.

A topographical atlas of α-synuclein dosage and cell type-specific expression in adult mouse brain and peripheral organs

Collaborators, Affiliations

A topographical atlas of α-synuclein dosage and cell type-specific expression in adult mouse brain and peripheral organs

Haley M Geertsma et al. NPJ Parkinsons Dis. .

Abstract

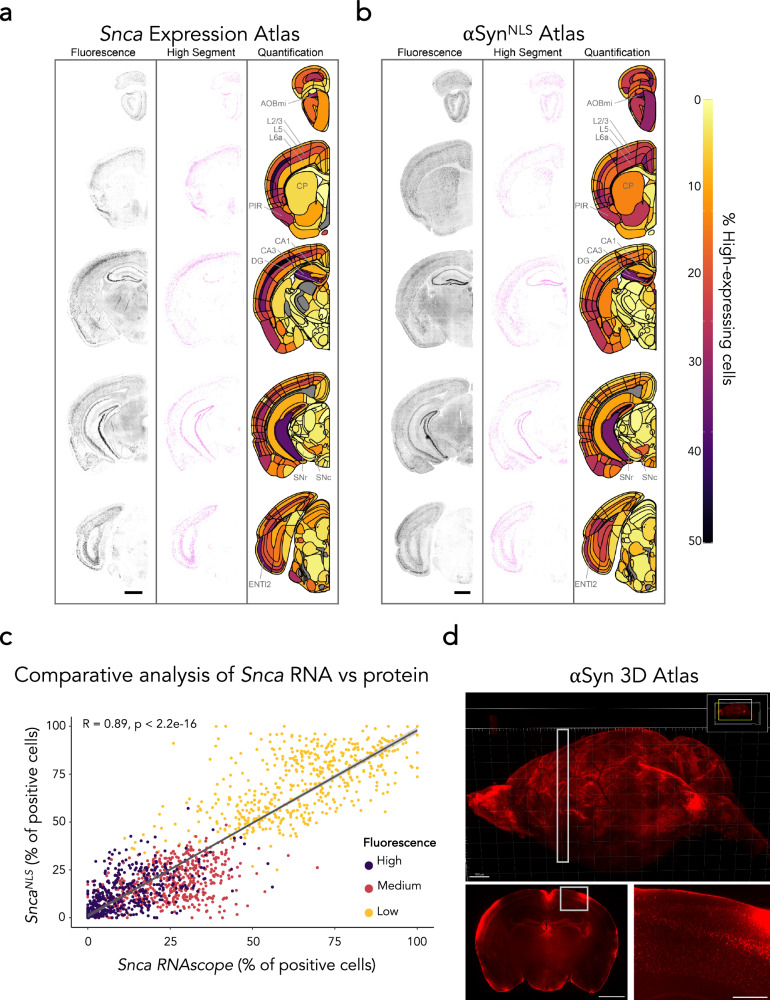
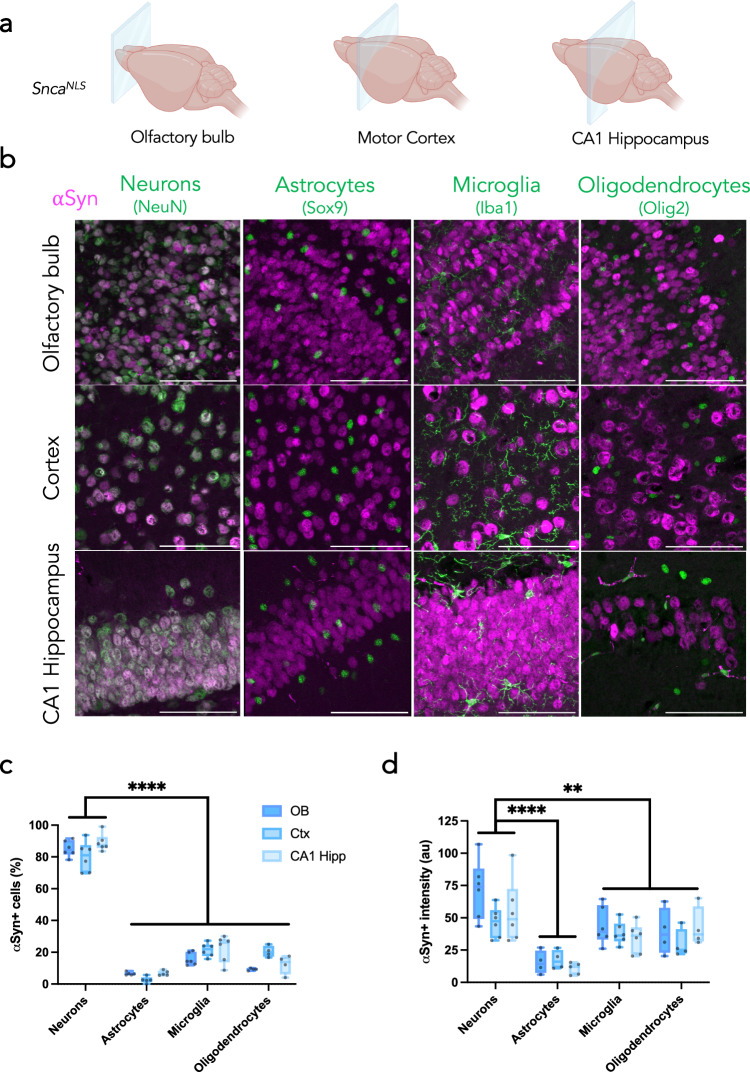
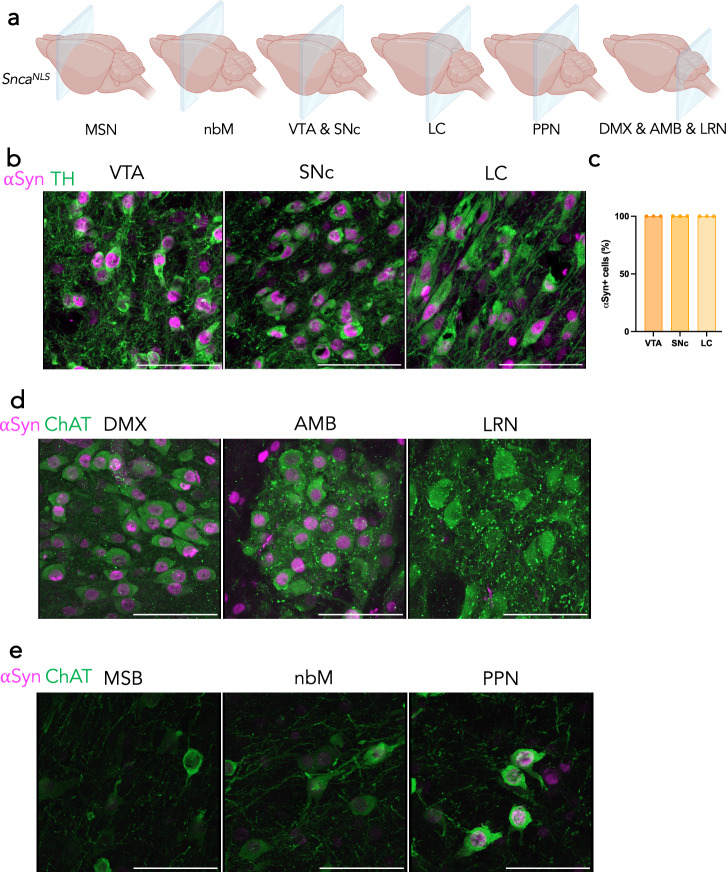
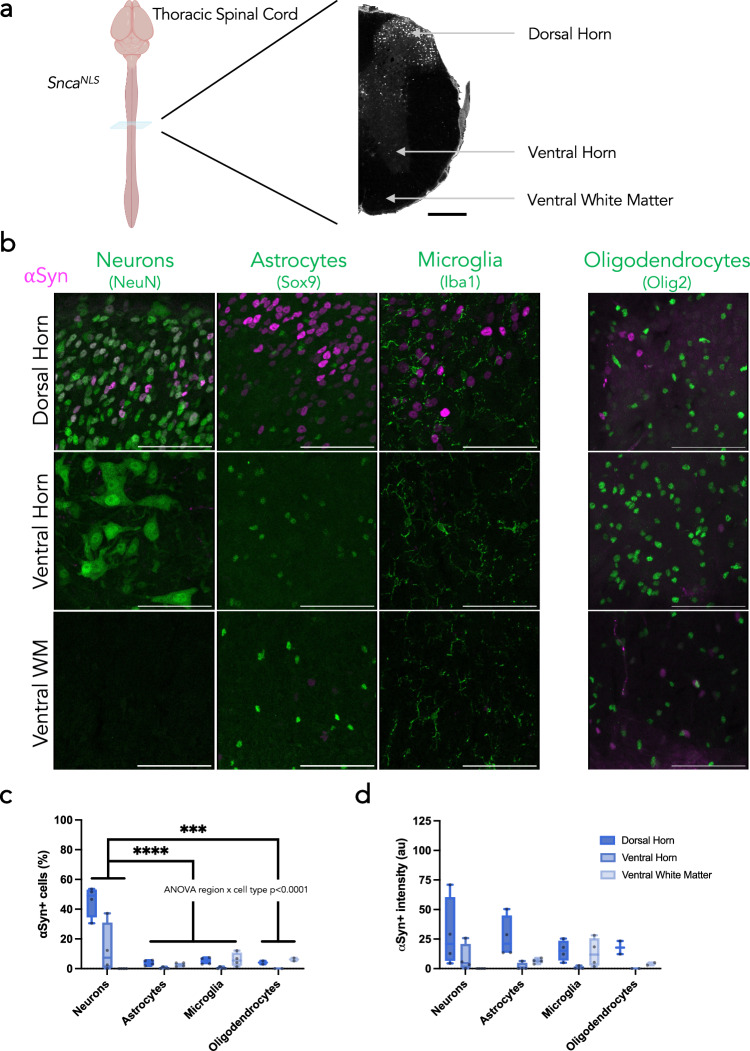
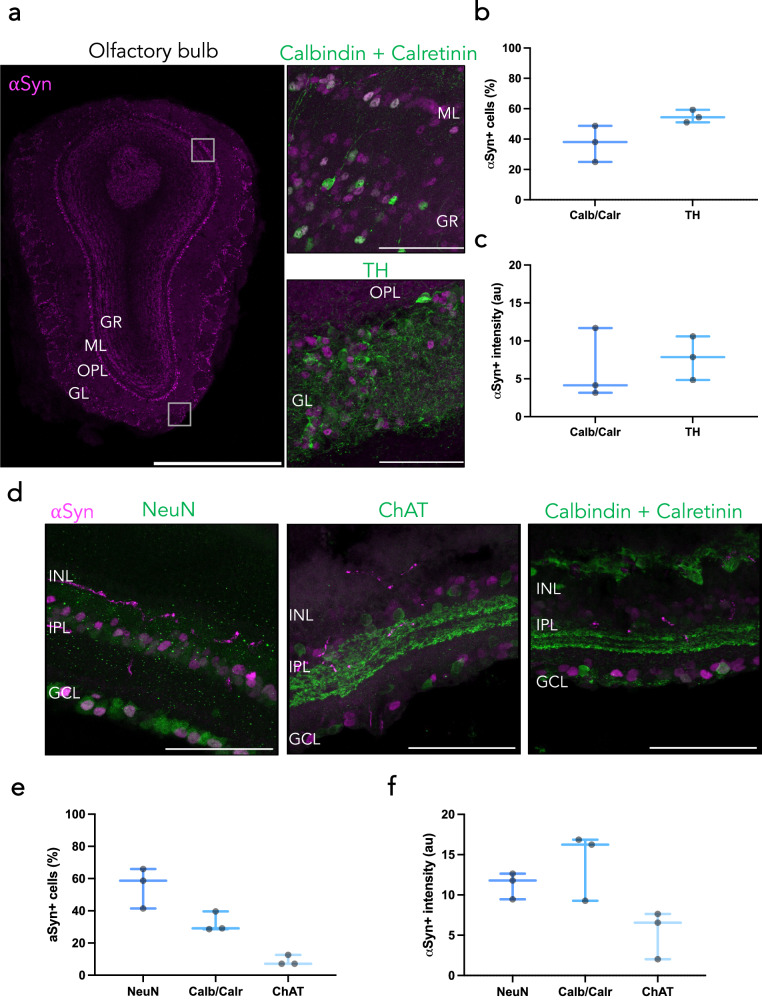
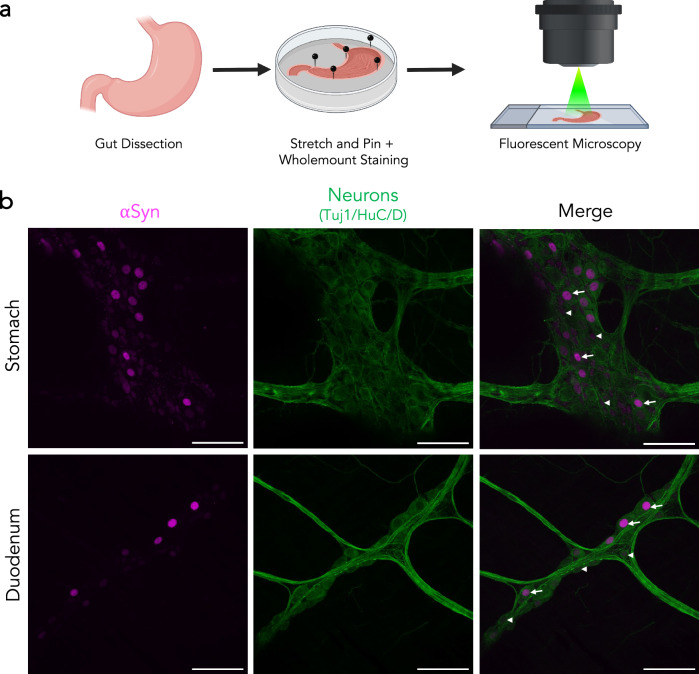
Parkinson's disease (PD) is the second most common neurodegenerative disease worldwide and presents pathologically with Lewy pathology and dopaminergic neurodegeneration. Lewy pathology contains aggregated α-synuclein (αSyn), a protein encoded by the SNCA gene which is also mutated or duplicated in a subset of familial PD cases. Due to its predominant presynaptic localization, immunostaining for the protein results in a diffuse reactivity pattern, providing little insight into the types of cells expressing αSyn. As a result, insight into αSyn expression-driven cellular vulnerability has been difficult to ascertain. Using a combination of knock-in mice that target αSyn to the nucleus (SncaNLS) and in situ hybridization of Snca in wild-type mice, we systematically mapped the topography and cell types expressing αSyn in the mouse brain, spinal cord, retina, and gut. We find a high degree of correlation between αSyn protein and RNA levels and further identify cell types with low and high αSyn content. We also find high αSyn expression in neurons, particularly those involved in PD, and to a lower extent in non-neuronal cell types, notably those of oligodendrocyte lineage, which are relevant to multiple system atrophy pathogenesis. Surprisingly, we also found that αSyn is relatively absent from select neuron types, e.g., ChAT-positive motor neurons, whereas enteric neurons universally express some degree of αSyn. Together, this integrated atlas provides insight into the cellular topography of αSyn, and provides a quantitative map to test hypotheses about the role of αSyn in network vulnerability, and thus serves investigations into PD pathogenesis and other α-synucleinopathies.


Conflict of interest statement

The authors declare no competing interests.

Figures

Fig. 1
Fig. 1. A brain-wide atlas of αSyn topography.
RNAScope performed on a wild-type mouse to measure Snca expression (a) and immunofluorescent staining performed on a mouse brain measuring αSyn protein density (b) throughout the brain. Staining (left), segmentation (middle, high threshold), and heatmap (right) show brain region-specific expression patterns of Snca or αSyn distribution, respectively. Select regions with a large percentage of high-expressing cells (AOBmi accessory olfactory bulb, mitral layer, PIR piriform area, BLAa basolateral amygdalar nucleus, anterior part, CA3 field CA3 of hippocampus, DG dentate gyrus, SNc substantia nigra, compact part, ENTl2 entorhinal area, lateral part, layer 2) or lower percentage (CP caudoputamen, CA1: field CA1 of hippocampus, SNr substantia nigra, reticular part) are labeled. Cortical layers are also highlighted since these show clear differences in the percentage of high-expressing cells (L2/3: layer 2/3, L5: layer 5, L6a: layer 6a). Scale bars: 1000 μm. c A comparative analysis of (a) and (b) indicating correlation of topography between Snca RNAScope in wildtype mice and αSyn immunofluorescence in SncaNLS mice for different intensity cut-offs. Dots represent class prevalence from individual regions. The solid line represents the line of best fit, and the shaded ribbons represent the 95% prediction intervals. The R and p values for the Pearson correlation between protein and gene expression are noted on the plots. d Representative images of whole brain Flag epitope staining and imaging provide an encompassing view of αSyn topography. White boxes indicate insets. Scale bars: 1000 μm (d top, d bottom left), 250 μm (d bottom right).
Fig. 2
Fig. 2. αSyn is predominantly expressed in neurons.
a Coronal planes chosen to assess different brain regions in SncaNLS mice. b Merged micrographs from the olfactory bulb (upper), motor cortex (middle), and CA1 hippocampus (bottom) staining for neurons (far left), astrocytes (middle left), microglia (middle right), and oligodendrocytes (right). Scale bars: 75 μm. From these, αSyn density (c) and intensity (d) were quantified. Plotted as box plots with min to max bars. Two-way ANOVA with Tukey’s post hoc, **, **** denote p < 0.01 and p < 0.0001, respectfully.
Fig. 3
Fig. 3. αSyn is highly expressed in catecholaminergic and cholinergic cell types that are vulnerable in PD.
a Coronal planes chosen to assess different brain regions in SncaNLS mice. b TH+ cells of the ventral tegmental area (VTA, left), substantia nigra pars compacta (SNc, middle), and locus coeruleus (LC, right) with (c) quantification of αSyn+ cell density. d ChAT+ cells of the dorsal motor nucleus of the vagus nerve (DMX; left), nucleus ambiguous (AMB; middle), and lateral reticular nucleus (LRN; right). e ChAT+ cells of the medial septal nucleus (MSN; left), nucleus basalis (nbM; middle), and pedunculopontine nucleus (PPN; right). Scale bars: 75 μm.
Fig. 4
Fig. 4. Diverse αSyn topography within the mouse spinal cord.
a Coronal plane chosen to assess different regions of the thoracic spinal cord in SncaNLS mice (left) with annotations for the dorsal and ventral horns and ventral white matter (right) from a section stained for αSyn. Scale bar: 1000 μm. b Merged micrographs from the dorsal horn (upper), ventral horn (middle), and ventral white matter (bottom) staining for neurons (left), astrocytes (middle left), microglia (middle right), and oligodendrocytes (right; different staining paradigm). Scale bars: 75 μm. From these, αSyn density (c) and intensity (d) were quantified. Plotted as box plot with min to max bars. Two-way ANOVA with Tukey’s post hoc, ***, **** denotes p < 0.001 and p < 0.0001, respectively.
Fig. 5
Fig. 5. Diverse αSyn staining patterns within the mouse olfactory bulb and retina.
a Tiled immunofluorescent image of an olfactory bulb (left; scale bar: 1000 μm) shows region-specific topography of αSyn, specifically colocalizing with calbindin/calretinin in the mitral layer (upper right) and TH in the glomerular layer (lower right). Scale bars: 75 μm. From these, αSyn density (b) and intensity (c) were quantified. Plotted as box plots with min to max bars. d Cross section of SncaNLS retina co-stained for NeuN (left) ChAT (middle) or calbindin/calretinin (right). From these, αSyn density (e) and intensity (f) were quantified. Plotted as box plots with min to max bars. Glomerular layer (GL), outer plexiform layer (OPL), mitral layer (ML), granule layer (GR), ganglionic cell layer (GCL), inner plexiform layer (IPL), inner nuclear layer (INL).
Fig. 6
Fig. 6. Varying intensities of αSyn expression throughout the gut.
a SncaNLS gut tissue was flushed and stained whole-mount prior to immunofluorescent staining and imaging. b αSyn shows 100% colocalization with neuronal markers in the stomach (upper) and duodenum (lower). Arrowheads denote low αSyn, arrows denote high αSyn intensity. Scale bars: 75 μm.

References

    1. Hijaz BA, Volpicelli-Daley LA. Initiation and propagation of α-synuclein aggregation in the nervous system. Mol. Neurodegener. 2020;15:19. doi: 10.1186/s13024-020-00368-6. - DOI - PMC - PubMed
    1. Reddy K, Dieriks BV. Multiple system atrophy: α-Synuclein strains at the neuron-oligodendrocyte crossroad. Mol. Neurodegener. 2022;17:77. doi: 10.1186/s13024-022-00579-z. - DOI - PMC - PubMed
    1. Papp MI, Kahn JE, Lantos PL. Glial cytoplasmic inclusions in the CNS of patients with multiple system atrophy (striatonigral degeneration, olivopontocerebellar atrophy and Shy-Drager. syndrome) J. Neurol. Sci. 1989;94:79–100. doi: 10.1016/0022-510X(89)90219-0. - DOI - PubMed
    1. Spillantini MG, et al. α-synuclein in Lewy bodies. Nature. 1997;388:839–840. doi: 10.1038/42166. - DOI - PubMed
    1. Singleton AB, et al. α-synuclein locus triplication causes Parkinson’s disease. Science. 2003;302:841–841. doi: 10.1126/science.1090278. - DOI - PubMed