. 2024 Mar 19;4(1):52.
doi: 10.1038/s43856-024-00453-7.

IFNα induces CCR5 in CD4+ T cells of HIV patients causing pathogenic elevation

Affiliations

IFNα induces CCR5 in CD4+ T cells of HIV patients causing pathogenic elevation

Hélène Le Buanec et al. Commun Med (Lond). .

Abstract

Background: Among people living with HIV, elite controllers (ECs) maintain an undetectable viral load, even without receiving anti-HIV therapy. In non-EC patients, this therapy leads to marked improvement, including in immune parameters, but unlike ECs, non-EC patients still require ongoing treatment and experience co-morbidities. In-depth, comprehensive immune analyses comparing EC and treated non-EC patients may reveal subtle, consistent differences. This comparison could clarify whether elevated circulating interferon-alpha (IFNα) promotes widespread immune cell alterations and persists post-therapy, furthering understanding of why non-EC patients continue to need treatment.

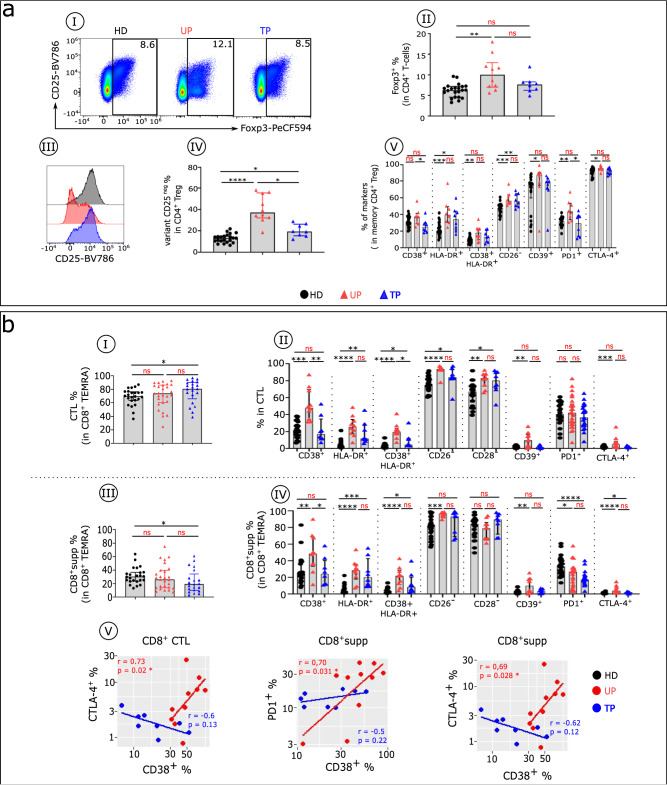
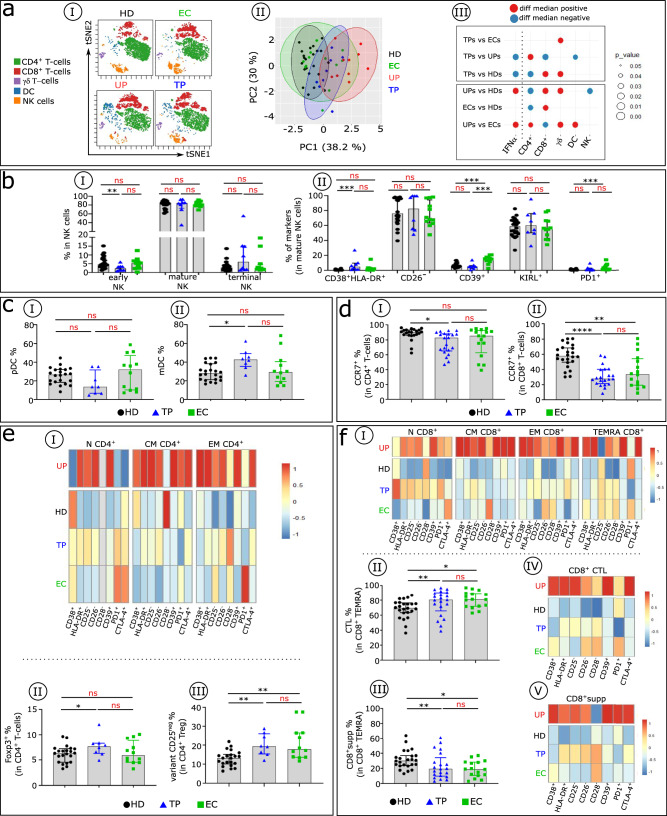
Methods: Levels of IFNα in HIV-infected EC and treated non-EC patients were compared, along with blood immune cell subset distribution and phenotype, and functional capacities in some cases. In addition, we assessed mechanisms potentially associated with IFNα overload.

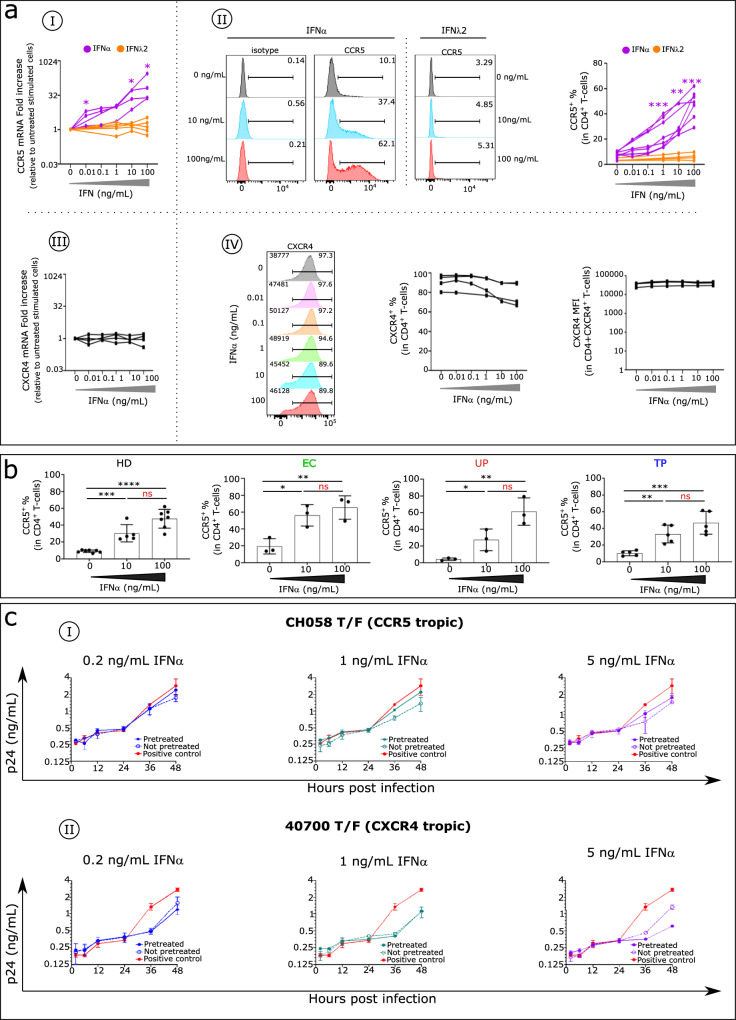
Results: Treatment of non-EC patients results in restoration of IFNα control, followed by marked improvement in distribution numbers, phenotypic profiles of blood immune cells, and functional capacity. These changes still do not lead to EC status, however, and IFNα can induce these changes in normal immune cell counterparts in vitro. Hypothesizing that persistent alterations could arise from inalterable effects of IFNα at infection onset, we verified an IFNα-related mechanism. The protein induces the HIV coreceptor CCR5, boosting HIV infection and reducing the effects of anti-HIV therapies. EC patients may avoid elevated IFNα following on infection with a lower inoculum of HIV or because of some unidentified genetic factor.

Conclusions: Early control of IFNα is essential for better prognosis of HIV-infected patients.

Plain language summary

The treatment for HIV, known as antiretroviral therapy (ART), does not cure HIV but enables individuals to live longer, healthier lives. In this study, we compared immune responses between elite controllers (ECs), who control their HIV infection without any treatment, and ART-treated and untreated patients. We demonstrate that IFNα, a small protein crucial in controlling immune system, is excessively produced at the onset of HIV infection and at levels that persist, resulting in poor HIV control without therapy. We show a mechanism for lack of control of HIV by IFNα. While inhibiting HIV, IFNα also simultaneously increases the HIV co-receptor, CCR5, thereby facilitating virus entry into the target cell. This is avoided by ECs which we hypothesize is associated with a lower infectious inoculum of HIV.


Conflict of interest statement

The authors declare no competing interests.

Figures

Fig. 1
Fig. 1. Comparative analysis of major blood immune cell subsets and serum IFN concentrations in UPs, TPs, and HDs.
a PCA of the data is based on the proportion of different cell subpopulations (CD4+, CD8+, and TCR γδ T cells; NKs and DCs) evaluated by flow cytometry, as depicted in Supplementary Fig. 1. The first two principal components (PC1 and PC2), representing the greatest differences among individuals, are represented in a bi-plot. Each point represents one participant, colour-coded by group: HDs (black), UPs (red) and TPs (blue). Each group is outlined by an ellipse representing the 95% confidence interval of the sample groupings. b Histograms show distributions of indicated immune cell populations between HDs (black), UPs (red), and TPs (blue). Analysis was done in 24 HDs, 26 UPs, and 21 TPs for all populations except for γδ T cells and DCs (lin HLA-DR+) (22 HDs, 10 UPs, 8 TPs). c Balloon-plot summarizing the statistically significant changes in the indicated immune cell populations between UPs and HDs, TPs and HDs, and TPs and UPs. The size of the circle indicates the p value. Red and blue respectively indicate increased and decreased frequencies of the immune cell populations. d Scatterplots of IFNα and IFNλ2 concentrations in serum from HDs (n = 51), UPs (n = 26), and TPs (n = 22). Levels of IFNα and IFNλ2 were detected by SIMOA in unpaired (D1, D2) and paired patients (D3, D4). e Scatterplot of the relationships between IFNα and IFNλ2 serum levels in the 22 paired UPs and TPs. Correlations were evaluated with Spearman’s rank correlation test. Paired data were compared using the Wilcoxon test. Multiple group comparisons were assessed using the Kruskal–Wallis test with Dunn’s multiple comparison testing. Values are medians and p values (*p < 0.05, **p < 0.01, ***p < 0.001, ****p < 0.0001). Error bars on graphs represent interquartile ranges.
Fig. 2
Fig. 2. Elevated IFNα effect on HIV coreceptor CCR5 expression in human CD4+T cells and on release of circulating HIV by infected CD4+T cells.
aI CCR5 mRNA expression levels, assessed by RT-qPCR, and (aII) CCR5 protein expression level, evaluated by flow cytometry in CD4+T cells stimulated with different concentrations of IFNα (mRNA analysis n = 4, protein analysis n = 7, purple) and IFNλ2 (mRNA analysis n = 5, protein analysis n = 4, orange). aIII CXCR4 mRNA expression levels assessed by RT-qPCR and (aIV) CXCR4 protein expression level evaluated by flow cytometry in CD4+T cells stimulated with different concentrations of IFNα (mRNA analysis n = 4, protein analysis n = 4). b Histograms show CCR5 frequency in CD4+T cells stimulated with different IFNα concentrations in each studied group (HDs n = 7, ECs n = 3, UPs n = 3, and TPs n = 5). Multiple group comparisons were made using the Kruskal–Wallis test with Dunn’s multiple comparison testing. Values are medians and p values (*p < 0.05, **p < 0.01, ***p < 0.001, ****p < 0.0001); ns: not significant. Error bars on graphs represent interquartile ranges. c PBMCs from a single HD were stimulated in the presence (pretreated) or absence (not pretreated) of IFNα for 4 days. The stimulated cells were infected by the CH058 T/F virus (CCR5 tropic) (cI) or the 40700 T/F virus (CXCR4-tropic) (cII). Upon infection, cells were cultured with the corresponding concentration of IFNα for 48 h. For the positive control, the infected cells (not pretreated) were cultured in the absence of IFNα for determination of the normal replication kinetics of the virus. The p24 concentration in the culture supernatants was measured at 2, 6, 12, 24, and 48 h post infection. The infections were performed in duplicate, and the error bar represents the standard deviation (SD). Experiments were performed in PBMCs from three HDs. The results of one representative experiment were shown. MFI: median fluorescence intensity.
Fig. 3
Fig. 3. TP distribution analysis of blood innate immune cells.
TPs had a lower percentage and fewer phenotypic alterations compared with UPs. aI The SPADE tree shows the distribution of NK cell subsets in HDs (black), UPs (red), and TPs (blue). Nodes are coloured by count. aII Representative flow cytometry plots of NK cell subsets gated on CD19CD14TCRγδCD3HLA-DR cells from the three studied groups: early NKs (CD56brightCD16), mature NKs (CD56dimCD16+), and terminal NKs (CD56CD16+). aIII Frequency of early, mature, and terminal NKs in each studied group (HDs n = 22, UPs n = 10 and TPs n = 8). aIV Histograms with the expression level of Helios, NCR (NKp30, NKp44, NKp46), GrzB/perf, CD26, CD39, and iKIR on mature NK cells from HDs, UPs, and TPs. aV, aVI Boxplots display the frequency of the indicated markers in mature NK cells in each studied group. Analysis was done in 22 HDs, 10 UPs, and 8 TPs for all markers except for Helios and NCR (11 HDs, 18 UPs, 18 TPs) and GrzB/perf (3 HDs, 10 UPs, 10 TPs). bI Representative dot plot shows how to distinguish pDC (CD123+ CD11C) and mDC (CD123CD11C+) subsets within the HLA-DR+ lin population in HD. Histograms with the frequencies of pDC (bII) and mDC (bIII) across the groups (HDs n = 22, UPs n = 10, and TPs n = 8). c Proportion of specific markers on TCR γδ T cells of each studied group (HDs n = 22, UPs n = 10, and TPs n = 8). Multiple group comparisons were made using the Kruskal–Wallis test with Dunn’s multiple comparison testing. Values are medians and p values (*p < 0.05, **p < 0.01, ***p < 0.001, ****p < 0.0001); ns: not significant. Error bars on graphs represent interquartile ranges.
Fig. 4
Fig. 4. Residual T cell phenotypic profile abnormalities in TPs.
a Histograms with the frequencies of CCR7 in CD3+ (aI), CD4+ (aII), and CD8+ (aIII) T cells across the groups (HDs n = 2 (black), UPs n = 26 (red), and TPs n = 22 (blue)). b The SPADE tree shows the distribution of CD4+T conv (bI) and CD8+T cell (bIII) subsets in HDs, UPs, and TPs. Nodes are coloured by count. CD4+Tconv and CD8+T cells can be classified into four major subsets by their expression of CD45RA and the chemokine receptor CCR7: naïve (CCR7+CD45RA+), CM (CCR7+CD45RA), EM (CCR7CD45RA), and TEMRA (CCR7CD45RA+). The frequencies of naïve, CM, EM, and TEMRA CD4+Tconv (bII) and CD8+T cells (bIV) in each studied group (HDs n = 22, UPs n = 26, and TPs n = 22) are shown. Boxplots show the expression of the indicated marker in CD4+CM (cI) and CD8+CM (cII) cells across the groups (HDs n = 22, UPs n = 10, and TPs n = 8). The radar chart shows a composite score of phenotypic cell alteration calculated for each CD4+Tconv (cIII) and CD8+T cell (cIV) subpopulation in UPs (red lines) and TPs (blue lines) (see “Methods”). Multiple group comparisons were made using the Kruskal–Wallis test with Dunn’s multiple comparison testing. Values are medians and p values (*p < 0.05, **p < 0.01, ***p < 0.001, ****p < 0.0001); ns: not significant. Error bars on graphs represent interquartile ranges.
Fig. 5
Fig. 5. Treg and cytotoxic CD8+T cells from TPs showing residual phenotypic abnormalities.
aI Representative flow cytometry plots of CD25+ Foxp3+ cells within CD4+T cells isolated from HDs (black), UPs (red), and TPs (blue). aII Histograms show the frequency of Foxp3 in CD4+T cells. aIII Histograms display the expression level of CD25 in CD4+ Foxp3+ T cells and (aIV) the frequency of the Treg CD25 variant in CD4+Foxp3 T cells in each studied group. aV Proportion of specific functional signalling checkpoints on memory CD4+Treg (CD4+ Foxp3+CD25+ CD45RA) cells of each studied group (HDs n = 22, UPs n = 10, and TPs n = 8). b Histograms show the frequency of CD8+ CTL (CD8+TEMRA iKIR (bI) and CD8+supp (CD8+TEMRA iKIR+) cells (bIII) in each studied group (HDs n = 22, UPs n = 26, and TPs n = 22)). Boxplots show the proportion of specific markers on CD8+ CTL (bII) and CD8+supp (bIV) T cell subsets of each studied group (HDs n = 22, UPs n = 10, and TPs n = 8). bV Scatterplots of the relationships between the expression level of indicated markers in CD8+ cytotoxic T cells (CD8+ CTL and CD8+supp) (UPs n = 10 and TPs n = 8). Multiple group comparisons were made using the Kruskal–Wallis test with Dunn’s multiple comparison testing, and correlations were analysed with Spearman’s rank correlation test. Values are medians and p values (*p < 0.05, **p < 0.01, ***p < 0.001, ****p < 0.0001); ns: not significant. Error bars on graphs represent interquartile ranges.
Fig. 6
Fig. 6. TPs and ECs share few blood immune cell anomalies.
aI Representative viSNE plot shows major immune cell subpopulation distribution (CD4+, CD8+, and TCR γδ T cells; NKs and DCs) in HDs (black), UPs (red), TPs (blue), and ECs (green), evaluated by flow cytometry. aII PCA scatterplots of samples based on the proportion of the different major lymphocyte subpopulations indicated above. Each point represents one participant, colour-coded by group: HDs (black), UPs (red), TPs (blue), and ECs (green). Each group is outlined by an ellipse representing the 95% confidence interval of the sample groupings. aIII The balloon plot summarizes the statistically significant changes in the indicated immune cell populations between each compared group. The size of the circle represents the p value. Red and blue indicate increased or decreased frequencies of immune cell populations. bI Frequency of early, mature, and terminal NKs in each studied group (HDs n = 22, TPs n = 8, and ECs n = 12). bII Boxplots display indicated marker frequency in mature NK cells in each studied group. Histograms show the frequencies of pDCs (cI) and mDCs (cII) across the groups (HDs n = 22, TPs n = 8, and ECs n = 12) and CCR7 frequency in CD4+ (dI) and CD8+ (dII) T cells across the groups (HDs n = 22, TPs n = 8, and ECs n = 12). eI Heatmap of the indicated marker frequency in CD4+N, CM, and EM cells. eII Histograms show Foxp3 frequency in CD4+T cells and (eIII) Treg CD25 variant frequency in CD4+Foxp3 T cells in each studied group. f I Heatmap of the indicated marker frequency in CD8+N, CM, EM, and TEMRA cells. Histograms show the frequency of CD8+ CTL (fII) and CD8+supp (f III) in each studied group (HDs n = 22, TPs n = 8, and ECs n = 12). Heatmap of the indicated marker frequency in CD8+ CTL (fIV) and CD8+supp (fV) cells in each studied group (HDs n = 22, TPs n = 8, and ECs n = 12). Warmer colours indicate higher values and colder colours indicate lower values. Multiple group comparisons were made using the Kruskal–Wallis test with Dunn’s multiple comparison testing. Values are medians and p values (*p < 0.05, **p < 0.01, ***p < 0.001, ****p < 0.0001); ns: not significant. Error bars on graphs represent interquartile ranges.

Update of

References

    1. Leon A, et al. Rate and predictors of progression in elite and viremic HIV-1 controllers. AIDS. 2016;30:1209–1220. doi: 10.1097/QAD.0000000000001050. - DOI - PubMed
    1. Maggi P, et al. Cardiovascular risk and dyslipidemia among persons living with HIV: a review. BMC Infect. Dis. 2017;17:551. doi: 10.1186/s12879-017-2626-z. - DOI - PMC - PubMed
    1. Zhou, Q. et al. Malignancies in people living with HIV. AIDS Rev. 10.24875/AIDSRev.21000057 (2022). - PubMed
    1. Rasch MG, et al. Renal function and incidence of chronic kidney disease in HIV patients: a Danish cohort study. Scand. J. Infect. Dis. 2012;44:689–696. doi: 10.3109/00365548.2012.673730. - DOI - PubMed
    1. Kruger MJ, Nell TA. Bone mineral density in people living with HIV: a narrative review of the literature. AIDS Res. Ther. 2017;14:35. doi: 10.1186/s12981-017-0162-y. - DOI - PMC - PubMed