. 2024 Mar 19;15(1):2463.
doi: 10.1038/s41467-024-46837-0.

NMR and MS reveal characteristic metabolome atlas and optimize esophageal squamous cell carcinoma early detection

Affiliations

NMR and MS reveal characteristic metabolome atlas and optimize esophageal squamous cell carcinoma early detection

Yan Zhao et al. Nat Commun. .

Abstract

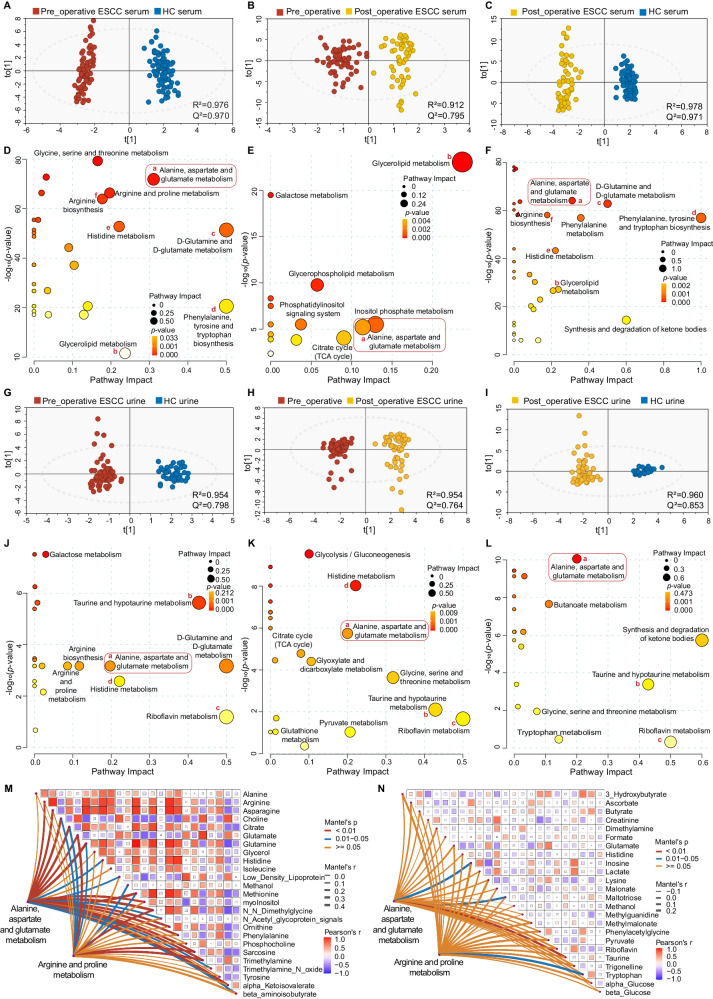
Metabolic changes precede malignant histology. However, it remains unclear whether detectable characteristic metabolome exists in esophageal squamous cell carcinoma (ESCC) tissues and biofluids for early diagnosis. Here, we conduct NMR- and MS-based metabolomics on 1,153 matched ESCC tissues, normal mucosae, pre- and one-week post-operative sera and urines from 560 participants across three hospitals, with machine learning and WGCNA. Aberrations in 'alanine, aspartate and glutamate metabolism' proved to be prevalent throughout the ESCC evolution, consistently identified by NMR and MS, and reflected in 16 serum and 10 urine metabolic signatures in both discovery and validation sets. NMR-based simplified panels of any five serum or urine metabolites outperform clinical serological tumor markers (AUC = 0.984 and 0.930, respectively), and are effective in distinguishing early-stage ESCC in test set (serum accuracy = 0.994, urine accuracy = 0.879). Collectively, NMR-based biofluid screening can reveal characteristic metabolic events of ESCC and be feasible for early detection (ChiCTR2300073613).


Conflict of interest statement

The authors declare no competing interests.

Figures

Fig. 1
Fig. 1. Schema of overall study design.
A total of 560 participants from three centers were involved in this study. Tissue, serum and urine specimens were collected and subjected to 1H-NMR- and MS-based metabolomics analysis, followed by pattern recognition, machine learning and WGCNA analysis.
Fig. 2
Fig. 2. Tissue metabolomic landscape of ESCC patients based on NMR-based metabolomics.
AC OPLS-DA score plot based on 1H-NMR tissue spectra from ESCC patients at different stages. Red: ESCC tumor; Blue: Normal mucosa; Yellow: Early-stage ESCC tissue; Orange: Advanced-stage ESCC tissue. DF Statistical validation of the corresponding model by permutation analysis (200 times). The x-axis represents the permutation retention rate of the permutation test, and the dots in the upper right corner represent the R2 (light blue) and Q2 (dark blue) values of the original model when the permutation retention rate is 1. R2 measures the goodness of fit, while Q2 measures the predictive ability of the model. Light blue dots represent the R2 values obtained from the permutation test, while dark blue dots represent the Q2 values obtained from the permutation test. The two dashed lines represent the regression lines of R2 and Q2, respectively. GI Metabolic pathway analysis. Relative betweenness centrality was the selected node importance measure for pathway topological analysis. All pathways are represented as bubbles. The color and size of each bubble correspond to its p-value and pathway impact value, respectively. In general, bubbles on the right side of the map have higher weights, while bubbles at the top have smaller p-values. The precise p-values for metabolic pathway analysis are provided in the Source Data without adjustments. J Multiple Volcano plot based on the same batch of samples, showing the comparison of differential metabolites between different groups (Tumor vs Normal; Early ESCC vs Normal; Early ESCC vs Advanced ESCC). P-values were determined by two-sided t-test without adjustments. Metabolites with p < 0.05 were visualized as solid circles on the plot, while those with p > 0.05 were not displayed. A log10 transformation was applied to the p-values of each significantly differential metabolite to visualize their significance levels. K Statistical analysis of principal metabolic pathway disturbances in the evolution of ESCC. A pathway impact greater than 0.1 and p < 0.05 was used as the cut-off value for the statistical significance. (A, D, G, left panel) ESCC vs. normal mucosa patients; (B, E, H, middle panel) early-ESCC vs. normal mucosa patients; and (C, F, I, right panel) early-ESCC vs. advanced -ESCC patients. Source data are provided as a Source Data file.
Fig. 3
Fig. 3. Mass spectrometry-based targeted quantitative analysis of early stage ESCC tissue samples confirm the NMR results.
A Pie chart of quantified metabolite categories. Colors represent different compound super-classes; coloration follows the legend counterclockwise per each pie chart. B Volcano plot analysis performed on early-ESCC tissue samples vs. normal controls. P-values were determined by two-sided t-test without adjustments. Differentially-expressed metabolites are indicated by blue dots (down-regulation relative to normal controls) and red dots (up-regulation relative to normal controls), respectively. Gray dots indicate no significant difference. C Treemap of the most enriched KEGG pathways in early-ESCC tissue samples. Relative betweenness centrality was the selected node importance measure for pathway topological analysis. Each square represents a metabolic pathway; the square size represents the impact factor in the topological analysis; the color of the squares indicates the p-value of the enrichment analysis; and the darker the color, the more significant the enrichment. D O2PLS loading plots of the key differential metabolites analyzed by NMR-based and MS-based metabolomics. The top 30 metabolites in early-ESCC tissues detected by NMR and MS are labeled in purple and blue, respectively. Source data are provided as a Source Data file.
Fig. 4
Fig. 4. Changes in serum and urine metabolism in ESCC patients before and after surgery.
AL OPLS-DA score plots of 1H-NMR serum spectra (AC) and urine spectra (GI) between experimental groups. Red: Pre-operation; Yellow: Post-operation; Blue: Healthy control (HC). Metabolic pathway analysis of distinguishing metabolites in serum (DF) and urine (JL) of ESCC patients. Relative betweenness centrality was the selected node importance measure for pathway topological analysis. The precise p-values for metabolic pathway analysis were provided in the Source Data without adjustments. (A, D, G, J, left panel) Pre-operation group vs. healthy group; (B, E, H, K, middle panel) Pre-operation group vs. post-operation group; and (C, F, I, L, right panel) post-operation group vs. healthy group. M, N Mantel test quantified the degree of correlation between tissue metabolome and serum metabolome, together with the urine metabolome in early-ESCC patients. The key metabolites (potential biomarkers) in the alanine, aspartate and glutamate metabolism pathway, or arginine and proline metabolism pathway, from tissue profiles, were compared with serum and urine differential metabolites, respectively. Mantel statistics are provided in the right area in the plot. The network heatmap showed the correlation between the principal tissue biomarkers and biofluid metabolites (edge color denotes the statistical significance (p-values were determined by two-sided t-tests without adjustments for comparisons), and edge width corresponds to Mantel’s r statistic for the corresponding distance correlations; the color gradient in the boxes represents Pearson’s correlation coefficients). Source data are provided as a Source Data file.
Fig. 5
Fig. 5. WGCNA analysis, differential analysis of metabolic enzyme expression and critical metabolic pathways uncover the involved mechanisms.
A Early-ESCC tissue vs. normal mucosa: WGCNA cluster dendrogram groups differential metabolites into distinct metabolite modules (with different colors) defined by dendrogram branch cutting. Turquoise, blue and brown were the most strongly associated modules between tumor and normal tissue. B Early-ESCC tissue vs. normal mucosa: scatter plot showing the correlations between metabolite module-membership scores and trait. The turquoise, blue or brown hue denotes each module’s metabolites of interest. C Early-ESCC tissue vs. normal mucosa: functional enrichment analysis of the metabolites in the turquoise module. The selected pathway enrichment analysis method is Globaltest. The dot plot summarizes the most significant metabolite sets identified during the enrichment analysis. The size of the dots per metabolite set represents the enrichment ratio, and the color represents the p-value. D Pre-operative vs. post-operative serum groups: hub metabolites in the only crucial WGCNA module specific to the metabolic changes of ESCC patients before and after esophagectomy. E Differential expression (log2FC) of the principal metabolic enzymes in the alanine, aspartate, and glutamate metabolism pathway, using TCGA-ESCA data (red, n = 182 biologically independent tumor samples) and GTEx data (blue, n = 666 biologically independent normal samples). In the box plot, the central black line represents the data median, while the vertical lines correspond to the upper quartile and lower quartile. The data are presented as mean values ± standard error of the mean (SEM). Mann-Whitney U-test (Wilcoxon rank sum test) was performed for comparison, and the p-values were obtained. F Summary of the alanine, aspartate, and glutamate metabolism pathway including metabolites, enzymes and transporters where relevant (blue: down-regulation; red: up-regulation). Source data are provided as a Source Data file.
Fig. 6
Fig. 6. Internal validation of serum and urine metabolite biomarkers.
A, B STAMP analysis indicates expressional differences of serum (A) and urine (B) metabolite biomarkers between the ESCC (n = 54 biologically independent serum samples; n = 54 biologically independent urine samples) and HC groups (n = 87 biologically independent serum samples; n = 39 biologically independent urine samples). The results were divided into two parts: 1) Bar Chart on the left side: The red bars represent the ESCC group, while the blue bars represent the HC group. The length of each bar indicates the proportion of expression. The black lines on the bars represent the Standard Error of the Mean (SEM). 2) Dot Plot on the right side: When a differential metabolite has a higher abundance in the ESCC group than the HC group, it is represented by a red dot to the right of the dashed line. Conversely, if a metabolite’s expression is lower in the ESCC group than in the HC group, it is marked with a blue dot to the left of the dashed line. The distance of the dot from the central dashed line represents the magnitude of the difference (95% CI). The vertical axis on the right displays the p-values for the differences (two-sided Welch t-test without adjustments for comparisons, FDR-adjusted), arranged from smallest to largest. The mean, standard deviation (SD), and SEM of the metabolite signatures in both groups have been provided in the source data. 95% CI: 95% Confidence Interval. CF AUC of ROC curves for the 16 serum (C, D) and 10 urine (E, F) metabolic signatures discriminating ESCC from HC in the validation set, respectively. GN ROC curves and AUCs from cross-validated serum (G) or urine (I) joint models (red), run on the 30% hold-out test dataset (blue). Prediction of class probabilities (average of the cross-validation) for each sample using the best classifier based on serum (H) or urine (J) AUC. Predictive accuracies of SVM models with different numbers of serum (K) or urine (M) features. Image shows the average of each sample’s predicted class probabilities across 100 cross-validations. As the algorithm used a balanced sub-sampling approach, the classification boundary is located at the center (x = 0.5, the dotted line). ROC curve shows the efficacy of five serum (L) or five urine (N) metabolites (with the lowest AUC value) combined with the logistic regression model of ESCC. CV cross-validation. Source data are provided as a Source Data file.
Fig. 7
Fig. 7. External validation of the biofluid models using multi-center data.
A ROC analysis for the five tumor biomarkers commonly used in the clinic (CEA, CA15-3, CA19-9, Crfr211, SCC) discriminating ESCC from HC. B Unsupervised hierarchical clustering of ESCC and CRC groups across all metabolites (Ward’s method clustering). Yellow: CRC; Orange: ESCC. C ROC curve shows poor diagnostic efficacy of the serum joint model for CRC patients. Shaded areas represent the 95% CI of the corresponding ROC curves. D, E Circos heatmap was used to compare the serum (D) and urine (E) metabolic profiles of different pathological types of esophageal tumors, including ESCC, EAC, GEJ, undifferentiated carcinoma of the esophagus and esophageal stromal tumors. F Performance of SVM-based classifiers was examined by ROC curves and evaluated by 100-fold cross-validation. The black dots in the box plot represent the predictive accuracy of the serum or urine panels in distinguishing early stage ESCC (red, n = 18 biologically independent early-stage serum samples; blue, n = 18 biologically independent early-stage urine samples) from HC groups. Notably, the serum panel data points exhibit proximity, while those of the urine panel are more dispersed. Source data are provided as a Source Data file.

Similar articles

Cited by

References

    1. Morgan E, et al. The global landscape of esophageal squamous cell carcinoma and esophageal adenocarcinoma incidence and mortality in 2020 and projections to 2040: new estimates from GLOBOCAN 2020. Gastroenterology. 2022;163:649–658 e642. doi: 10.1053/j.gastro.2022.05.054. - DOI - PubMed
    1. Su M, et al. Temporal trends of esophageal cancer during 1995-2004 in Nanao Island, an extremely high-risk area in China. Eur. J. Epidemiol. 2007;22:43–48. doi: 10.1007/s10654-006-9086-x. - DOI - PubMed
    1. Wang, Y. et al. Global burden of digestive diseases: a systematic analysis of the global burden of diseases study, 1990 to 2019. Gastroenterology. 10.1053/j.gastro.2023.05.050 (2023). - PubMed
    1. Wang GQ, et al. Long-term results of operation for 420 patients with early squamous cell esophageal carcinoma discovered by screening. Ann. Thorac. Surg. 2004;77:1740–1744. doi: 10.1016/j.athoracsur.2003.10.098. - DOI - PubMed
    1. Chen R, et al. Effectiveness of one-time endoscopic screening programme in prevention of upper gastrointestinal cancer in China: a multicentre population-based cohort study. Gut. 2021;70:251–260. - PMC - PubMed

MeSH terms

Substances