. 2024 Mar 19;15(1):2468.
doi: 10.1038/s41467-024-46421-6.

Genetic gains underpinning a little-known strawberry Green Revolution

Affiliations

Genetic gains underpinning a little-known strawberry Green Revolution

Mitchell J Feldmann et al. Nat Commun. .

Abstract

The annual production of strawberry has increased by one million tonnes in the US and 8.4 million tonnes worldwide since 1960. Here we show that the US expansion was driven by genetic gains from Green Revolution breeding and production advances that increased yields by 2,755%. Using a California population with a century-long breeding history and phenotypes of hybrids observed in coastal California environments, we estimate that breeding has increased fruit yields by 2,974-6,636%, counts by 1,454-3,940%, weights by 228-504%, and firmness by 239-769%. Using genomic prediction approaches, we pinpoint the origin of the Green Revolution to the early 1950s and uncover significant increases in additive genetic variation caused by transgressive segregation and phenotypic diversification. Lastly, we show that the most consequential Green Revolution breeding breakthrough was the introduction of photoperiod-insensitive, PERPETUAL FLOWERING hybrids in the 1970s that doubled yields and drove the dramatic expansion of strawberry production in California.


Conflict of interest statement

The authors declare no competing interests.

Figures
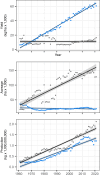
Fig. 1
Fig. 1. Strawberry production in the US and Europe (1961–2021).
Strawberry yield, area harvested, and production statistics compiled by the Food and Agriculture Organization of the United Nations from 1961 to 2021 for the US and Europe (https://www.fao.org/faostat/en/). Statistics for the US are displayed as solid blue circles, whereas statistics for Europe are displayed as solid gray circles. Linear regression slopes are shown as solid blue lines for the US and solid black lines for Europe with 95% confidence intervals for the predicted values shown as gray bands. Source data are provided as a Source Data file.
Fig. 2
Fig. 2. Cumulative marketable fruit yields of modern short-day and day-neutral cultivars (hybrids) grown in coastal California locations over the 2015–16 and 2016–17 growing seasons.
Estimated marginal means (EMMs) for cumulative fruit yields were estimated from 46 to 52 individual harvests of 30 short-day cultivars grown in Oxnard, CA (A) and 30 day-neutral cultivars grown in Santa Maria, CA (B) and Prunedale, CA (C). A Yield EMMs for short-day cultivars from the 2016 and 2017 harvest seasons in Oxnard, CA. B Yield EMMs for day-neutral cultivars from the 2016 and 2017 harvests seasons in Santa Maria CA. C Yield EMMs for day-neutral cultivars from the 2016 and 2017 harvest seasons in Prunedale, CA. D Between-year EMMs for day-neutral cultivars from the 2016 and 2017 harvest seasons in Santa Maria and Prunedale, CA.
Fig. 3
Fig. 3. Genetic diversity among early and modern strawberry hybrids.
Genetic relationships were estimated among 1406 hybrids using 28,513 single nucleotide polymorphisms. The birth years of these hybrids ranged from 1775 to 2016. The first two scores (PC1 and PC2) from a principal component analysis of the genomic relationship matrix (G) are plotted for three different groups of genotyped individuals: 405 elite × elite hybrids phenotyped for fruit yield and quality traits (blue points); 131 elite × exotic and eight exotic × exotic hybrids phenotyped for fruit yield and quality traits (coral points); and a genetically diverse collection of 434 California and non-California cultivars and other hybrids without phenotypes developed between 1775 and 2015 (gray points). Source data are provided as a Source Data file.
Fig. 4
Fig. 4. Phenotypic means of training population hybrids.
Within-year estimated marginal means (EMMs) for fruit yield (A), count (B), weight (C), firmness (D), total soluble solids (E; TSS), titratable acidity (F; TA), TSS/TA (G), and anthocyanin concentration (H; ANC) among 405 elite × elite hybrids (blue points), 132 elite × exotic hybrids (red points), and 8 exotic × exotic hybrids (black points) phenotyped in Salinas over the 2016–17 and 2017–18 growing seasons. EMMs were estimated from fruit harvested from three replicates once per week for 11 to 13 weeks through the summer solstice each year. The between-year rank correlations (r) were positive and statistically significant for every trait. Source data are provided as a Source Data file.
Fig. 5
Fig. 5. Genomic prediction of breeding values.
Genomic-estimated breeding value (GEBV) estimates are shown for agriculturally important traits among individuals spanning the domestication history of strawberry (1775-present). GEBVs were estimated by single-step best linear unbiased prediction (ss-BLUP) from pedigree (A) and genomic (G) relationship matrices for 796 genotyped individuals (shown in blue) and 5646 non-genotyped individuals (shown in gray) with known birth years. The dashed lines depict the predicted values (population means) from piecewise linear regressions of GEBVs on birth years before and after change-point (CP) years (1775 to CP and CP to 2015). Change-point years ranged from 1943 to 1962 for different traits (see Table 2). Statistics are shown in the left-hand column of plots for fruit yield (A), count (D), weight (G), and firmness (J). Abbreviations for fruit quality traits displayed in the center column of plots (B, E, H, and K) are TSS = total soluble solids and TA = titratable acidity. Abbreviations for disease resistance traits displayed in the right-hand column of plots (C, F, I, and L) are Verticillium wilt (VW) resistance score and area under the disease pressure stairs (AUDPS) and Phytophthora crown rot (PhCR) resistance score and AUDPS. The ordinal resistance scores for both ranged from highly resistant (1) to highly susceptible (5). Source data are provided as a Source Data file.
Fig. 6
Fig. 6. Additive genetic correlations.
Additive genetic correlations among fruit and disease resistance traits were estimated from genomic-estimated breeding values (GEBVs) of 796 genotyped individuals and 5646 non-genotyped individuals with known birth years (see Fig. 5). A The lower triangle displays estimates for individuals with birth years between 1775 and 2015. B The upper triangle displays estimates for individuals originating before 1954, whereas the lower triangle displays estimates for individuals originating after 1954. Source data are provided as a Source Data file.
Fig. 7
Fig. 7. Graphical abstract of strawberry domestication milestones (1715-present).
The fruit illustrations are watercolors developed by Sandra Doyleⓒ from botanical illustrations of extinct ancestors and photographs of living specimens (https://www.sandra-doyle.co.uk/; commissioned by UC Davis and used with permission of the artist). Letters identify milestones in the domestication history of strawberry. Letters identify milestones in the domestication history of strawberry. A Spontaneous hybrids arise between F. chiloensis subsp. chiloensis and F. virginiana subsp. virginiana ecotypes under cultivation in western Europe (1715 and later). Fruit of the original F. chiloensis parent plant gifted by to Antoine de Jussieu (Professor and Demonstrator of the Interior and Exterior of Plants at the King’s Garden, Versailles, France) were described as “whitish red''. B The earliest interspecific hybrids emerge and are exchanged and cultivated in the Garden of Versailles and other botanical gardens in western Europe (1715–1766). C Antoine Nicolas Duchesne discovers the interspecific hybrid origin of F. × ananassa and early cultivars begin emerging from artificial hybridization and selection among interspecific progeny (1766 and later). D Keen’s Seedling, Downtown, and other iconic early cultivars emerge in western Europe, are widely disseminated and exchanged, and migrate to North America in the early 1800s and later. E Royal Sovereign, Nich Omher, and other iconic cultivars emerge in the late 1800s and early 1900s in North America and Europe. F Alfred Etter introgresses alleles from native F. chiloensis subsp. pacifica and F. chiloensis subsp. lucida ecotypes, pioneers strawberry breeding at the turn of the century in coastal California (1899–1927), and donates his genetic resources to the University of California in 1928. G Lassen, Fairfax, Shasta, and other early cultivars emerge from the California and other populations in North America (1924 onward). H Green Revolution short-day (photoperiod sensitive) cultivars emerge from the California population (1953 onward). I Royce S. Bringhurst initiates the development of photoperiod-insensitive F. × ananassa cultivars by introgressing alleles from an F. virginiana subsp. glauca ecotype native to Utah (1953–1980). J Green Revolution day-neutral (photoperiod-insensitive) cultivars emerge from the California population (1980 onward). Source data are provided as a Source Data file.
Fig. 8
Fig. 8. Genomic prediction of additive genetic variance.
Genomic-predicted population means and additive genetic variances (VA) were estimated for agriculturally important traits spanning the history of strawberry breeding (1775–2015). The statistics shown were estimated from 87,893 simulated segregating populations from crosses among parents originating before the approximate start of the Green Revolution (1775–1953; solid red circles) and 84,490 simulated segregating populations from crosses among parents originating after 1953 (solid gray circles). Abbreviations for fruit quality traits shown in the middle row of plots are TSS = total soluble solids and TA = titratable acidity. Abbreviations for disease resistance traits shown in the lower row of plots are Verticillium wilt (VW) resistance score and area under the disease pressure stairs (AUDPS) and Phytophthora crown rot (PhCR) resistance score and AUDP. The ordinal resistance scores for both ranged from highly resistant (1) to highly susceptible (5). Source data are provided as a Source Data file.

Similar articles

Cited by

References

    1. Darrow GM. The Strawberry: History, Breeding and Physiology. New York: Holt, Rinehart & Winston; 1966.
    1. Pincot DD, et al. Social network analysis of the genealogy of strawberry: retracing the wild roots of heirloom and modern cultivars. G3 Genes Genom. Genet. 2021;11:jkab015. doi: 10.1093/g3journal/jkab015. - DOI - PMC - PubMed
    1. Duchesne A-N. Histoire Naturelle Des Fraisiers. Paris: Didot le Jeune et C. J. Panckoucke; 1766.
    1. Hancock JF, Luby JJ. Genetic resources at our doorstep: the wild strawberries. BioScience. 1993;43:141–147. doi: 10.2307/1312017. - DOI
    1. Hardigan MA, et al. Unraveling the complex hybrid ancestry and domestication history of cultivated strawberry. Mol. Biol. Evol. 2021;38:2285–2305. doi: 10.1093/molbev/msab024. - DOI - PMC - PubMed