. 2024 Mar 19;4(1):53.
doi: 10.1038/s43856-024-00454-6.

Early elevated IFNα is a key mediator of HIV pathogenesis

Affiliations

Early elevated IFNα is a key mediator of HIV pathogenesis

Hélène Le Buanec et al. Commun Med (Lond). .

Abstract

Background: A complete understanding of the different steps of HIV replication and an effective drug combination have led to modern antiretroviral regimens that block HIV replication for decades, but these therapies are not curative and must be taken for life. "Elite controllers" (ECs) is a term for the 0.5% of HIV-infected persons requiring no antiretroviral therapy, whose status may point the way toward a functional HIV cure. Defining the mechanisms of this control may be key to understanding how to replicate this functional cure in others.

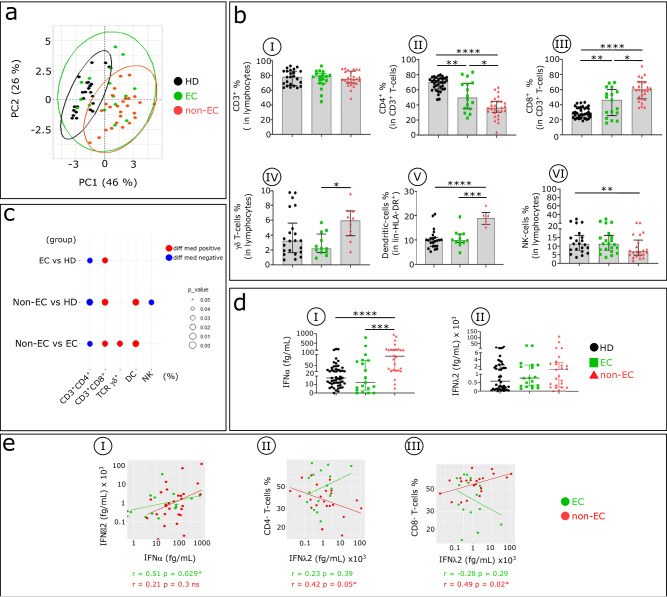
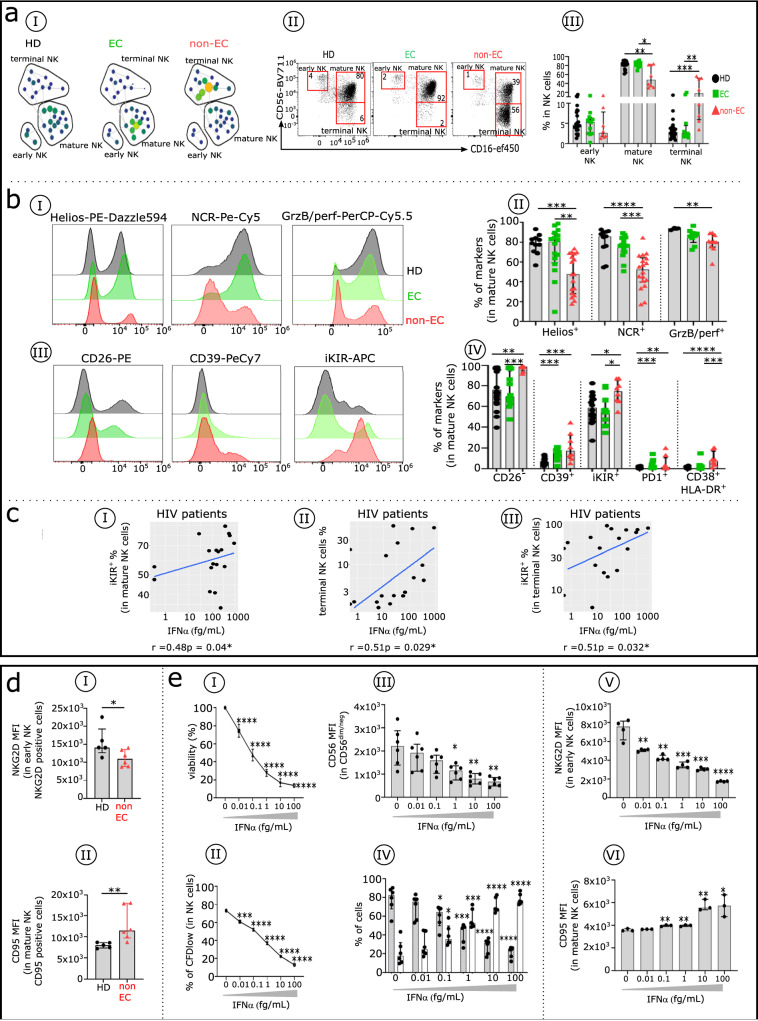
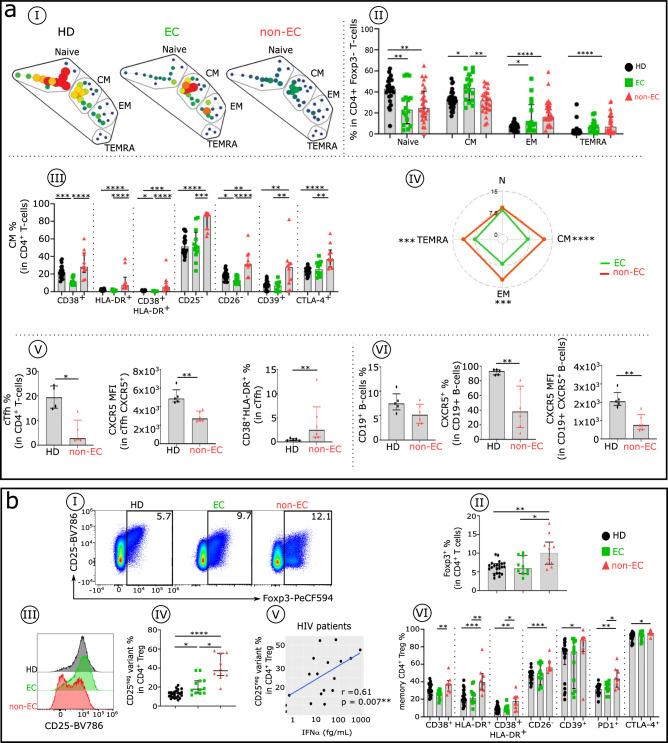
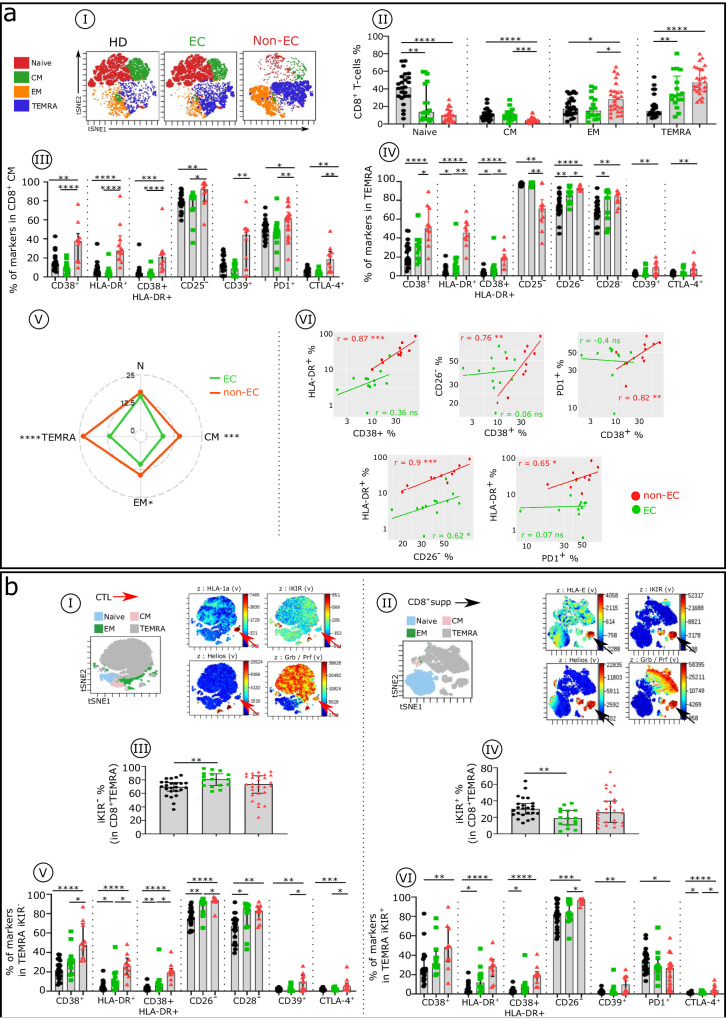
Methods: In ECs and untreated non-EC patients, we compared IFNα serum concentration, distribution of immune cell subsets, and frequency of cell markers associated with immune dysfunction. We also investigated the effect of an elevated dose of IFNα on distinct subsets within dendritic cells, natural killer cells, and CD4+ and CD8 + T cells.

Results: Serum IFNα was undetectable in ECs, but all immune cell subsets from untreated non-EC patients were structurally and functionally impaired. We also show that the altered phenotype and function of these cell subsets in non-EC patients can be recapitulated when cells are stimulated in vitro with high-dose IFNα.

Conclusions: Elevated IFNα is a key mediator of HIV pathogenesis.

Plain language summary

Currently, HIV infection is not curable, but infected individuals can manage their condition by taking daily doses of antiretroviral therapy. Some individuals, known as elite controllers (ECs), control their infection without antiretroviral treatment, and studying how their immune system responds to HIV exposure could lead to a potential cure for others. Here, we compare immune cell responses between ECs and untreated non-ECs. We find that IFNα, a small protein with an important role in controlling white blood cell activity, is produced in excess in immune cells from non-ECs compared with ECs during early infection. This insight provides an important clue for the future development of a targeted cure for HIV.


Conflict of interest statement

The authors declare no competing interests.

Figures

Fig. 1
Fig. 1. Comparative analysis of major blood immune cell subsets and serum IFNα and IFNλ2 concentrations in non-ECs, ECs, and HDs.
a PCA of data based on the proportion of different immune cell subpopulations (CD4+, CD8+, and TCR γδ Τ-cells, NKs, and DCs), evaluated by flow cytometry. Immune cell profiling was assessed by flow cytometry, as depicted in Supplementary Fig. 1. The first two principal components (PC1 and PC2) explaining the greatest differences among individuals are represented on a bi-plot. Each point represents one participant, with colors indicating the group: HDs (black), ECs (green), and non-ECs (red). Each group is outlined by an ellipse representing the 95% confidence interval of the sample groupings. b Histograms show distributions of indicated immune cell populations between HDs (black), ECs (green), and non-ECs (red). Analysis was done in 24 HDs, 16 ECs, and 26 non-ECs for all populations except for γδ T cells and DC (linHLA-DR+) (22 HDs, 12 ECs, 10 non-ECs). c Balloon plot summarizes the statistically significant changes in the indicated immune cell populations between ECs and HDs, non-ECs and HDs, and non-ECs and ECs. The size of the circle represents the p value. Red and blue indicate increased or decreased frequencies of immune cell populations. d Scatterplots show IFNα and IFNλ2 concentration in serum from HDs (n = 51), ECs (n = 18), and non-ECs (n = 26). IFNα and IFNλ2 levels were detected using SIMOA. e Scatterplot of relationships between IFNα and IFNλ2 serum levels (eI), CD4+T cells and IFNλ2 (eII), and CD8+T cells and IFNλ2 (eIII) in ECs (n = 18) and non-ECs (n = 26). Correlations were evaluated using Spearman’s rank correlation test. Multiple group comparisons were assessed using the Kruskal–Wallis test with Dunn’s multiple comparison testing. Values are medians and p values (*p < 0.05, **p < 0.01, ***p < 0.001, ****p < 0.0001). Error bars on graphs represent interquartile ranges.
Fig. 2
Fig. 2. Comparative distribution and immune phenotypic analysis of innate immune NK cells in HDs, ECs, and non-ECs.
a Comparative analysis of NK cell subsets distribution in HDs, ECs, and non-ECs. a1 SPADE tree with the distribution of the three main NK cell subsets in HDs (black), ECs (green), and non-ECs (red), based on CD56 and CD16 expression levels. Nodes are colored by count. aII Representative flow cytometry plots of NK cell subsets gated on CD19CD14TCRγδCD3HLA-DR cells from the three studied groups: early NK (CD56bright/CD16), mature NK (CD56dim/CD16+), and terminal NK (CD56CD16+). aIII Frequency of early, mature, and terminal NK cells in each studied group (HDs n = 22, ECs n = 12, and non-ECs n = 8). b Differential expression of checkpoint molecules on mature NK cells among HDs, ECs, and non-ECs. Profiles display the expression level of Helios, natural cytotoxicity receptors (NKp30, NKp44, and NKp46), granzyme/perforin (GrzB/perf) (bI), and CD26, CD39, inhibitory killer Ig-like receptors (iKIR) (bIII) on mature NK cells from HDs (black), ECs (green), and non-ECs (red). (bII and bIV). Boxplots displaying the frequency of the indicated markers in mature NK cells in each studied group. Analysis was done in 22 HDs, 12 ECs, and 8 non-ECs for all markers except for Helios and NCR (11 HDs, 16 ECs, 18 non-ECs) and GrzB/perf (3 HDs, 9 ECs, 10 non-ECs). c Scatterplots of the relationships between IFNα serum level and the frequencies of selected NK cell subsets. Correlations were evaluated using Spearman’s rank correlation test. d Comparison of NKG2D et CD95 level between HDs and non-ECs in early and mature NK cells. Histograms show the expression level (measured by median fluorescence intensity [MFI]) of NKGD2 in early NK cells (dI) and CD95 in mature NK cells (dII) in non-ECs (n = 6) and HDs (n = 5). e IFNα effects on NK cell viability, proliferation and phenotype. Percentage of viable NK cells (n = 3) (eI) and frequency of CFDlow NK cells (n = 3) (eII) after 7 days of culture in the presence of increasing doses of IFNα. Histograms show the expression level of CD56 in CD56dim/neg NK cells (n = 6) (eIII), distribution of mature (gray) and terminal NK cells (white) (n = 6) (eIV), expression levels of NKG2D in early NK cells (n = 3) (eV), and CD95 in mature NK cells (n = 3) (eVI) after 3 days of culture in the presence of IFNα. Comparisons between the two groups were performed using the Mann–Whitney U-test. Multiple group comparisons were made using the Kruskal–Wallis test with Dunn’s multiple comparison testing. *p < 0.05, **p < 0.01, ***p < 0.001, and ****p < 0.0001. Error bars on graphs represent interquartile ranges.
Fig. 3
Fig. 3. Phenotypic analysis of CD4+ Tconv cell subsets, CD4+ Treg cell subsets and CD19+ B cells in HDs, ECs, and non-ECs.
Comparative immune phenotypic analysis of a CD4+Tconv and CD19+B cells and b CD4+Treg cells in non-ECs, ECs, and HDs. aI SPADE tree with the distribution of CD4+Tconv subsets in HDs (black), ECs (green), and non-ECs (red). Nodes are colored by count. CD4+Tconv cells can be classified into four major subsets by their expression of CD45RA and the chemokine receptor CCR7: naïve (CCR7+CD45RA+), CM (CCR7+CD45RA), EM (CCR7CD45RA), and TEMRA (CCR7CD45RA+). aII Frequency of naïve, CM, EM, and TEMRA cells in each studied group (HDs n = 24, ECs n = 16, and non-ECs n = 23). Boxplots show the expression of the indicated marker in CD4+ CM cells (aIII) across the groups (HDs n = 22, ECs n = 12, and non-ECs n = 8). aIV Radar chart of the composite scores of phenotypic cell alteration calculated for each CD4+Tconv subpopulation in non-ECs and ECs (see Methods). aV Frequency of circulating T follicular helper cells (cTfh), expression levels of CXCR5 in cTfh, and frequency of cTfh co-expressing CD38 and HLA-DR in non-ECs (n = 6) and HDs (n = 5). aVI Proportion of CD19+ B cells and frequency and expression level of CXCR5 in CD19+B cells in non-ECs (n = 6) and HDs (n = 5). bI Representative flow cytometry plots of CD25+Foxp3+ cells within CD4+T cells isolated from HDs (n = 22), ECs (n = 12), and non-ECs (n = 8). bII Histograms with the frequency of Foxp3 in CD4+T cells and bIII displaying the CD25 expression level in CD4+ Foxp3+T cells and bIV the regulatory T cell (Treg) CD25 variant frequency in CD4+Foxp3 T cells in each studied group. bV Scatterplots of the relationships between frequency of the Treg CD25 variant in HIV-infected patients and serum IFNα levels. bVI Proportion of a specific functional signaling checkpoint on memory CD4+ Treg (CD4+ Foxp3+CD25+CD45RA) cells of each studied group (HDs n = 22, ECs n = 12, and non-ECs n = 8). Correlations were evaluated using Spearman’s rank correlation test. Comparisons between the two groups were made with the Mann–Whitney U-test. Multiple group comparisons were assessed using the Kruskal–Wallis test with Dunn’s multiple comparison testing. *p < 0.05, **p < 0.01, ***p < 0.001, ****p < 0.0001. Error bars on graphs represent interquartile ranges.
Fig. 4
Fig. 4. Comparative immune phenotypic analysis of CD8+T cell subsets in non-ECs, ECs, and HDs.
a Comparative analysis of CD8+T cell subsets distribution and phenotype in HDs, ECs, and non-ECs. aI Representative viSNE plot showing the distribution of CD8+T cell subsets, as described in Fig. 3 for CD4+Tconv in HDs (black), ECs (green), and non-ECs (red). aII Histograms of the frequencies of naïve, CM, EM, and TEMRA CD8+T cell subsets in each studied group (HDs n = 24, ECs n = 16, and non-ECs n = 23). Boxplots show the expression of the indicated marker in CD8+CM (aIII) and TEMRA (aIV) cells across the groups (HDs n = 22, ECs n = 12, and non-ECs n = 8). aV Radar chart of the composite scores of phenotypic cell alterations calculated for each CD8+T cell subpopulation in ECs and non-ECs (ECs n = 12 and non-ECs n = 8). aVI Scatterplots of the relationships between the expression level of indicated markers in CD8+CM cells (ECs n = 12 and non-ECs n = 8). b viSNE plot of the phenotypic difference between CD8+CTL (TEMRA iKIR) (bI) and CD8+ suppressive T cells (CD8+supp) (TEMRA iKIR+) (bII). t-SNE plot of CD8+T cell subsets indicated in different colors, with viSNE projections of expression of indicated markers. Red and black arrows indicate HLA-1a–restricted and HLA-E–restricted CD8+supp cells, respectively. Histograms show the frequency of CD8+TEMRA iKIR (bIII) and TEMRA iKIR+ (bIV) in each studied group (HDs n = 24, ECs n = 16, and non-ECs n = 26). Boxplots give the proportion of specific markers on CD8+TEMRA iKIR (bV) and TEMRA iKIR+ (bVI) in each studied group (HDs n = 22, ECs n = 12, and non-ECs n = 8). Correlations were evaluated using Spearman’s rank correlation test. Multiple group comparisons were made using the Kruskal–Wallis test with Dunn’s multiple comparison testing. *p < 0.05, **p < 0.01, ***p < 0.001, ****p < 0.0001. Error bars on graphs represent interquartile ranges.
Fig. 5
Fig. 5. Distinct immune cell phenotypic patterns between non-B57 and B57 ECs with an individual profile displayed by each patient in these subgroups.
a Comparative analysis of NK cells, CD4+ and CD8+ T-cell subset distribution in non-B57 and B57 ECs. aI PCA of studied non-B57 (ECB57−) and B57 (ECB57+) ECs based on the proportion of CD4+, CD8 + T cells, NK cells, and their subpopulations, evaluated by flow cytometry. Each point represents one participant, color-coded by group: ECB57− (blue), ECB57+ green). aII Heatmaps show the distribution of the indicated lymphocyte subsets in ECs. b Differential expression of checkpoint molecules on mature NK cells and different subsets of CD8+ T cells. Histograms show the frequency and index ratio of indicated subsets in mature NK (bI–III) and CD8+T cell compartments (bIV–VI). c Heatmaps of the frequency of indicated markers in CD4+ Treg, CD4+CM, CD8+CM, CD8+CTL, CD8+supp, and mature NK cells. Warmer colors indicate higher values and colder colors indicate lower values. Comparisons between the two groups were performed with the Mann–Whitney U-test. *p < 0.05, **p < 0.01, ***p < 0.001, ****p < 0.0001; ns not significant.

Update of

Similar articles

Cited by

  • TGF-β mediates epigenetic control of innate antiviral responses and SIV reservoir size.
    Ghneim K, Ten-Caten F, Santana AC, Latif MB, Dinamarca DAD, García-Salum T, Estrada PMDR, Sohal P, Strongin Z, Harper J, Jean S, Wallace C, Balderas R, Lifson JD, Raghunathan G, Rimmer E, Pastuskova C, Wu G, Micci L, Sieben LFM, Gerum PCL, Dos Santos J, Netea MG, van der Ven A, Silvestri G, Hazuda DJ, Gorman DM, Howell BJ, Sharma AA, Paiardini M, Soudeyns H, Ribeiro SP, Sekaly RP. Ghneim K, et al. Res Sq [Preprint]. 2025 Mar 19:rs.3.rs-5626892. doi: 10.21203/rs.3.rs-5626892/v1. Res Sq. 2025. PMID: 40166014 Free PMC article. Preprint.
  • IFNα induces CCR5 in CD4+ T cells of HIV patients causing pathogenic elevation.
    Le Buanec H, Schiavon V, Merandet M, How-Kit A, Song H, Bergerat D, Fombellida-Lopez C, Bensussan A, Bouaziz JD, Burny A, Darcis G, Sajadi MM, Kottilil S, Zagury D, Gallo RC. Le Buanec H, et al. Commun Med (Lond). 2024 Mar 19;4(1):52. doi: 10.1038/s43856-024-00453-7. Commun Med (Lond). 2024. PMID: 38504093 Free PMC article.

References

    1. Deeks SG, Walker BD. Human immunodeficiency virus controllers: mechanisms of durable virus control in the absence of antiretroviral therapy. Immunity. 2007;27:406–416. doi: 10.1016/j.immuni.2007.08.010. - DOI - PubMed
    1. Jiang C, et al. Distinct viral reservoirs in individuals with spontaneous control of HIV-1. Nature. 2020;585:261–267. doi: 10.1038/s41586-020-2651-8. - DOI - PMC - PubMed
    1. Martin MP, et al. Innate partnership of HLA-B and KIR3DL1 subtypes against HIV-1. Nat. Genet. 2007;39:733–740. doi: 10.1038/ng2035. - DOI - PMC - PubMed
    1. Migueles SA, et al. HLA B*5701 is highly associated with restriction of virus replication in a subgroup of HIV-infected long term nonprogressors. Proc. Natl Acad. Sci. USA. 2000;97:2709–2714. doi: 10.1073/pnas.050567397. - DOI - PMC - PubMed
    1. Zagury D, et al. Interferon alpha and Tat involvement in the immunosuppression of uninfected T cells and C-C chemokine decline in AIDS. Proc. Natl Acad. Sci. USA. 1998;95:3851–3856. doi: 10.1073/pnas.95.7.3851. - DOI - PMC - PubMed