. 2024 Mar 19;15(1):2461.
doi: 10.1038/s41467-024-46776-w.

Polyamine-mediated ferroptosis amplification acts as a targetable vulnerability in cancer

Affiliations

Polyamine-mediated ferroptosis amplification acts as a targetable vulnerability in cancer

Guoshu Bi et al. Nat Commun. .

Abstract

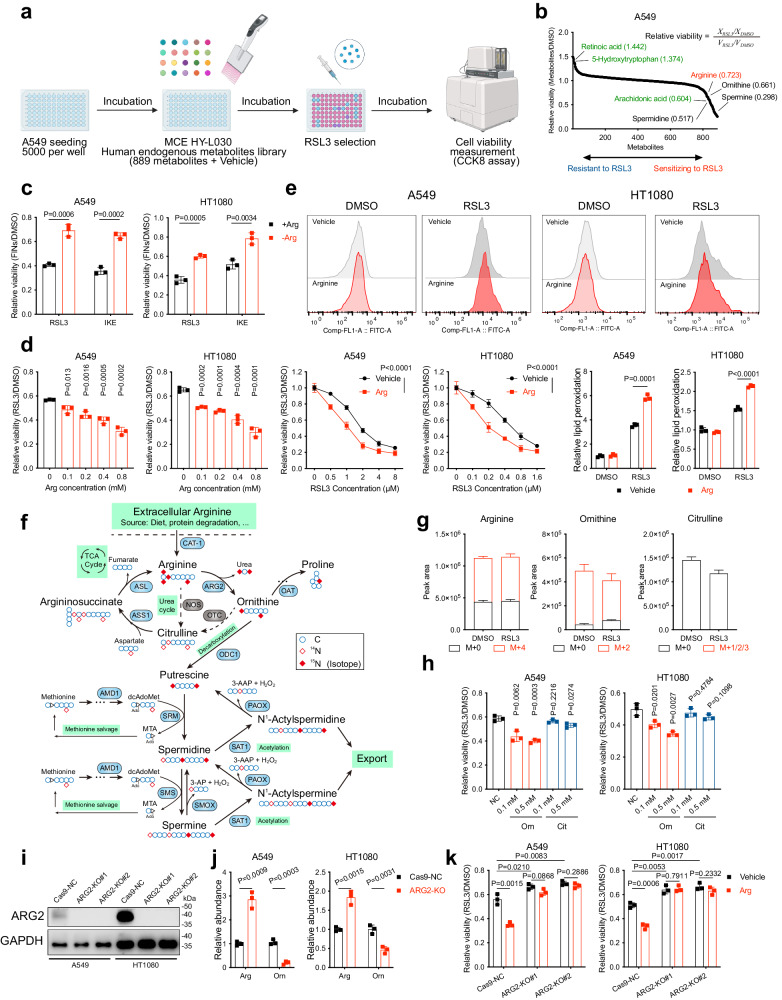
Targeting ferroptosis, an iron-dependent form of regulated cell death triggered by the lethal overload of lipid peroxides, in cancer therapy is impeded by our limited understanding of the intersection of tumour's metabolic feature and ferroptosis vulnerability. In the present study, arginine is identified as a ferroptotic promoter using a metabolites library. This effect is mainly achieved through arginine's conversion to polyamines, which exerts their potent ferroptosis-promoting property in an H2O2-dependent manner. Notably, the expression of ornithine decarboxylase 1 (ODC1), the critical enzyme catalysing polyamine synthesis, is significantly activated by the ferroptosis signal--iron overload--through WNT/MYC signalling, as well as the subsequent elevated polyamine synthesis, thus forming a ferroptosis-iron overload-WNT/MYC-ODC1-polyamine-H2O2 positive feedback loop that amplifies ferroptosis. Meanwhile, we notice that ferroptotic cells release enhanced polyamine-containing extracellular vesicles into the microenvironment, thereby further sensitizing neighbouring cells to ferroptosis and accelerating the "spread" of ferroptosis in the tumour region. Besides, polyamine supplementation also sensitizes cancer cells or xenograft tumours to radiotherapy or chemotherapy through inducing ferroptosis. Considering that cancer cells are often characterized by elevated intracellular polyamine pools, our results indicate that polyamine metabolism exposes a targetable vulnerability to ferroptosis and represents an exciting opportunity for therapeutic strategies for cancer.


Conflict of interest statement

The authors declare no competing interests.

Figures

Fig. 1
Fig. 1. Metabolite library screening links arginine and downstream ornithine to ferroptosis.
a Schematic of the metabolite library screening strategy. b The metabolite library screening results were exhibited as the relative viability of metabolite-treated cells versus vehicle-treated cells. After cell seeding, the A549 cells were pre-incubated with the metabolites contained in the library (MCE HY-L030) or Vehicle (DMSO) for 12 h. Then, the cells were further treated with 4 μM RSL3 or DMSO for 8 h and the cell viability was measured using CCK8. In the algorithm for the “Relative viability,” “X” represents the pre-treatment of a specific metabolite, and “V” represents the pre-treatment of Vehicle DMSO. c Cell viability in A549 or HT1080 cells treated with RSL3 (A549: 4 μM for 8 h; HT1080: 0.5 μM for 6 h) following pre-incubation in arginine-supplemented or -depleted medium for 16 h. d Cell viability in A549 or HT1080 cells treated with RSL3 following pre-treatment with arginine (left: as indicated, right: 0.5 mM) for 4 h. e Lipid peroxidation in A549 or HT1080 cells treated with RSL3 (A549: 2 μM; HT1080: 0.25 μM) for 3 h following pre-treatment with arginine. f Schematic depiction of 15N4-arginine tracing into arginine and polyamine metabolism. g Quantification of 15N4 abundance in the indicated metabolites in DMSO or RSL3 (0.5 μM, 24 h) treated A549 using LC-MS. h Cell viability in A549 or HT1080 cells treated with RSL3 following pre-treatment with ornithine or citrulline as indicated. i ARG2 protein levels in Cas9-NC and ARG2-KO (#1 and #2) cancer cell lines determined by western blotting. j Relative abundance of arginine and ornithine in Cas9-NC and ARG2-KO cancer cells determined by LC-MS. k Cell viability in A549 or HT1080 cells with indicated genotypes treated with RSL3 following pre-treatment with arginine. a is generated using Biorender. Data are presented as the mean ± SD, n = 3 independent experiments. Unpaired two-tailed Student’s t tests are used. Arg arginine, Orn ornithine, Cit citrulline. Source data are provided as a Source Data file.
Fig. 2
Fig. 2. Polyamines mediate arginine and ornithine’s pro-ferroptotic role.
a Cell viability in A549 or HT1080 cells treated with RSL3 or IKE (A549: 40 μM for 48 h; HT1080: 4 μM for 12 h) following pre-treatment with 10 μM polyamines (or as indicated) for 4 h. b Lipid peroxidation in A549 cells treated with RSL3 following pre-treatment with polyamines. c Cell viability in A549 or HT1080 cells treated with RSL3 or IKE following pre-treatment with 0.2 μM AMXT-1501 for 24 h. d Cell viability in A549 cells treated with 4 μM RSL3 for 8 h following pre-treatment with AMXT-1501 and polyamines. e Transmission electron microscopy images of A549 cells treated with 2 μM RSL3 for 4 h following pre-treatment with 10 μM polyamines for 4 h. Scale bars: 4 μm. f Cell viability A549 cells treated with RSL3 combined with or without DFO (100 μM), Fer-1 (10 μM), z-VAD-FMK (10 μM), or necrosulfonamide (0.5 μM) for 8 h following pre-treatment with polyamines. g Correlation between ODC1 expression and cancer cells’ sensitivity to ferroptosis inducers (RSL3, Erastin, ML210). Plotted data were mined from the CTRP database. Plotted values are Pearson’s correlation coefficients. Box plot indicates median, 25th and 75th percentiles, and minima and maxima of the distributions. n = 545 drugs. P value for correlation test: RSL3: 9.52 × 10−8; Erastin: 2.29 × 10−14; ML210: 1.04 × 10−7. h ODC1 protein levels in Cas9-NC and ODC1-KO (#1 and #2) cancer cell lines determined by western blotting. i Cell viability in A549 or HT1080 cells with indicated genotypes treated with RSL3 following pre-treatment with arginine. j ODC1 protein levels in A549 or HT1080 cells with indicated genotypes determined by western blotting. k Cell viability in A549 or HT1080 cells with indicated genotypes treated with RSL3. l Cell viability in A549 or HT1080 cells treated with RSL3 following pre-treatment with 500 μM DFMO for 16 h and arginine. Data are presented as the mean ± SD, n = 3 independent experiments. Unpaired two-tailed Student’s t tests are used. Source data are provided as a Source Data file.
Fig. 3
Fig. 3. Polyamines’ ferroptosis-promoting property depends on PAOX/SMOX mediated H2O2 production.
a Cell viability in A549 or HT1080 cells treated with RSL3 following siRNAs transfection for 48 h. b The protein levels of PAOX and SMOX in cancer cell lines with indicated genotypes determined by western blotting. c Cell viability in Cas9-NC and PAOX/SMOX-KO A549 or HT1080 cells treated with RSL3 following pre-treatment with polyamines. d Cell viability in Cas9-NC and PAOX/SMOX-KO A549 or HT1080 cells treated with RSL3 following pre-treatment with AMXT-1501 and DFMO. e Relative H2O2 level in Cas9-NC and ODC1-KO A549 or HT1080 cells treated with RSL3 (A549: 2 μM; HT1080: 0.25 μM) for 3 h, determined by H2DCFDA. f Relative H2O2 level in A549 or HT1080 cells treated with RSL3 following pre-treatment with polyamines. g Relative H2O2 level in Cas9-NC and PAOX/SMOX-KO A549 or HT1080 cells treated with RSL3. h Cell viability in vehicle- and △catalase-overexpressed A549 or HT1080 cells treated with RSL3 following pre-treatment with polyamines. i Cell viability in A549 or HT1080 cells with indicated genotypes treated with RSL3. Data are presented as the mean ± SD, n = 3 independent experiments. Unpaired two-tailed Student’s t tests are used. Source data are provided as a Source Data file.
Fig. 4
Fig. 4. Ferroptotic iron overload triggers ODC1 expression.
a Heatmaps exhibiting the expression levels of a series of polyamine metabolism-related genes in A549 or HT1080 cells treated with DMSO or RSL3 (A549: 2 μM; HT1080: 0.2 μM) for 4 h, determined by RNA-seq, n = 4. b mRNA levels of ODC1 in A549 or HT1080 cells treated with DMSO or RSL3 (A549: 0.5 μM; HT1080: 0.05 μM) combined with or without DFO or Fer-1 for 24 h, determined by qPCR. c Protein levels of ODC1 in A549 or HT1080 cells treated with DMSO or RSL3 (A549: 0.5 μM; HT1080: 0.05 μM) combined with or without DFO or Fer-1 for 24 h, determined by western blotting. d Quantification of 15N4 abundance in the indicated polyamines in DMSO or RSL3 (0.5 μM for 24 h) treated A549 using LC-MS. e Relative abundance of polyamines in A549 and HT1080 cells treated with DMSO or RSL3 (A549: 0.5 μM; HT1080: 0.05 μM) for 24 h, determined by LC-MS. f Confocal microscope images of FerroOrange-stained A549 or HT1080 cells treated with RSL3 (A549: 2 μM; HT1080: 0.25 μM) combined with or without DFO (100 μM) or Fer-1 (10 μM) for 3 h (scale bars, 100 μm). g, h mRNA (g) and protein (h) levels of ODC1 in A549 or HT1080 cells treated with FAC as indicated for 24 h. i Relative abundance of polyamines in A549 and HT1080 cells treated with FAC for 24 h, determined by LC-MS. Data are presented as the mean ± SD, n = 3 independent experiments unless otherwise stated. Unpaired two-tailed Student’s t tests are used. Source data are provided as a Source Data file.
Fig. 5
Fig. 5. Iron overload promotes ODC1 expression in an WNT/MYC-dependent manner.
a, b mRNA (a) and protein (b) levels of MYC in A549 or HT1080 cells treated with DMSO, 50 μM FAC, or RSL3 combined with or without DFO or Fer-1. c, d mRNA (c) or protein (d) levels of ODC1/MYC in A549 or HT1080 cells treated with 10 μM LF3 or SKL2001 for 24 h. e Cell viability in A549 or HT1080 cells treated with RSL3 following pre-treatment with LF3 or SKL2001 as indicated. f Lipid peroxidation in A549 treated with RSL3 following pre-treatment with 10 μM LF3 or SKL2001 for 24 h. g The binding between MYC and the promoter region of ODC1 was quantified through a CHIP assay followed by qPCR. h Luciferase activity in HEK-293T cells treated with for FAC, DFO or SKL2001 for 24 h, following transfection of indicated plasmids. i mRNA level of ODC1 in A549 or HT1080 cells treated with DMSO, FAC, or RSL3 following pre-treatment of LF3. j Protein level of ODC1 and MYC in A549 or HT1080 cells treated with DMSO, FAC or RSL3 following pre-treatment of LF3. Data are presented as the mean ± SD, n = 3 independent experiments. Unpaired two-tailed Student’s t tests are used. Source data are provided as a Source Data file.
Fig. 6
Fig. 6. Ferroptotic cells release polyamine-containing extracellular vesicles (EVs) and accelerate the spread of ferroptosis to surrounding healthy cells.
a, b The cells were treated by DMSO- or RSL3 (A549: 0.5 μM; HT1080: 0.05 μM) containing medium for 24 h, then the medium was collected (a). The treated cells were then cultured in the same volume of fresh medium, and the new medium was also collected after 24 h incubation (b). Relative abundance of polyamines in the collected medium was determined by LC-MS. c, d Schematic depiction of the medium-exchange assay (c). Briefly, the cells seeded in 9-cm dishes were treated by DMSO- (plate B) or RSL3 (A549: 0.5 μM; HT1080: 0.05 μM, plate A) containing medium for 24 h, then the medium was discarded and the cells were washed with PBS. The cells were then incubated with the same volume of fresh medium for 24 h, and the new medium was collected as “medium B” or “medium A” and used for subsequent experiments. Healthy A549 or HT1080 with indicated genotypes were seeded in 96-well plates. After pre-treatment with AMXT-1501, the cells were then cultured in “medium B” or “medium A” as indicated for 4 h, followed by RSL3 treatment and cell viability assessment using CCK8 (d). e Relative polyamine levels within EVs derived from DMSO- or RSL3-treated A549 and HT1080 cells. f EVs were isolated from cell culture medium of A549 and HT1080 cells treated with DMSO or RSL3 (A549: 0.5 μM; HT1080: 0.05 μM) for 24 h. The cells and EVs were lysed and the protein levels of CD63, CD81, TSG101 and GM130 were determined by western blotting. g Cell viability in A549 or HT1080 cells treated with RSL3 following pre-treatment with EVs derived from (e) and (f). Panel c is generated using Biorender. Data are presented as the mean ± SD, n = 3 independent experiments. Unpaired two-tailed Student’s t tests are used. Source data are provided as a Source Data file.
Fig. 7
Fig. 7. Polyamine promotes radiotherapy- and chemotherapy-induced ferroptosis.
a Clonogenic survival curves of A549 or HT1080 cells exposed to radiotherapy (RT) at indicated doses following pre-treatment with polyamines. b Cell viability in A549 or HT1080 cells treated with CDDP as indicated for 48 h following pre-treatment with polyamines. c Lipid peroxidation assessment in A549 or HT1080 cells at 24 h after exposure to 6 Gy of RT or 10 μM CDDP following pre-treatment with polyamines. d (left) Clonogenic survival fraction of A549 or HT1080 cells exposed to radiotherapy (RT) at indicated doses combined with or without Fer-1 following pre-treatment with polyamines. (right) Cell viability in A549 or HT1080 cells treated with CDDP (A549: 20 μM; HT1080: 10 μM) combined with or without Fer-1 for 48 h following pre-treatment with polyamines. Data are presented as the mean ± SD, n = 3 independent experiments. Unpaired two-tailed Student’s t tests are used. Source data are provided as a Source Data file.
Fig. 8
Fig. 8. Polyamine metabolism is a potential target of ferroptosis-based cancer treatment.
ad Image of resected tumours from A549 mice xenografts. Groups of mice were treated as indicated (n = 6 per group). The growth of tumour volumes and the final weight of resected tumours were also shown (a, c). Representative immunohistochemical images of the resected tumours in each group (scale bars, 40 μm) (b, d). e The distribution of polyamines in the section of the surgically resected LUAD and adjacent normal tissue, determined by spatially resolved metabolomics. f A schematic model depicting the polyamine-mediated ferroptosis amplification and diffusion. Panel f is generated using Biorender. Data are presented as the mean ± SD. Unpaired two-tailed Student’s t tests are used. Source data are provided as a Source Data file.

Similar articles

Cited by

References

    1. Dixon SJ, et al. Ferroptosis: an iron-dependent form of nonapoptotic cell death. Cell. 2012;149:1060–1072. doi: 10.1016/j.cell.2012.03.042. - DOI - PMC - PubMed
    1. Stockwell BR, et al. Ferroptosis: a regulated cell death nexus linking metabolism, redox biology, and disease. Cell. 2017;171:273–285. doi: 10.1016/j.cell.2017.09.021. - DOI - PMC - PubMed
    1. Lei G, Zhuang L, Gan B. Targeting ferroptosis as a vulnerability in cancer. Nat. Rev. Cancer. 2022;22:381–396. doi: 10.1038/s41568-022-00459-0. - DOI - PMC - PubMed
    1. Mao C, et al. DHODH-mediated ferroptosis defence is a targetable vulnerability in cancer. Nature. 2021;593:586–590. doi: 10.1038/s41586-021-03539-7. - DOI - PMC - PubMed
    1. Lei G, et al. The role of ferroptosis in ionizing radiation-induced cell death and tumor suppression. Cell Res. 2020;30:146–162. doi: 10.1038/s41422-019-0263-3. - DOI - PMC - PubMed