. 2024 Apr;21(4):723-734.
doi: 10.1038/s41592-024-02216-7. Epub 2024 Mar 19.

Multicenter integrated analysis of noncoding CRISPRi screens

Affiliations

Multicenter integrated analysis of noncoding CRISPRi screens

David Yao et al. Nat Methods. 2024 Apr.

Abstract

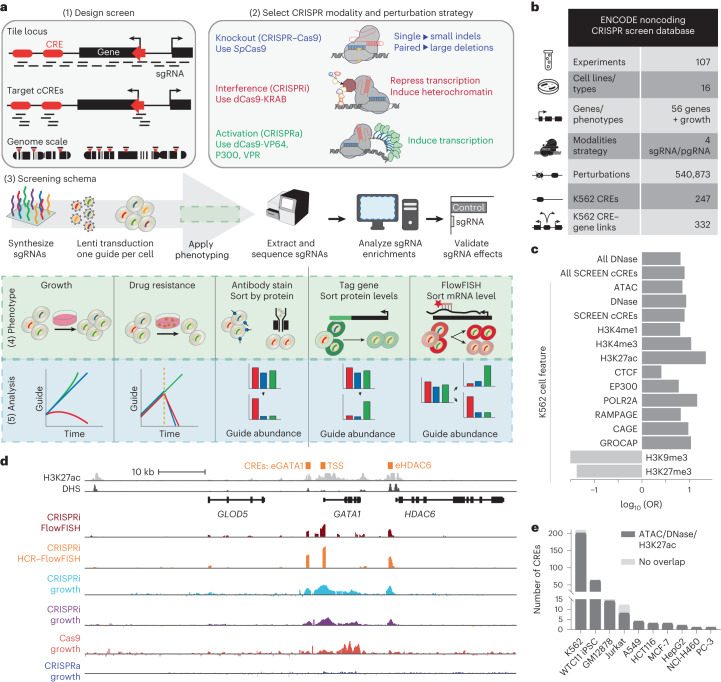
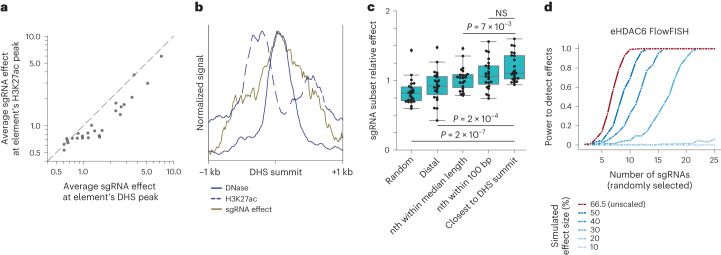
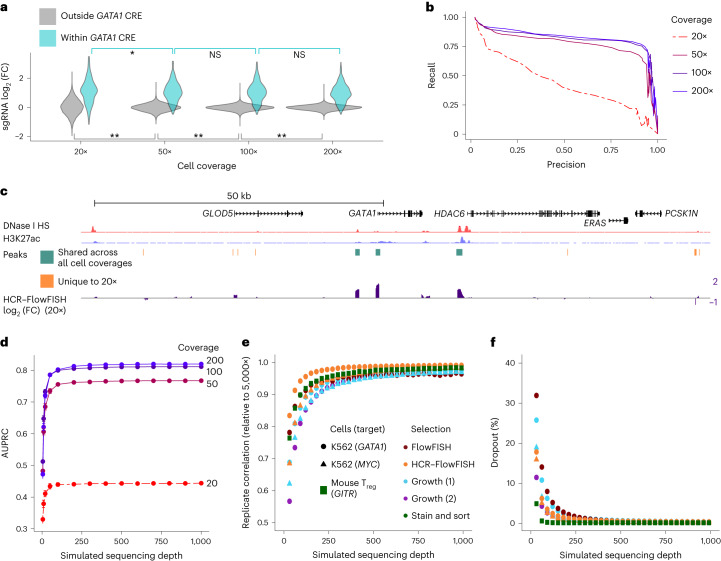
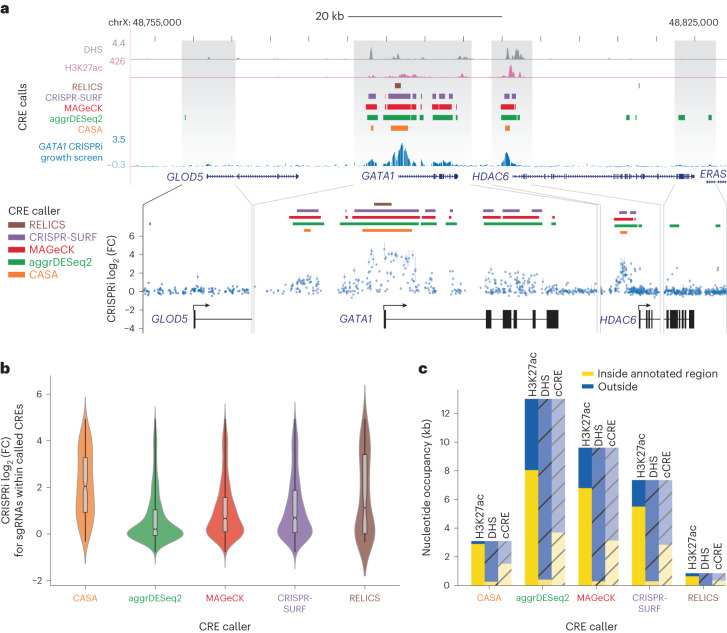
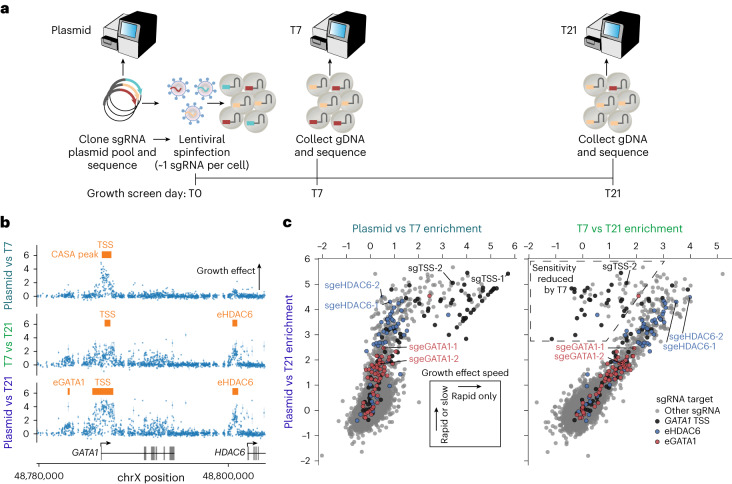
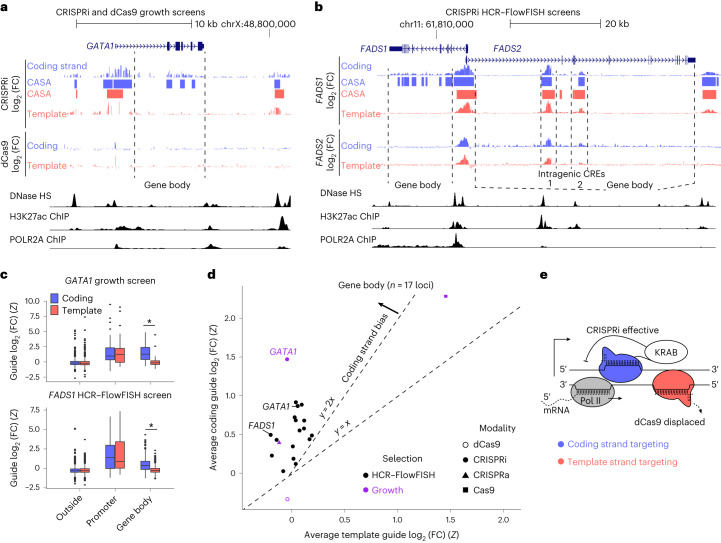
The ENCODE Consortium's efforts to annotate noncoding cis-regulatory elements (CREs) have advanced our understanding of gene regulatory landscapes. Pooled, noncoding CRISPR screens offer a systematic approach to investigate cis-regulatory mechanisms. The ENCODE4 Functional Characterization Centers conducted 108 screens in human cell lines, comprising >540,000 perturbations across 24.85 megabases of the genome. Using 332 functionally confirmed CRE-gene links in K562 cells, we established guidelines for screening endogenous noncoding elements with CRISPR interference (CRISPRi), including accurate detection of CREs that exhibit variable, often low, transcriptional effects. Benchmarking five screen analysis tools, we find that CASA produces the most conservative CRE calls and is robust to artifacts of low-specificity single guide RNAs. We uncover a subtle DNA strand bias for CRISPRi in transcribed regions with implications for screen design and analysis. Together, we provide an accessible data resource, predesigned single guide RNAs for targeting 3,275,697 ENCODE SCREEN candidate CREs with CRISPRi and screening guidelines to accelerate functional characterization of the noncoding genome.


Conflict of interest statement

A.K. is a scientific cofounder of Ravel Biotechnology, is on the scientific advisory board of PatchBio, SerImmune, AINovo, TensorBio and OpenTargets, is a consultant with Illumina and owns shares in DeepGenomics, Immuni and Freenome. C.A.G. is a cofounder of Tune Therapeutics and Locus Biosciences and is an advisor to Tune Therapeutics and Sarepta Therapeutics. C.A.G. is an inventor on patents and patent applications related to CRISPR epigenome editing. J.T. and M.C.B. acknowledge an outside interest in Stylus Medicine. L.L. is currently employed by Sana Biotechnology. D.Y. is currently employed by Amber Bio. P.C.S. is a cofounder of and consultant to Sherlock Biosciences and board member of Danaher Corporation. P.C.S. is a shareholder in both companies. W.J.G. is a cofounder of Epinomics and an advisor to 10x Genomics, Guardant Health and Centrillion. J.M.E. is an inventor on patents and patent applications related to CRISPR screening technologies, received materials from 10x Genomics unrelated to this study, and received speaking honoraria from GSK plc. The remaining authors declare no competing interests.

Figures

Fig. 1
Fig. 1. The ENCODE noncoding CRISPR screening database.
a, CRISPR noncoding strategies including (1) perturbation design strategies, (2) CRISPR modality and perturbation strategies, (3) workflow of a standard screen, (4) phenotyping strategies and (5) analysis approaches; SpCas9, Streptococcus pyogenes Cas9; indels, insertions/deletions. b, Summary of the CRISPR screen data performed in human cell lines/types from the April 2022 release of the ENCODE portal. ‘Experiments’, ‘Cell lines/types’, ‘Modalities’, ‘Strategy’, ‘Genes/phenotypes’ and ‘Perturbations’ reflect all human CRISPR screens. ‘K562 CREs’ and ‘K562 CRE–gene links’ reflect results of K562-focused analysis; pgRNA, paired sgRNA. c, OR for genomic annotation overlap with CRISPR screen-identified regulatory elements (n = 210; Methods). ‘All’ refers to cell-agnostic features. K562 refers to cell-type annotations. All ORs were significant at a P value of <0.01, and values were log10 transformed for visualization (two-sided Fisher’s exact test). d, Genome browser snapshot of the GATA1 locus including H3K27ac (light gray) and DHS signal (dark gray) in K562 cells. CRISPR screen data (signal log2 (FC)) for one replicate each of CRISPRi FlowFISH (dark red), CRISPRi HCR–FlowFISH (orange), Tycko et al. CRISPRi growth (light blue), Fulco et al. CRISPRi growth (purple), Cas9 growth (red) and CRISPRa growth (dark blue). Previously validated GATA1 CREs are labeled on top in orange. e, The number of CREs that are significant in a CRISPR screen and overlap accessible chromatin regions, defined by ATAC-seq and DNase-seq and/or H3K27ac ChIP–seq peaks (dark gray) or do not overlap those features in ten cell lines (A549: 4/4; GM12878: 14/14; HCT116: 3/3; HepG2: 2/2; Jurkat: 8/12; K562: 200/210; MCF-7: 3/3; NCI-H460: 1/1; PC-3: 1/1; WTC11: 65/66).
Fig. 2
Fig. 2. Integrated analysis of noncoding CRISPR screens provides guidelines for selecting cCRE targets and sgRNAs.
a, Average effects of all sgRNAs within DHS or H3K27ac peaks at significant enhancers intersecting both epigenetic features. b, bigWig P value signal tracks for H3K27ac ChIP–seq and DNase-seq and bp-normalized effects of 6,338 sgRNAs within ±1 kb of DHS summits for 27 significant enhancers intersecting 32 DHS and H3K27ac peaks (n = 20 loci from HCR–FlowFish screens). c, Comparison of sgRNA selection strategies. Points reflect effects of ten sgRNAs selected by the indicated method for significant enhancers normalized to the mean effect of all sgRNAs in that enhancer. ‘Random’ is the average of 100 random subsets across the DHS peak. ‘Distal’ are sgRNAs closest to half the median DHS peak length (179 bp) from the summit. Every ‘nth’ sgRNA is selected by ordering sgRNAs by their protospacer-adjacent motif’s (PAM’s) genomic coordinate and selecting every nth sgRNA such that their ranked orders are evenly spaced. ‘Closest’ sgRNAs are nearest to the DHS summit. Boxes show quartiles, with lines at medians; lines extend 1.5 times the interquartile range. Significance was evaluated using a Welch’s t-test on the indicated pairwise comparisons; NS, not significant. d, Power simulation to detect significant effects on GATA1 expression as a function of enhancer effect sizes and sgRNA number. Power was computed by simulations of CRISPRi FlowFISH data, where sgRNA effects in the eHDAC6 element were scaled such that the average adjusted effect of all sgRNAs in the enhancer was 10–50% or unscaled (n = 3 biological replicates).
Fig. 3
Fig. 3. Cell coverage and sequencing depth impact reliable detection of CREs.
a, Distributions of HCR–FlowFish guidewise log2 (FC) effect sizes (total of 13,732 PAMs targeted) at various cell coverages separately for sgRNA targets within (N = 288) and outside known GATA1 CREs (n = 13,444). Asterisks denote significant changes in variance; *P ≤ 0.01 and **P < 2.2 × 10–16 by two-sided Levene’s test; NS, P > 0.2. b, Precision–recall curve for identifying GATA1 CRE-targeting sgRNAs using effect sizes from various cell coverages (AUPRC: 20× = 0.44, 50× = 0.77, 100× = 0.81, 200× = 0.82; CRISPRi HCR–FlowFish). c, log2 (FC) signals for 20× and CASA peak calls shared across all coverages and unique to 20×. DNaseI HS, DNase I hypersensitive site. d, AUPRC for identifying GATA1 CRE-targeting sgRNAs with varying sequencing depth (bootstrap sampled) and cell coverages (20×, 50×, 100× and 200×). Dots and error bars indicate averages and 99% confidence intervals over ten bootstrap samples. e,f, Biological replicate reproducibility (Pearson correlation of guidewise log2 (FC)) normalized to 5,000× simulated sequencing depth (e) and guide dropout rate (dropout defined as less than ten mapped reads) in diverse CRISPRi screens with varying sequencing depth (bootstrap sampled; f). Dots show an average over 100 bootstrap samples. The GATA1 (circles) and MYC (triangles) screens in human K562 cells were performed with varied readout methods (colors). The GITR screen (rectangle) in mouse regulatory T cells (Treg) used protein staining followed by sorting. The growth datasets included are (1) Tycko et al. and (2) Fulco et al..
Fig. 4
Fig. 4. CRISPR screen analysis tools identify CREs with varying selectivity.
a, sgRNA-mediated growth effects (blue), H3K27ac ChIP signal (pink) and DHS (gray) for a CRISPRi growth screen at the GATA1 locus. sgRNAs were filtered to remove any low-specificity sgRNAs (GuideScan aggregated CFD < 0.2), which could cause confounding off-target toxicities. Dense tracks show peak calls using five different CRISPR screen analysis tools: CASA (orange), aggrDESeq2 (green), MAGeCK (red), CRISPR-SURF (purple) and RELICS (brown). Zoomed-in regions show log2 (FC) of individual sgRNA effects (points indicate the mean values, and bars indicate the minimum–maximum range of observations between n = 2 replicates). b, Distribution of average guide effects calculated from two experimental replicates for sgRNAs falling within peaks identified by different CRISPR screen analysis tools (center line, median; notch, confidence interval of the median; box limits, first and third quartiles; whiskers, range of all data points; violin, kernel density estimation; n = 204, 1,218, 715, 623 and 71 sgRNAs within CREs from left to right; Welch’s two-tailed t-test versus shuffled –log10 (P) = 55.2, 59.3, 68.8, 66.6 and 8.3). c, CRISPRi screen peak area intersecting (yellow) and complementing (blue) annotated chromatin features (H3K27ac, DHS) and ENCODE SCREEN cCREs. Shading and hashing indicate which reference annotation is used for the comparison, and total bar height reflects total genomic area demarcated as significant by the peak caller.
Fig. 5
Fig. 5. Perturbation dynamics impact screen sensitivity and resolution.
a, Timeline of CRISPRi growth screen with quantified sgRNA abundances of the sgRNA plasmid library before delivery and at T7 and T21 after sgRNA lentiviral delivery. b, CRISPRi growth screen at the GATA1 locus shown with different time point comparisons (top, plasmid versus T7; middle, T7 versus T21; bottom, plasmid versus T21) used to compute sgRNA effect sizes. Each dot shows the average log2 (FC) effect size of two biological replicates for an sgRNA, and the error bar shows the range. CASA peak calls for significant growth effects are shown. The GATA1-regulating CREs eGATA1, GATA1 TSS and eHDAC6 are labeled with their corresponding CASA peak calls. c, Scatter plot of sgRNA effect sizes as determined by different time point comparisons. Each dot shows the average of two biological replicates for an sgRNA. Black or colored dots are sgRNAs targeting the TSS or enhancers, respectively. The sgRNAs along the diagonal line of points, including sgTSS-1, drop out by T7 and thus are absent from the T7 versus T21 comparison. sgRNAs selected for validation assays are labeled.
Fig. 6
Fig. 6. CRISPRi effects in the gene body are strand specific.
a, Strand-specific CRISPRi growth screen affects tiling GATA1. CRISPRi and dCas9 tracks show the average of two biological replicates comparing day 21 to plasmid (N = 2,541 coding strand- and 2,263 template strand-targeting sgRNAs). b, Strand-specific CRISPRi HCR–FlowFish screen affects tiling FADS1 and FADS2. CRISPRi tracks show the average of two biological replicates comparing high- and low-expression bins for the target gene (n = 4,609 and 4,942 sgRNAs per strand). c, Distributions of sgRNA effects (average of two biological screen replicates) in the gene body and at the promoter (within 2 kb upstream of the TSS), when sgRNAs are categorized by target strand in the (top) GATA1 CRISPRi growth screen (n = 2,026, 1,731, 34, 27, 100 and 77 sgRNAs from left to right) and the (bottom) FADS1 HCR–FlowFish screen (n = 3,121, 3,249, 90, 69, 520 and 702 sgRNAs). Boxes show the quartiles with a line at the median, vertical lines extend to 1.5 times the interquartile range, and dots show outliers. Asterisks denote significance with P < 1 × 10–15 by two-sided t-test. d, Strand specificity across screens tiling 17 loci for sgRNAs targeting the gene body. Each point is the average effect of all sgRNAs from a screen targeting that region averaged across two screen biological replicates, with color indicating the phenotypic readout and shape indicating the type of CRISPR perturbation. e, Proposed model of gene body strand bias.
Extended Data Fig. 1
Extended Data Fig. 1. Integrated analysis of K562 screens nominates features of functional CREs.
A) The percent of total significant CREs (n = 210) that intersect union sets of annotations from ENCODE biosamples and K562 annotations. B) Upset plot of the intersection of significant CREs with SCREEN K562 cCREs, and K562-annotated accessible chromatin regions, histone marks, EP300, CTCF, POLR2A, peaks. Blue highlight indicates CREs that intersect all features. C) Signal fold change over background for K562 features in CREs (n = 210 CREs, colored in green) versus perturbed regions (n = 3213 regions, colored in gray). Note each value was increased by 0.01 and then log10-transformed for visualization. All comparisons except H3K9me3 were significant at P value < 0.01 (Two-sided Wilcoxon test P values noted in the plot). Full test results and mean and median signal values reported in Supplementary Table 7. Each box ranges from the first quartile to the third quartile with a line drawn at the median. Lines extend to 1.5x the interquartile range and individual dots extending beyond this range indicate outliers.
Extended Data Fig. 2
Extended Data Fig. 2. Features of functional CREs in iPSCs.
A) Significant CREs (n = 66) that intersect union sets of annotations from WTC11 iPSCs, iPS DF6.9, and iPS DF19.11. B) Intersection of significant CREs with iPS-annotated accessible chromatin regions and histone mark peaks. Blue indicates CREs that intersect all activating annotations (H3K4me1/3, H3K27ac, ATAC, DNase).
Extended Data Fig. 3
Extended Data Fig. 3. Overlapping targets and hits of CRISPR screens at the MYC and GATA1 loci.
A) Genome browser snapshot of the MYC locus including H3K27ac (light gray) and DHS signal (dark gray) in K562 cells. CRISPR screen effects (mean log2FC, n = 2 screen replicates) and sgRNA locations (bars) for CRISPRi-HCR-FlowFISH (FF) (orange) and Tycko et al. 2019 (ref. ) CRISPRi-growth (blue). B) Number of overlapping PAM coordinates across 5 screens in the GATA1 and C) MYC loci. D) Pearson correlation for effects of sgRNAs that are shared across screens tiling GATA1. Each screen has 2-3 replicates shown as squares. E) Percentage of exon (gray, total n = 172, 78, 72 from left to right) or K562 DHS targeting guides in the GATA1 locus chrX:48,773,708-48,801,225 (black, total n = 322, 153, 158 from left to right) with significantly high log2FC effect sizes (Z-test using mean and variance from negative controls p-value < 0.001). Note this is a conservative hit threshold, and some DHSs are not expected to affect GATA1 expression. F) Guide effects in GATA1 tiling growth screens (Tycko et al. 2019 (ref. )) with different CRISPR modalities. Data is shown only for sgRNAs that target a previously-validated GATA1 CRE (colors) or a GATA1 exon (shape). Guides are filtered for high-specificity with GuideScan CFD > 0.2 (markers show mean log2FC, n = 2 screen replicates).
Extended Data Fig. 4
Extended Data Fig. 4. Selecting cCREs and targeting sgRNAs near DHS summits.
A) Epigenetic feature peak intersections with significant CREs identified in 16 HCR-FlowFISH screens. B) Browser track highlighting two significant enhancers within FADS2. The K562 All TF ChIP track was created by concatenating all ENCODE K562 TF ChIP-seq experiments, and de-duplicating non-unique peak calls. The height of the track represents the number of unique TFs with peaks at a position. The average effects of each sgRNA from the FADS1 HCR-FlowFISH screen (n = 2 replicates). C) The effects of all sgRNAs across all HCR-FlowFISH screens within 2000 bases of a significant enhancer’s DHS peak are plotted, normalized to the average effect of all sgRNAs in their enhancer. D) Same as (C), except sgRNAs are separated into 20 bp bins, with the mean of the sgRNA’s enhancer-relative effects plotted for each bin; loess regression line drawn in blue. E) Comparison of sgRNA selection strategies for K562 HCR FlowFISH gene screens (n = 20 loci), separated by gene expression levels (lowly expressed ≤ 100 TPM, highly expressed > 100 TPM) or F) gene body lengths (shorter gene ≤ 20 kb, longer gene > 20 kb) or. Points reflect the effects of 10 sgRNAs for significant enhancers, normalized to the mean effect of all sgRNAs in that enhancer. ‘Random’ is the average of 100 random subsets from across the DHS peak. ‘Distal’ are sgRNAs closest to half the median DHS peak length (179 bp) from the summit. Every ‘nth’ sgRNA is selected by arranging sgRNAs in order of their PAM’s genomic coordinate, and selecting every nth sgRNA such that their ranked orders are evenly spaced. ‘Closest’ sgRNAs are nearest to the DHS summit. Boxes show the quartiles, with a line at the median, lines extend to 1.5 times the interquartile range, and dots beyond lines show outliers. Significance evaluated using Welch’s t-test on each pairwise comparison.
Extended Data Fig. 5
Extended Data Fig. 5. A stain-and-sort screen for GITR expression in primary mouse Regulatory T-cells.
A) Schematic for a screen for GITR expression in primary mouse Regulatory T-cells. The sgRNA library is delivered by retrovirus that also contains a Thy1.1 surface marker reporter gene. B) Gates used for sorting viable CD4 + /Thy1 + /Foxp3-eGFP+ cells into GITR-Lo and GITR-Hi bins. C) Flow analysis of GITR expression in the sorted populations. D) Correlation between accessibility score and sgRNA perturbation effect. E) Genome browser view of GITR locus and sgRNA effects (circles show mean of n = 4 screen biological replicates). The union and intersection of CASA peaks across replicates and the aggrDESeq2 peak calls are shown in orange and green, respectively.
Extended Data Fig. 6
Extended Data Fig. 6. The majority of and the strongest significant CREs are within the same TAD as their target gene.
A) Significant CREs in K562 screens with adjusted p-values ≤ 0.05 that reside inside a K562 HiC TAD were included for analysis. For each CRE’s target gene, it was determined if the consensus RefSeq promoter 1 kb window around the TSS was in the same TAD as the CRE. B) The effect size of the CREs in the same or different TAD as the target gene (n = 188 and 31, respectively; * denotes p = 2.8e-12 by Welch’s t-test). C) The p-values for these CREs.
Extended Data Fig. 7
Extended Data Fig. 7. Power related to sgRNAs per element and impact of sgRNA specificity and sequence.
A) The power to detect significant effects on gene expression as a function of the number of sgRNAs targeting each element and the effect size of that element. Power was computed by simulations based on the average sgRNA effects from three biological replicates of GATA1 CRISPRi-FlowFISH data, where the individual sgRNA effects in the eGATA1 element were scaled such that the average adjusted effect of all sgRNAs in the enhancer was 10-50% of the promoter, in steps of 10%. B) Power analysis for detecting significant effects as a function of the number of sgRNAs targeting the Gitr enhancer chr4:156021490-156022916. Simulations were based on the average sgRNA effects from four biological replicates of the GITR-staining Sort-seq experiment. C) sgRNA PAM distance to DHS summits compared with GuideScan CFD specificity scores, for all GuideScan sgRNAs in HCR-FlowFISH identified CREs that intersect DHS and H3K27ac peaks. Horizontal dashed line indicates GuideScan CFD specificity threshold of 0.2. D) Enrichment of sgRNAs with significant effects among sgRNAs with low specificity scores (GuideScan CFD < 0.2) in regions at least 1 kilobase away from any DHS peak in K562 cells for the indicated screens. The p-value from Fisher’s exact test is shown for each, and the significant (p < 0.05) bar is colored. E) Distribution of sgRNA effects normalized to the average effect of all sgRNAs in their respective CREs, for sgRNAs with spacers that do or do not contain a ‘TTTT’ U6 termination sequence, using sgRNAs that target significant enhancers that intersect DHS and H3K27ac peaks. Boxes show the quartiles, with a line at the median, lines extend to 1.5 times the interquartile range, and dots show outliers. TTTT-containing sgRNA n = 195; Non TTTT-containing sgRNA n = 3940 (Welch’s t-test P value = 1.7e-4).
Extended Data Fig. 8
Extended Data Fig. 8. Evaluating methods of selecting negative and positive control sgRNAs.
A) Boxplot of subsample variances for negative control sgRNAs in the CD164 HCR-FlowFISH screen, in increments of 100 sgRNAs subsampled 1000 times each from a total of 1000 sgRNAs for each type of negative control sgRNA. Each type of negative control was subsampled separately. Boxes show the quartiles, with a line at the median, lines extend to 1.5 times the interquartile range, and dots show outliers. B) Empirical P values from Levene’s test on subsampled negative control sgRNAs, in increments of 10 sgRNAs subsampled 1000 times, compared to the entire set of the respective type of negative control sgRNA. P = 0.05 threshold is indicated by the black line. C) Comparison of the average effect from both biological replicates of the 10 sgRNAs closest to the FANTOM5- and refGene-nominated TSSs for the HCR-FlowFISH genes against the sgRNAs provided by the Dolcetto or the hCRISPRi-v2 libraries, which may target one or more of these–or distinct–TSSs. Each point reflects an individual TSS (for the FANTOM5 and refGene TSSs) or the set of 4-10 sgRNAs from the Dolcetto or hCRISPRi-v2 libraries that were tested in the HCR-FlowFISH screens.
Extended Data Fig. 9
Extended Data Fig. 9. Representative bootstrap samples for low and high sequencing depths using K562 GATA1 locus CRISPRi growth screen.
A) Biological replicate 1 log2FC vs Biological replicate 2 log2FC (Z-score) for 30x bootstrapped sequencing depth (9977 sgRNAs, R = 0.45). B) Biological replicate 1 log2FC vs Biological replicate 2 log2FC for 300x (R = 0.73). C) Empirical cumulative distribution function of sgRNA read counts across the library for samples at 30x (red) or 300x (blue) bootstrapped sequencing depth (vertical dashed line: read count = 10). D) Dropout plot showing sgRNAs ranked by read counts at 30x (red) and 300x (blue) bootstrapped sequencing depth.
Extended Data Fig. 10
Extended Data Fig. 10. CRISPRi strand bias in the gene body.
A) CRISPRi effects shown relative to the position of the TSS and transcription end site (TES). The TES is defined as the end of the transcript in UCSC RefGene (hg38). Points show average normalized sgRNA effect (n = 2 replicates). B) sgRNA effects in growth tiling screens using other modalities (CRISPRa, dCas9, or Cas9). Promoter refers to sgRNAs that are between the TSS and 2000 bp upstream of the TSS. Outside defined as outside the gene body, promoter, and K562 DHS peaks. P values show T-test for the comparison across strands. Boxes show the quartiles, with a line at the median, lines extend to 1.5 times the interquartile range, and dots show outliers (left to right: n = 2027, 1731, 35, 28, 101, 77 sgRNAs). C) CRISPRa and Cas9 tracks show the average of two biological replicates, comparing Day 21 to plasmid. D) Gene length compared with strand bias, defined as the difference between the median effect of coding strand-targeting and median of template strand-targeting sgRNAs. sgRNAs between the TES and 2000 bp downstream of the TSS are included, and genes less than 2000 bp are excluded (n = 17 loci with 2 replicates each). E) Strand bias similarly compared with expression level from RNA-seq in K562 cells (n = 20 loci). F) Points show the average effect of all sgRNAs targeting the promoter (n = 19 promoters with 2 replicates). G) sgRNA effects in a CRISPRi FlowFISH tiling screen for FADS2 regulatory elements. The two intronic CREs are defined as 500 bp windows centered on CASA peak calls and are annotated in Fig. 6b (left to right: n = 2105, 1935, 107, 126, 32, 26, 27, 19, 1940, and 1786 sgRNAs). H) Strand bias at a CRE within the gene body in a CRISPRi tiling HCR-FlowFISH screen of the NMU locus. I) Points show average effects of all sgRNAs targeting a CRE, defined as a 500 bp region centered on a K562 DHS that overlaps a CASA peak and is outside of the promoter (n = 2 replicates). CREs with ≥5 sgRNAs are included. Strand is defined with respect to the target gene (which may not correspond with transcriptional status of intergenic regions).

References

    1. Maurano MT, et al. Systematic localization of common disease-associated variation in regulatory DNA. Science. 2012;337:1190–1195. doi: 10.1126/science.1222794. - DOI - PMC - PubMed
    1. Buniello A, et al. The NHGRI-EBI GWAS Catalog of published genome-wide association studies, targeted arrays and summary statistics 2019. Nucleic Acids Res. 2019;47:D1005–D1012. doi: 10.1093/nar/gky1120. - DOI - PMC - PubMed
    1. Claussnitzer M, et al. A brief history of human disease genetics. Nature. 2020;577:179–189. doi: 10.1038/s41586-019-1879-7. - DOI - PMC - PubMed
    1. Edwards SL, Beesley J, French JD, Dunning AM. Beyond GWASs: illuminating the dark road from association to function. Am. J. Hum. Genet. 2013;93:779–797. doi: 10.1016/j.ajhg.2013.10.012. - DOI - PMC - PubMed
    1. The ENCODE Project Consortium. An integrated encyclopedia of DNA elements in the human genome. Nature489, 57–74 (2012). - PMC - PubMed

MeSH terms

Substances