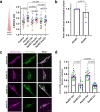
. 2024 Mar;6(3):514-530.
doi: 10.1038/s42255-024-01007-w. Epub 2024 Mar 19.

Insulin signalling regulates Pink1 mRNA localization via modulation of AMPK activity to support PINK1 function in neurons

Affiliations

Insulin signalling regulates Pink1 mRNA localization via modulation of AMPK activity to support PINK1 function in neurons

J Tabitha Hees et al. Nat Metab. 2024 Mar.

Abstract

Mitochondrial quality control failure is frequently observed in neurodegenerative diseases. The detection of damaged mitochondria by stabilization of PTEN-induced kinase 1 (PINK1) requires transport of Pink1 messenger RNA (mRNA) by tethering it to the mitochondrial surface. Here, we report that inhibition of AMP-activated protein kinase (AMPK) by activation of the insulin signalling cascade prevents Pink1 mRNA binding to mitochondria. Mechanistically, AMPK phosphorylates the RNA anchor complex subunit SYNJ2BP within its PDZ domain, a phosphorylation site that is necessary for its interaction with the RNA-binding protein SYNJ2. Notably, loss of mitochondrial Pink1 mRNA association upon insulin addition is required for PINK1 protein activation and its function as a ubiquitin kinase in the mitophagy pathway, thus placing PINK1 function under metabolic control. Induction of insulin resistance in vitro by the key genetic Alzheimer risk factor apolipoprotein E4 retains Pink1 mRNA at the mitochondria and prevents proper PINK1 activity, especially in neurites. Our results thus identify a metabolic switch controlling Pink1 mRNA localization and PINK1 activity via insulin and AMPK signalling in neurons and propose a mechanistic connection between insulin resistance and mitochondrial dysfunction.


Conflict of interest statement

The authors declare no competing interests.

Figures
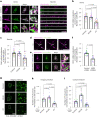
Fig. 1
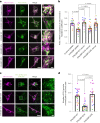
Fig. 1. AMPK signalling regulates Pink1 mRNA localization to mitochondria.
a, Representative images of Pink1 mRNA visualized by the MS2/PP7-split-Venus method and mitoRaspberry upon AMPK activation and inhibition using AICAR (1 mM, 2 h) and CC (20 µM, 2 h), respectively, in the soma and neurites. b, Quantification of the Manders’ colocalization coefficient for the overlap between the Pink1 mRNA and mitochondrial channel in the soma as in a. One-way ANOVA followed by Tukey’s post hoc test; n = 21–38. c, Quantification as in b for neurites. One-way ANOVA followed by Tukey’s post hoc test; n = 20–36. d, Representative images of Pink1 mRNA visualized by the MS2/PP7-split-Venus method and mitoRaspberry 20 min, 23 min and 26 min after 20 µM CC treatment. e, Representative images of Pink1 mRNA and mitoRaspberry upon control or AMPK shRNA expression in the soma. f, Quantification of the Manders’ colocalization coefficient for the overlap between the Pink1 mRNA and mitochondrial channel as in e. Two-tailed Student’s t-test; n = 13–23. g, Representative images of neuronal somata displaying the PLA signal between SYNJ2BP and SYNJ2 upon control, AICAR (1 mM, 2 h) and CC (20 µM, 2 h) treatment in imaging medium (Hibernate E). h, Number of PLA puncta per soma of neurons normalized to the soma size treated with the indicated drugs as in g in imaging medium (Hibernate E). One-way ANOVA followed by Tukey’s post hoc test; n = 15. i Quantification as in h of neurons grown in full culture medium and treated with the indicated drugs. One-way ANOVA followed by Tukey’s post hoc test; n = 21. All data are expressed as mean ± s.e.m. All data points represent single cells coming from at least three biological replicates. Scale bars, 10 µm; scale bars in insets, 2 µm. Source data
Fig. 2
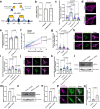
Fig. 2. Insulin signalling regulates Pink1 mRNA localization to mitochondria.
a, Representative images of Pink1 mRNA visualized by the MS2/PP7-split-Venus method and mitoRaspberry upon insulin (500 nM, 1 h) addition with or without pre-treatment with the IR inhibitor GSK1904529A (1 µM, 2 h) in the soma and neurites. b, Quantification of the Manders’ colocalization coefficient for the overlap between the Pink1 mRNA and mitochondrial channel in the soma. One-way ANOVA followed by Tukey’s post hoc test; n = 22–29. c, Quantification as in b for neurites. One-way ANOVA followed by Tukey’s post hoc test; n = 23–28. d, Representative images of neuronal somata analysed by PLA between SYNJ2BP and SYNJ2 in full medium upon insulin starvation and upon additional insulin (500 nM, 1 h) treatment with or without pre-treatment with the IR inhibitor GSK1904529A (1 µM, 2 h). e, Number of PLA puncta per soma of neurons normalized to the soma size treated with the indicated drugs as in d in full medium or upon insulin withdrawal. One-way ANOVA followed by Tukey’s post hoc test; n = 16–45. All data are expressed as mean ± s.e.m. All data points represent single cells coming from at least three biological replicates. Scale bars, 10 µm; scale bars in insets; 2 µm. Source data
Fig. 3
Fig. 3. AMPK phosphorylates SYNJ2BP in its PDZ domain.
a, Schematic showing the SYNJ2BP sequence around its proposed phosphorylation site S21 and the AMPK consensus motif. b, In vitro kinase assay analysed on a Zn2+-Phos-tag SDS–PAGE using recombinant AMPK as well as recombinant SYNJ2BP WT and S21A, respectively and decorated with a SYNJ2BP antibody. Note the appearance of a slower-migrating species only in the presence of AMPK and SYNJ2BP WT. The asterisk (*) denotes an unspecific band present in all samples. This is a representative blot of n > 3 experiments. c, In vitro phosphorylation assay as in b, using recombinant SYNJ2BP WT and S21A, respectively, treated with lysates from cortical neurons grown in vitro in the presence of AICAR or in the absence of the B27 supplement. Note the appearance of a slower-migrating species only in the presence of AICAR-treated or B27-free lysates and SYNJ2BP WT. The asterisk (*) denotes an unspecific band present in all samples. This is a representative blot of n > 3 experiments. d, Primary cortical neurons overexpressing myc-tagged SYNJ2BP WT by lentiviral transduction were cultured in insulin-free medium and treated with or without the AMPK inhibitor CC (20 µM, 2 h). The log2-transformed SYNJ2BP S21 intensity is shown upon phospho-peptide enrichment and LC–MS/MS analysis. Two-tailed Student’s t-test; n = 3. All data are expressed as mean ± s.e.m. All data points represent biological replicates. Source data
Fig. 4
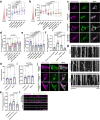
Fig. 4. SYNJ2BP phosphorylation regulates Pink1 mRNA localization to mitochondria.
a, Representative images of Pink1 mRNA visualized by the MS2/PP7-split-Venus method and mitoRaspberry upon control or SYNJ2BP shRNA expression combined with overexpression of shRNA-resistant SYNJ2BP WT, S21A or S21E in the soma. b, Quantification of the Manders’ colocalization coefficient for the overlap between the Pink1 mRNA and mitochondrial channel as in a. One-way ANOVA followed by Tukey’s post hoc test; n = 23–46. c, Representative images of neuronal somata overexpressing mitoRaspberry as well as SYNJ2BP WT, S21A and S21E, respectively, displaying the PLA signal between SYNJ2BP and SYNJ2. d, Number of PLA puncta per soma of neurons normalized to the soma size as in c. One-way ANOVA followed by Tukey’s post hoc test; n = 18–28. All data are expressed as mean ± s.e.m. All data points represent single cells coming from at least three biological replicates. Scale bar, 10 µm; scale bars in insets, 2 µm. Source data
Fig. 5
Fig. 5. Phospho-mimetic SYNJ2BP restores mitochondrial Pink1 mRNA localization upon AMPK inhibition.
a, Representative images of Pink1 mRNA visualized by the MS2/PP7-split-Venus method and mitoRaspberry upon CC (20 µM, 2 h) treatment combined with overexpression of SYNJ2BP WT and S21E, respectively. b, Quantification of the Manders’ colocalization coefficient for the overlap between the Pink1 mRNA and mitochondrial channel in the soma of neurons overexpressing SYNJ2BP WT or S21E and treated with or without CC (20 µM, 2 h). One-way ANOVA followed by Tukey’s post hoc test; n = 16–19. c, Representative images of Pink1 mRNA and mitoRaspberry upon insulin (500 nM, 1 h) treatment combined with overexpression of SYNJ2BP WT and S21E, respectively. d, Quantification of the Manders’ colocalization coefficient for the overlap between the Pink1 mRNA and mitochondrial channel in the soma of neurons overexpressing SYNJ2BP WT or S21E and treated with or without insulin (500 nM, 1 h). One-way ANOVA followed by Tukey’s post hoc test; n = 13–16. All data are expressed as mean ± s.e.m. All data points represent single cells coming from at least three biological replicates. Scale bars, 10 µm. Source data
Fig. 6
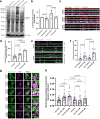
Fig. 6. Insulin supports PINK1 activation and mitophagy.
a, Representative images of neurites overexpressing YFP-Parkin and mitoRaspberry cultured and treated as indicated. The white arrowheads indicate Parkin recruitment to mitochondria. b, Quantification of mitochondrial Parkin recruitment as in a. One-way ANOVA followed by Tukey’s post hoc test; n = 8–9. c, Representative images of neurites overexpressing mito-meGFP cultured and treated as indicated and stained for p-ubiquitin (S65) and βIII tubulin. d, Quantification of p-ubiquitin (S65) localization to mitochondria using the Manders’ colocalization coefficient as in c. One-way ANOVA followed by Tukey’s post hoc test; n = 19–24. e, Representative images of neurites overexpressing mito-meGFP cultured and treated as indicated and stained for optineurin and βIII tubulin. f, Quantification of optineurin recruitment to mitochondria using the Manders’ colocalization coefficient as in e. One-way ANOVA followed by Tukey’s post hoc test; n = 14–18. g, Representative immunoblot image of human iPS cell-derived cortical neurons cultured and treated as indicated for 2 h. h, Quantification of the full-length PINK1 protein bands normalized to the βIII tubulin signal as in g. One-way ANOVA followed by Tukey’s post hoc test; n = 3. i, Representative images of neurites overexpressing mito-meGFP as well as SYNJ2BP WT or S21A cultured and treated as indicated and stained for p-ubiquitin (S65) and βIII tubulin. j, Quantification of p-ubiquitin (S65) localization to mitochondria using the Manders’ colocalization coefficient. One-way ANOVA followed by Tukey’s post hoc test; n = 14–17. k, Representative images of neurites overexpressing mito-meGFP as well as SYNJ2BP WT or S21E cultured and treated as indicated and stained for p-ubiquitin (S65) and βIII tubulin. l, Quantification of p-ubiquitin (S65) localization to mitochondria using the Manders’ colocalization coefficient. One-way ANOVA followed by Tukey’s post hoc test; n = 17–20. All data are expressed as mean ± s.e.m. Data points represent biological replicates (h) or single cells coming from at least three biological replicates (b,d,f,j,I). Scale bars, 10 µm. Source data
Fig. 7
Fig. 7. ApoE4 inhibits insulin-regulated Pink1 mRNA localization and PINK1 activation.
a, Representative images of Pink1 mRNA visualized by the MS2/PP7-split-Venus method and mitoRaspberry with and without insulin treatment in the presence of ApoE3 or ApoE4. b, Quantification of Pink1 mRNA mitochondrial localization using Manders’ colocalization coefficient in the soma. One-way ANOVA followed by Tukey’s post hoc test; n = 21–30. c, Quantification as in b for neurites. One-way ANOVA followed by Tukey’s post hoc test; n = 22–37. d, Representative images of Pink1 mRNA visualized by the MS2/PP7-split-Venus method and mitoRaspberry upon overnight treatment with insulin as well as ApoE3 and ApoE4, combined with overexpression of SYNJ2BP WT and S21A as indicated. e, Quantification of Pink1 mRNA mitochondrial localization using Manders’ colocalization coefficient as in d. One-way ANOVA followed by Tukey’s post hoc test, n = 18–24. f, Representative images of neurites overexpressing mito-meGFP cultured in the presence of insulin as well as ApoE3 and ApoE4 overnight, treated as indicated and stained for p-ubiquitin (S65) and βIII tubulin. g, Quantification of p-ubiquitin (S65) localization to mitochondria using the Manders’ colocalization coefficient as in f. One-way ANOVA followed by Tukey’s post hoc test; n = 16–24. h, Model of insulin- and AMPK-mediated regulation of mitochondrial Pink1 mRNA localization. (i) When insulin levels are low and AMPK is active, Pink1 mRNA is localized to mitochondria via SYNJ2BP and SYNJ2a. As a result, PINK1 protein levels are reduced and less mitophagy is observed. ApoE4 mimics this state by inhibiting the insulin-mediated effects. (ii) When insulin levels are high and AMPK is less active, the interaction between SYNJ2BP and SYNJ2a is reduced and less Pink1 mRNA is tethered to mitochondria. As a result, PINK1 protein levels are increased and mitophagy is facilitated. All data are expressed as mean ± s.e.m. All data points represent single cells coming from at least three biological replicates. Scale bars, 10 µm; scale bar in insets, 2 µm. Source data
Extended Data Fig. 1
Extended Data Fig. 1. AMPK signalling regulates Pink1 mRNA localization to mitochondria.
a Schematic of the MS2/PP7-split-Venus method for mRNA imaging. b RT-qPCR of Pink1 transcript levels normalized to β-actin from primary cortical neurons treated with or without CC (20 µM, 2 h). Two-tailed Welch’s t-test; n = 3. c Live-cell imaging of Pink1 mRNA localization in hippocampal neurons using the MS2/PP7-split-Venus method. Quantification of the Manders’ colocalization coefficient for the overlap between the Pink1 mRNA and the mitochondrial channel upon control or CC (20 µM, 2 h) treatment. The analysis has been performed on a 10 by 10 µm square in the soma. ‘Venus rotated’ indicates that the Pink1 mRNA channel had been rotated 90° before quantification. One-way ANOVA followed by Tukey’s post hoc test; n = 19-20. d Representative images of neurons overexpressing mito-meGFP upon control or CC (20 µM, 2 h) treatment. e Quantification of the average mitochondrial branch length per soma as in d. Two-tailed student’s t-test; n = 18. f Number of Pink1 mRNA dots plotted against the mitochondrial length in µm upon control, AICAR (1 mM, 2 h) or CC (20 µM, 2 h) treatment. Simple linear regression; one-way ANOVA followed by Tukey’s post hoc test to compare the slopes of all three groups; n = 140-218. g Number of Pink1 mRNA dots per µm mitochondrion upon control, AICAR (1 mM, 2 h) or CC (20 µM, 2 h) treatment. One-way ANOVA followed by Tukey’s post hoc test; n = 167-310. h Representative images of Atp5f1b mRNA visualized by the MS2/PP7-split-Venus method and mitoRaspberry upon control or CC (20 µM, 2 h) treatment. i Quantification of the Manders’ colocalization coefficient for the overlap between the Atp5f1b mRNA and the mitochondrial channel as in h. The analysis has been performed on a 10 by 10 µm square in the soma. ‘Venus rotated’ indicates that the Atp5f1b mRNA channel had been rotated 90° before quantification. One-way ANOVA followed by Tukey’s post hoc test; n = 13-18. j Representative images of Cox4i mRNA visualized by the MS2/PP7-split-Venus method and mitoRaspberry upon control or CC (20 µM, 2 h) treatment. k Quantification of the Manders’ colocalization coefficient for the overlap between the Cox4i mRNA and the mitochondrial channel as in j. The analysis has been performed on a 10 by 10 µm square in the soma. ‘Venus rotated’ indicates that the Cox4i mRNA channel had been rotated 90° before quantification. One-way ANOVA followed by Tukey’s post hoc test; n = 23. l Representative immunoblot images of cortical neurons lentivirally overexpressing control shRNA or AMPKα1 shRNA. m Quantification of the AMPKα1 protein bands normalized to the respective βIII tubulin bands as in l. Two-tailed Welch’s t-test; n = 3. n Representative immunoblot images of cortical neurons lentivirally overexpressing control shRNA or AMPKα2 shRNA. o Quantification of the AMPKα2 protein bands normalized to the respective βIII tubulin bands as in m. Two-tailed Welch’s t-test; n = 3. p Representative images of Pink1 mRNA visualized by the MS2/PP7-split-Venus method and iRFP-Rab7 upon control or CC (20 µM, 2 h) treatment. q Quantification of the Manders’ colocalization coefficient for the overlap between the Pink1 mRNA and iRFP-Rab7 channel as in p. Two-tailed student’s t-test; n = 16-19. All data are expressed as mean ± SEM. Data points represent biological replicates (b, m, o), single cells (c, e, i, k, q) or single mitochondria (f, g) coming from ≥3 biological replicates. Scale bars, 10 µm. Source data
Extended Data Fig. 2
Extended Data Fig. 2. AMPK signalling regulates interaction between SYNJ2BP and SYNJ2 without affecting their expression levels.
a Representative images of MAP2-positive dendrites displaying the PLA and mitotracker signal upon control, AICAR (1 mM, 2 h) or CC (20 µM, 2 h) treatment in imaging medium (Hibernate E). b Representative images of neuronal somata displaying the PLA signal upon control, AICAR (1 mM, 2 h) or CC (20 µM, 2 h) treatment in full culture medium. c Representative immunoblot images of cortical neurons upon control, AICAR (1 mM, 2 h) or CC (20 µM, 2 h) treatment. d Quantification of the SYNJ2BP protein bands normalized to the respective βIII tubulin bands as in c. One-way ANOVA followed by Tukey’s post hoc test; n = 4. e Representative immunoblot images of cortical neurons upon control, AICAR (1 mM, 2 h) or CC (20 µM, 2 h) treatment. f Quantification of the SYNJ2 protein bands normalized to the respective βIII tubulin bands as in e. One-way ANOVA followed by Tukey’s post hoc test; n = 4. g Representative images of neurons overexpressing mito-meGFP upon control, AICAR (1 mM, 2 h) or CC (20 µM, 2 h) treatment and stained with an antibody against SYNJ2BP. h Quantification of SYNJ2BP localization to mitochondria using the Manders’ colocalization coefficient as in g. One-way ANOVA followed by Tukey’s post hoc test; n = 14-16. All data are expressed as mean ± SEM. All data points represent biological replicates (d,f) or single cells coming from ≥3 biological replicates (h). Scale bars, 10 µm. Source data
Extended Data Fig. 3
Extended Data Fig. 3. Insulin signalling inhibits AMPK and regulates Pink1 mRNA localization to mitochondria.
a Quantification of fluorescent lifetime imaging of the FRET-based AMPK activity sensor in neurons treated with increasing insulin concentrations for 1 h. One-way ANOVA followed by Dunnett’s post hoc test; n = 18-21. b Quantification of fluorescent lifetime imaging of the FRET-based AMPK activity sensor in neurons treated with insulin in presence or absence of inhibitors of the insulin signalling pathway: IR inhibitor GSK1904529A (1 µM, 2 h), PI3K inhibitor Wortmannin (1 µM, 2 h) and AKT inhibitor VIII (10 µM, 2 h). One-way ANOVA followed by Tukey’s post hoc test; n = 10-34. c Representative images of Pink1 mRNA visualized by the MS2/PP7-split Venus method and mitoRaspberry upon insulin (500 nM, 1 h) addition with or without pre-treatment with the PI3K inhibitor Wortmannin (1 µM, 2 h) or the AKT inhibitor VIII (10 µM, 2 h) in the soma. d Quantification of the Manders’ colocalization coefficient for the overlap between the Pink1 mRNA and mitochondrial channel in the soma. One-way ANOVA followed by Tukey’s post hoc test; n = 16-32. e Quantification of the Manders’ colocalization coefficient for the overlap between the Pink1 mRNA and mitochondrial channel in neurons treated with increasing insulin concentrations for 1 h. One-way ANOVA followed by Dunnett’s post hoc test; n = 13-21. f Live-cell imaging of Pink1 mRNA localization in hippocampal neurons using the MS2/PP7-split Venus method. Quantification of the Manders’ colocalization coefficient for the overlap between the Pink1 mRNA and the mitochondrial channel upon insulin (500 nM, 1 h) treatment. The analysis has been performed on a 10 by 10 µm square in the soma. ‘Venus rotated’ indicates that the Pink1 mRNA channel had been rotated 90° before quantification. One-way ANOVA followed by Tukey’s post hoc test; n = 30-35. g Representative kymographs of mitochondria in neurites of neurons overexpressing mito-meGFP upon control, CC (20 µM, 2 h) or insulin (500 nM, 1 h) treatment. h Quantification of the percentage of moving mitochondria in neurites as in g. One-way ANOVA followed by Tukey’s post hoc test; n = 18. i Quantification of the average mitochondrial speed in neurites as in g. One-way ANOVA followed by Tukey’s post hoc test; n = 18. j Representative images of Pink1 mRNA visualized by the MS2/PP7-split Venus method and mitoRaspberry in neurons overexpressing SNAPmito, SYNJ2mito WT or SYNJ2mito VQL/AAA upon insulin (500 nM, 1 h) treatment. k Quantification of the Manders’ colocalization coefficient for the overlap between the Pink1 mRNA and mitochondrial channel as in j. One-way ANOVA followed by Tukey’s post hoc test; n = 17-19. l Representative images of neurites displaying the PLA and mitotracker signal upon starvation (minus insulin, 2 h) and insulin (500 nM, 1 h) treatment. All data are expressed as mean ± SEM. All data points represent single cells coming from ≥3 biological replicates. Scale bars, 10 µm. Source data
Extended Data Fig. 4
Extended Data Fig. 4. Insulin signalling does not affect the expression levels of SYNJ2BP and SYNJ2.
a Representative immunoblot images of cortical neurons upon control (full medium), insulin starvation (2 h) or insulin addition (500 nM, 1 h). b Quantification of the SYNJ2BP protein bands normalized to the respective βIII tubulin bands as in a. One-way ANOVA followed by Tukey’s post hoc test; n = 3. c Representative immunoblot images of cortical neurons upon control (full medium), insulin starvation (2 h) or insulin addition (500 nM, 1 h). d Quantification of the SYNJ2 protein bands normalized to the respective βIII tubulin bands as in c. One-way ANOVA followed by Tukey’s post hoc test; n = 3. e Representative images of neurons overexpressing mito-meGFP neurons upon control (full medium), insulin starvation (2 h) or insulin addition (500 nM, 1 h) and stained with an antibody against SYNJ2BP. f Quantification of SYNJ2BP localization to mitochondria using the Manders’ colocalization coefficient as in e. One-way ANOVA followed by Tukey’s post hoc test; n = 15. All data are expressed as mean ± SEM. Data points represent biological replicates (b,d) or single cells coming from ≥3 biological replicates (f). Scale bar, 10 µm. Source data
Extended Data Fig. 5
Extended Data Fig. 5. AMPK phosphorylates SYNJ2BP in its PDZ domain.
a Dephosphorylation of recombinant SYNJ2BP WT and S21A, respectively, using CIP analysed on a Zn2+-Phos-Tag SDS–PAGE and decorated with a SYNJ2BP antibody. Note the appearance of slower migrating species that disappear upon addition of CIP indicating phosphorylated forms of SYNJ2BP. The asterisk (*) denotes an unspecific band that is not responsive to CIP treatment. This is a representative blot of n ≥ 3 experiments. b-c The number of quantified proteins upon LC–MS/MS analysis is plotted against the log10-transformed intensity-based absolute quantification (iBAQ) values. The iBAQ values represent an estimate of the molar abundance of proteins within the sample. Note, the protein rank of endogenous SYNJ2BP in cortical neurons (b) is relatively low, which can be improved by lentiviral overexpression of myc-tagged SYNJ2BP WT (c). d Annotated MS/MS spectrum of the peptide GPSGLGFNIVGGTDQQYVSNDSGIYVSR of lentivirally overexpressed myc-tagged SYNJ2BP in cortical neurons. Note, ion B3 represents the ion containing the phosphorylation at S21 of SYNJ2BP. e Log2-transformed LFQ intensities of SYNJ2BP upon LC–MS/MS analysis in primary cortical neurons that lentivirally overexpressed myc-tagged SYNJ2BP WT and were cultured in insulin-free medium and treated with or without the AMPK inhibitor CC (20 µM, 2 h). Two-tailed student’s t-test; n = 3. f Primary cortical neurons overexpressing myc-tagged SYNJ2BP WT by lentiviral transduction were cultured in insulin-free medium and treated with or without insulin (500 nM, 1 h). The log2-transformed SYNJ2BP S21 intensity is shown upon phospho-peptide enrichment and LC–MS/MS analysis. Two-tailed student’s t-test; n = 4. g Log2-transformed LFQ intensities of SYNJ2BP upon LC–MS/MS analysis in primary cortical neurons that lentivirally overexpress myc-tagged SYNJ2BP WT and were cultured in insulin-free medium and treated with or without insulin (500 nM, 1 h). Two-tailed student’s t-test; n = 4. All data are expressed as mean ± SEM, except b and c. All data points in e, f, and g represent biological replicates. Source data
Extended Data Fig. 6
Extended Data Fig. 6. Expression levels of myc-tagged SYNJ2BP WT, S21A, and S21E constructs and Co-IP between SYNJ2BP and SYNJ2.
a Representative immunoblot image of cortical neurons that lentivirally overexpress myc-tagged SYNJ2BP WT, S21A and S21E, respectively. b Quantification of the SYNJ2BP protein bands normalized to the respective βIII tubulin bands as in a. One-way ANOVA followed by Tukey’s post hoc test; n = 5. c Representative immunoblot image of SYNJ2BP immunoprecipitation using lysates of cortical neurons lentivirally overexpressing myc-tagged SYNJ2BP WT or S21A. Note, less SYNJ2 co-precipitated with SYNJ2BP S21A. d Quantification of the SYNJ2 protein bands normalized to the respective SYNJ2BP band as in c. Two-tailed Welch’s t-test; n = 3. e Representative immunoblot image of SYNJ2BP immunoprecipitation using lysates of cortical neurons lentivirally overexpressing myc-tagged SYNJ2BP WT treated with or without calf intestinal phosphatase (CIP). Note, less SYNJ2 co-precipitated with SYNJ2BP from lysates treated with CIP. f Quantification of the SYNJ2 protein bands normalized to the respective SYNJ2BP bands as well as the input band as in e. Two-tailed Welch’s t-test; n = 5. All data are expressed as mean ± SEM. All data points represent biological replicates. Source data
Extended Data Fig. 7
Extended Data Fig. 7. Phospho-mimetic SYNJ2BP restores mitochondrial Pink1 mRNA localization upon AMPK inhibition in neurites.
a Representative images of Pink1 mRNA visualized by the MS2/PP7-split Venus method and mitoRaspberry in neurites upon CC (20 µM, 2 h) treatment combined with overexpression of SYNJ2BP WT or S21E. b Quantification of the Manders’ colocalization coefficient for the overlap between the Pink1 mRNA and mitochondrial channel in neurites overexpressing SYNJ2BP WT or S21E and treated with or without CC (20 µM, 2 h). One-way ANOVA followed by Tukey’s post hoc test; n = 8-15. c Representative images of Pink1 mRNA and mitoRaspberry in neurites upon insulin (500 nM, 1 h) treatment combined with overexpression of SYNJ2BP WT or S21E. d Quantification of the Manders’ colocalization coefficient for the overlap between the Pink1 mRNA and mitochondrial channel in neurites overexpressing SYNJ2BP WT or S21E and treated with or without insulin (500 nM, 1 h). One-way ANOVA followed by Tukey’s post hoc test; n = 13-15. All data are expressed as mean ± SEM. All data points represent single cells coming from ≥3 biological replicates. Scale bars, 10 µm. Source data
Extended Data Fig. 8
Extended Data Fig. 8. Mild damage induces PINK1/Parkin-dependent mitophagy.
a Representative immunoblot image of human iPSC-derived neurons cultured with or without insulin overnight and treated with or without CCCP (20 µM, 2 h). b Quantification of p-ubiquitin levels normalized to the βIII tubulin signal as in a. One-way ANOVA followed by Tukey’s post hoc test; n = 4. c Representative images of neurites overexpressing mito-meGFP cultured in the presence of insulin overnight prior to treatment with 5 nM or 20 µM AA (45 min) and stained with antibodies against p-ubiquitin (S65) and βIII tubulin. d Quantification of p-ubiquitin (S65) localization to mitochondria using the Manders’ colocalization coefficient as in c. One-way ANOVA followed by Tukey’s post hoc test; n = 12-42. e Representative images of neurites overexpressing YFP-Parkin and mitoRaspberry cultured in the presence of insulin overnight prior to treatment with 5 nM or 20 µM AA. The white arrowheads indicate Parkin recruitment to mitochondria monitored with live-cell imaging before (start) and after 30 min of AA addition. f Quantification of mitochondria colocalizing with Parkin before and after AA treatment in presence of insulin as in e. One-way ANOVA followed by Tukey’s post hoc test; n = 16. g Representative image of neurons overexpressing mito-meGFP and LAMP1-mCherry cultured in the presence or absence of insulin overnight prior to treatment with or without 5 nM or 20 µM AA (45 min). h Quantification of mitochondrial localization to lysosomes using the Manders’ colocalization coefficient as in g. One-way ANOVA followed by Tukey’s post hoc test; n = 30-38. All data are expressed as mean ± SEM. Data points represent biological replicates (b) or single cells coming from ≥3 biological replicates (d,f,h). Scale bars, 10 µm for whole soma and neurites, 2 µm for insets. Source data
Extended Data Fig. 9
Extended Data Fig. 9. Insulin-regulated PINK1 expression is neuron-specific and mTORC1-independent.
a Representative immunoblot image of human iPSC-derived neurons upon control, AICAR (1 mM, 2 h) or CC (20 µM, 2 h) treatment. b Quantification of the full-length PINK1 protein bands normalized to the βIII tubulin signal as in a. One-way ANOVA followed by Tukey’s post hoc test; n = 5. c Representative images of neurons overexpressing PINK1-GFP and mito-BFP cultured in the presence or absence of insulin for 2 h. d Quantification of the mitochondrial PINK1-GFP intensity normalized to the mito-BFP intensity as in c. Two-tailed student’s t-test; n = 13-18. e Quantification of the Manders’ colocalization coefficient for the overlap between the PINK1-GFP and the mitochondrial channel as in d. Two-tailed student’s t-test; n = 15-17. f Representative immunoblot image of HEK293 cells upon vehicle control, IR inhibitor GSK1904529A (1 µM, 2 h) or AKT inhibitor VIII (10 µM, 2 h) treatment. g Quantification of the full-length PINK1 protein bands normalized to the β-actin signal as in f. One-way ANOVA followed by Tukey’s post hoc test; n = 3. h Representative images of neurites overexpressing mito-meGFP cultured in the presence of insulin as well as Torin-2 (10 nM, 30 min) or AICAR (1 mM, 2 h) prior to treatment with 20 µM AA and stained with antibodies against p-ubiquitin (S65) and βIII tubulin. i Quantification of p-ubiquitin (S65) localization to mitochondria using the Manders’ colocalization coefficient. One-way ANOVA followed by Tukey’s post hoc test; n = 12-19. All data are expressed as mean ± SEM. Data points represent biological replicates (b, g) or single cells coming from ≥3 biological replicates (d, e, i). Scale bars, 10 µm. Source data
Extended Data Fig. 10
Extended Data Fig. 10. ApoE4 inhibits insulin- but not CC-mediated effects.
a Quantification of fluorescent lifetime imaging of the FRET-based AMPK activity sensor in neurons treated with and without insulin (500 nM, 1 h) in the presence of ApoE3 (50 nM) or ApoE4 (50 nM) overnight. One-way ANOVA followed by Tukey’s post hoc test; n = 31-47. b RT-qPCR of Pink1 transcript levels normalized to β-actin from primary cortical neurons treated with ApoE3 or ApoE4 (50 nM, overnight). Two-tailed Welch’s t-test; n = 3. c Representative images of Pink1 mRNA visualized by the MS2/PP7-split Venus method and mitoRaspberry with or without CC (20 µM, 2 h) treatment in the presence of ApoE3 (50 nM) or ApoE4 (50 nM) overnight, respectively. d Quantification of the Manders’ colocalization coefficient for the overlap between the Pink1 mRNA and mitochondrial channel as in c. One-way ANOVA followed by Tukey’s post hoc test; n = 11-14. All data are expressed as mean ± SEM. All data points represent biological replicates (b) or single cells coming from ≥3 biological replicates (a,d). Scale bars, 10 µm. Source data

References

    1. Misgeld T, Schwarz TL. Mitostasis in neurons: maintaining mitochondria in an extended cellular architecture. Neuron. 2017;96:651–666. - PMC - PubMed
    1. Vargas JNS, Sleigh JN, Schiavo G. Coupling axonal mRNA transport and local translation to organelle maintenance and function. Curr. Opin. Cell Biol. 2022;74:97–103. - PMC - PubMed
    1. Harbauer AB, et al. Neuronal mitochondria transport Pink1 mRNA via synaptojanin 2 to support local mitophagy. Neuron. 2022;110:P1516–1531.e9. - PMC - PubMed
    1. Valente EM, et al. Hereditary early-onset Parkinson’s disease caused by mutations in PINK1. Science. 2004;304:1158–1160. - PubMed
    1. Lin W, Kang UJ. Characterization of PINK1 processing, stability, and subcellular localization. J. Neurochem. 2008;106:464–474. - PMC - PubMed