

Microbiota-derived indoles alleviate intestinal inflammation and modulate microbiome by microbial cross-feeding
- PMID: 38504383
- PMCID: PMC10949743
- DOI: 10.1186/s40168-024-01750-y
Microbiota-derived indoles alleviate intestinal inflammation and modulate microbiome by microbial cross-feeding
Abstract
Background: The host-microbiota interaction plays a crucial role in maintaining homeostasis and disease susceptibility, and microbial tryptophan metabolites are potent modulators of host physiology. However, whether and how these metabolites mediate host-microbiota interactions, particularly in terms of inter-microbial communication, remains unclear.
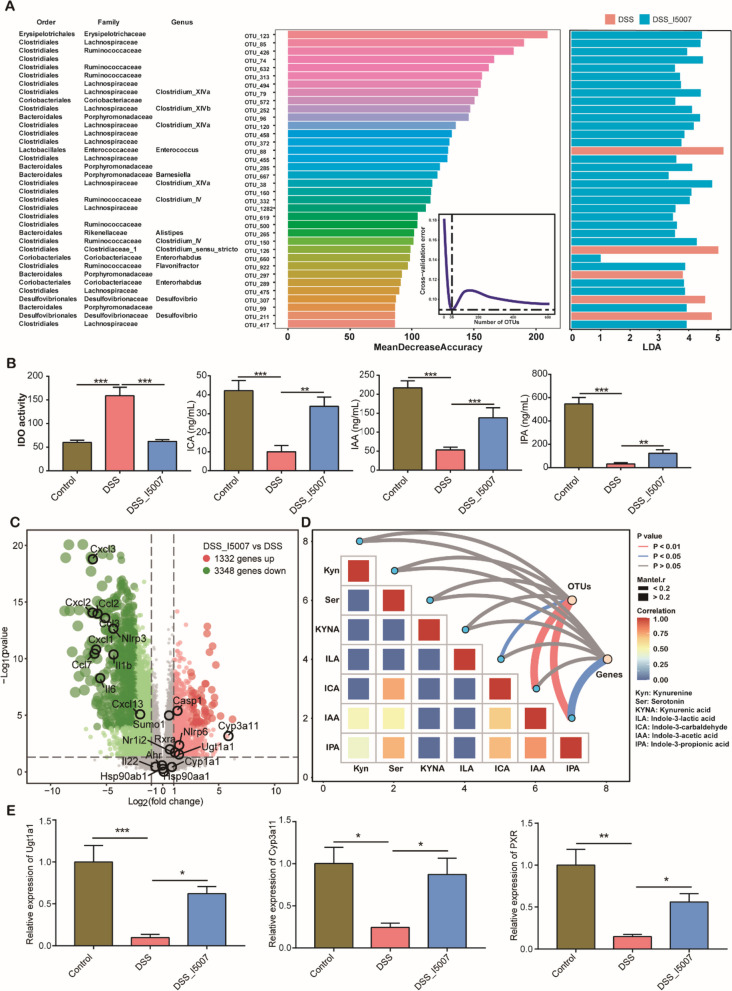
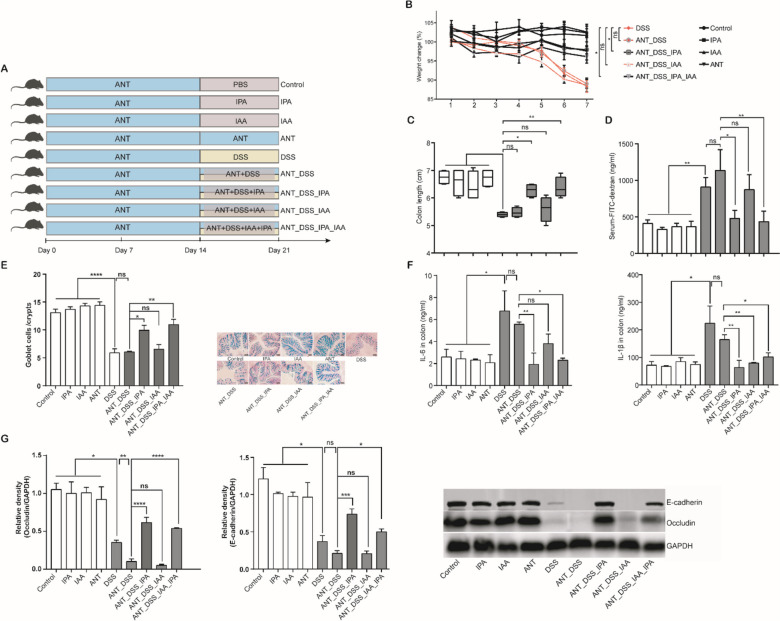
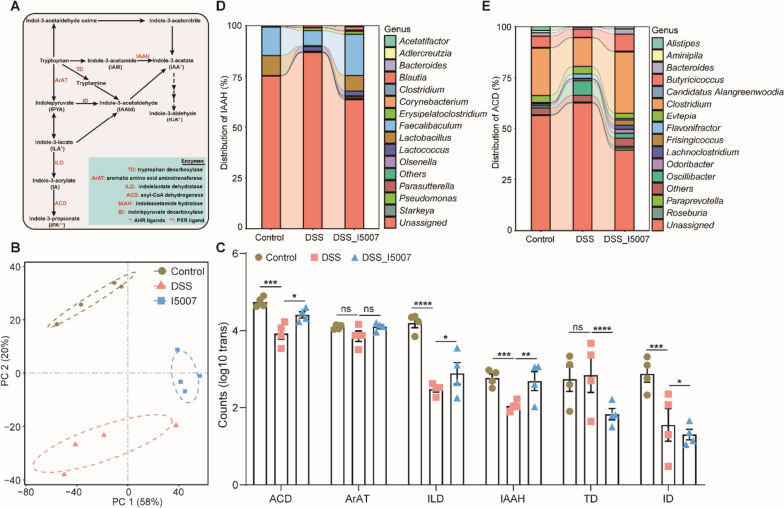
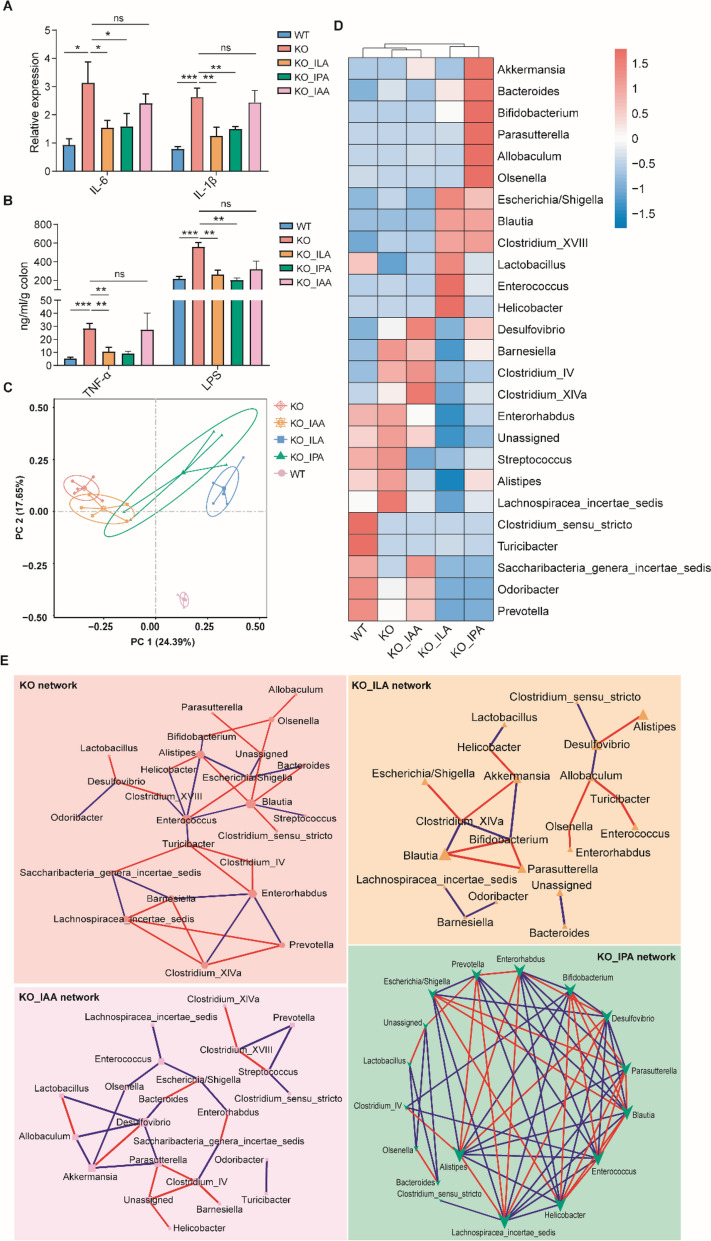
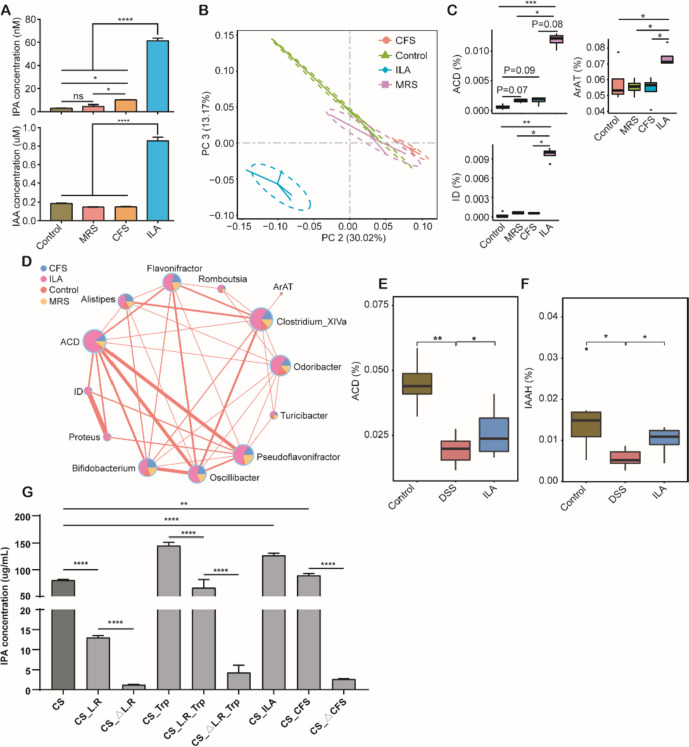
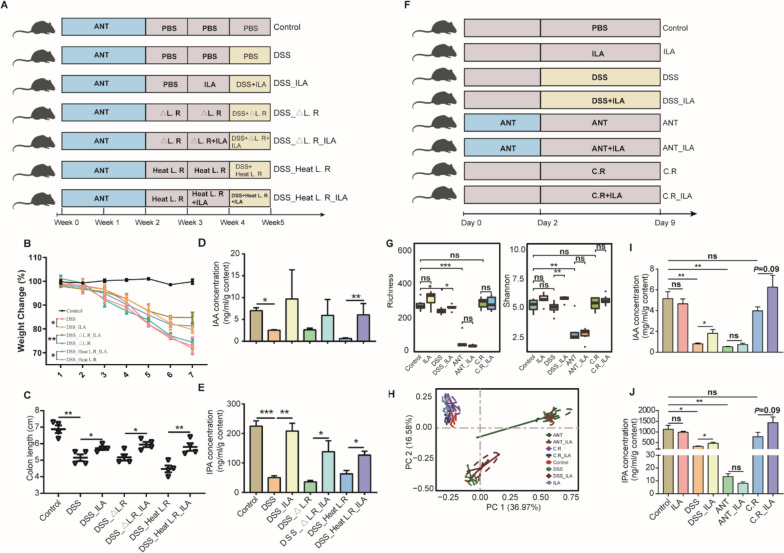
Results: Here, we have demonstrated that indole-3-lactic acid (ILA) is a key molecule produced by Lactobacillus in protecting against intestinal inflammation and correcting microbial dysbiosis. Specifically, Lactobacillus metabolizes tryptophan into ILA, thereby augmenting the expression of key bacterial enzymes implicated in tryptophan metabolism, leading to the synthesis of other indole derivatives including indole-3-propionic acid (IPA) and indole-3-acetic acid (IAA). Notably, ILA, IPA, and IAA possess the ability to mitigate intestinal inflammation and modulate the gut microbiota in both DSS-induced and IL-10-/- spontaneous colitis models. ILA increases the abundance of tryptophan-metabolizing bacteria (e.g., Clostridium), as well as the mRNA expression of acyl-CoA dehydrogenase and indolelactate dehydrogenase in vivo and in vitro, resulting in an augmented production of IPA and IAA. Furthermore, a mutant strain of Lactobacillus fails to protect against inflammation and producing other derivatives. ILA-mediated microbial cross-feeding was microbiota-dependent and specifically enhanced indole derivatives production under conditions of dysbiosis induced by Citrobacter rodentium or DSS, but not of microbiota disruption with antibiotics.
Conclusion: Taken together, we highlight mechanisms by which microbiome-host crosstalk cooperatively control intestinal homoeostasis through microbiota-derived indoles mediating the inter-microbial communication. These findings may contribute to the development of microbiota-derived metabolites or targeted "postbiotic" as potential interventions for the treatment or prevention of dysbiosis-driven diseases. Video Abstract.
Keywords: Lactobacillus; Indole derivatives; Intestinal inflammation; Microbial tryptophan metabolites.
© 2024. The Author(s).
Conflict of interest statement
The authors declare no competing interests.
Figures
Similar articles
-
Interplay between gut microbiota and tryptophan metabolism in type 2 diabetic mice treated with metformin.Microbiol Spectr. 2024 Oct 3;12(10):e0029124. doi: 10.1128/spectrum.00291-24. Epub 2024 Aug 20. Microbiol Spectr. 2024. PMID: 39162538 Free PMC article.
-
Novel cross-feeding human gut microbes metabolizing tryptophan to indole-3-propionate.Gut Microbes. 2025 Dec;17(1):2501195. doi: 10.1080/19490976.2025.2501195. Epub 2025 May 7. Gut Microbes. 2025. PMID: 40336187 Free PMC article.
-
Dysrupted microbial tryptophan metabolism associates with SARS-CoV-2 acute inflammatory responses and long COVID.Gut Microbes. 2024 Jan-Dec;16(1):2429754. doi: 10.1080/19490976.2024.2429754. Epub 2024 Nov 17. Gut Microbes. 2024. PMID: 39551951 Free PMC article.
-
Impact of the Gut Microbiota on Intestinal Immunity Mediated by Tryptophan Metabolism.Front Cell Infect Microbiol. 2018 Feb 6;8:13. doi: 10.3389/fcimb.2018.00013. eCollection 2018. Front Cell Infect Microbiol. 2018. PMID: 29468141 Free PMC article. Review.
-
Activation of aryl hydrocarbon receptor (AhR) in Alzheimer's disease: role of tryptophan metabolites generated by gut host-microbiota.J Mol Med (Berl). 2023 Mar;101(3):201-222. doi: 10.1007/s00109-023-02289-5. Epub 2023 Feb 9. J Mol Med (Berl). 2023. PMID: 36757399 Free PMC article. Review.
Cited by
-
Gut microbiota derived indole-3-acetic acid ameliorates precancerous inflammatory intestinal milieu to inhibit tumorigenesis through IL-35.J Immunother Cancer. 2025 Apr 23;13(4):e011155. doi: 10.1136/jitc-2024-011155. J Immunother Cancer. 2025. PMID: 40274281 Free PMC article.
-
Updated Insights into Probiotic Interventions for Metabolic Syndrome: Mechanisms and Evidence.Probiotics Antimicrob Proteins. 2025 May 7. doi: 10.1007/s12602-025-10554-x. Online ahead of print. Probiotics Antimicrob Proteins. 2025. PMID: 40332670 Review.
-
Complementary Feeding and Infant Gut Microbiota: A Narrative Review.Nutrients. 2025 Feb 20;17(5):743. doi: 10.3390/nu17050743. Nutrients. 2025. PMID: 40077613 Free PMC article. Review.
-
Gut Microbiota and Tryptophan Metabolism as Therapeutic Targets for Spinal Cord Injury: Insights From Probiotic Treatment.J Inflamm Res. 2025 Jun 7;18:7337-7355. doi: 10.2147/JIR.S513900. eCollection 2025. J Inflamm Res. 2025. PMID: 40503491 Free PMC article.
-
Gut microbial metabolic signatures in diabetes mellitus and potential preventive and therapeutic applications.Gut Microbes. 2024 Jan-Dec;16(1):2401654. doi: 10.1080/19490976.2024.2401654. Epub 2024 Oct 18. Gut Microbes. 2024. PMID: 39420751 Free PMC article. Review.
References
Publication types
MeSH terms
Substances
Grants and funding
- 32202721/National Science Fund for Distinguished Young Scholars
- BX20220342/National Postdoctoral Program for Innovative Talents
- 2022M723419/China Postdoctoral Science Foundation
- 2022YFC2105001/National Key Research and Development Program of China
- 2022YFC2105001/National Key Research and Development Program of China
LinkOut - more resources
Full Text Sources
Research Materials
