. 2024 May 1;32(5):1373-1386.
doi: 10.1016/j.ymthe.2024.03.024. Epub 2024 Mar 19.

APOE2 gene therapy reduces amyloid deposition and improves markers of neuroinflammation and neurodegeneration in a mouse model of Alzheimer disease

Affiliations

APOE2 gene therapy reduces amyloid deposition and improves markers of neuroinflammation and neurodegeneration in a mouse model of Alzheimer disease

Rosemary J Jackson et al. Mol Ther. .

Abstract

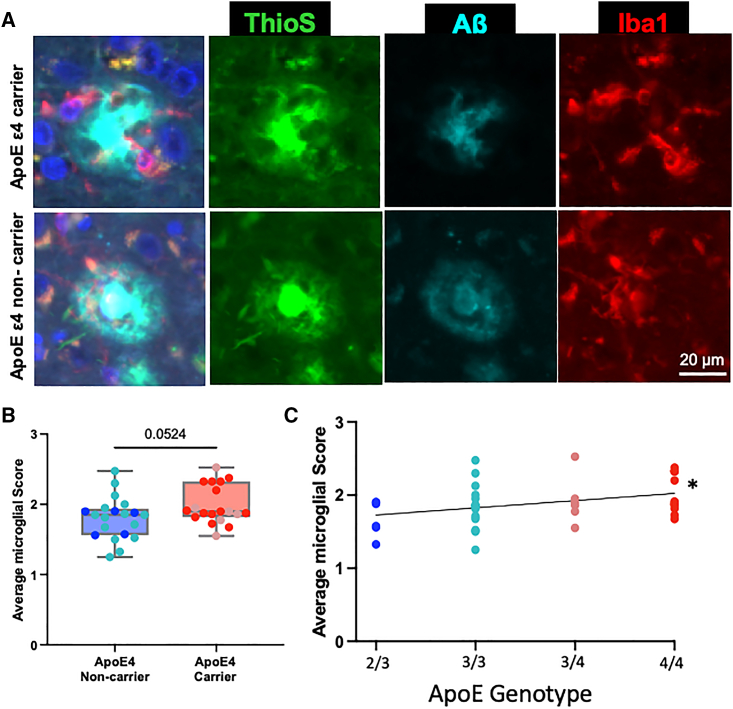
Epidemiological studies show that individuals who carry the relatively uncommon APOE ε2 allele rarely develop Alzheimer disease, and if they do, they have a later age of onset, milder clinical course, and less severe neuropathological findings than people without this allele. The contrast is especially stark when compared with the major genetic risk factor for Alzheimer disease, APOE ε4, which has an age of onset several decades earlier, a more aggressive clinical course and more severe neuropathological findings, especially in terms of the amount of amyloid deposition. Here, we demonstrate that brain exposure to APOE ε2 via a gene therapy approach, which bathes the entire cortical mantle in the gene product after transduction of the ependyma, reduces Aβ plaque deposition, neurodegenerative synaptic loss, and, remarkably, reduces microglial activation in an APP/PS1 mouse model despite continued expression of human APOE ε4. This result suggests a promising protective effect of exogenous APOE ε2 and reveals a cell nonautonomous effect of the protein on microglial activation, which we show is similar to plaque-associated microglia in the brain of Alzheimer disease patients who inherit APOE ε2. These data increase the potential that an APOE ε2 therapeutic could be effective in Alzheimer disease, even in individuals born with the risky ε4 allele.

Keywords: AAV; APOE; APOE2; Alzheimer disease; gene therapy; microglia; neuroinflammation.


Conflict of interest statement

Declaration of interests D.M.H. is on the scientific advisory board of C2N Diagnostics and has equity. D.M.H. is on the scientific advisory board of Denali Therapeutics, Genentech, and Cajal Therapeutics and consults for Asteroid. B.L.D. serves an advisory role with equity in Latus Biosciences, Patch Bio, Voyager Therapeutics, Carbon Biosciences, Spirovant Biosciences, Resilience, Panorama Medicines, Saliogen, and Homology Medicines. She has sponsored research from Novartis, Roche, Latus, Homology Medicines, Saliogen, and Spirovant. B.T.H. is on the scientific advisory board of Latus Bio and has an equity interest. B.T.H. has a family member who works at Novartis, and owns stock in Novartis; he serves on the scientific advisory board of Dewpoint and owns stock. He serves on a scientific advisory board of or is a consultant for AbbVie, Aprinoia Therapeutics, Arvinas, Avrobio, Axial, Biogen, BMS, Cure Alzheimer’s Fund, Cell Signaling, Dewpoint, Eisai, Genentech, Ionis, Latus, Novartis, Sangamo, Sanofi, Seer, Takeda, the US Department of Justice, Vigil, and Voyager. M.S.K., L.T., Y.C., and P.T.R. are founders of and shareholders in Latus Biosciences.

Figures

None
Graphical abstract
Figure 1
Figure 1
Ependymal cell expression of APOE2 driven by an AAV.APOE1 (A and B) Schematic of the transgene packaged into a modified AAV1 (A) and (B) injected ICV into the mouse brain. (C) In situ hybridization showing human APOE expression in the ependymal cells of the ventricle in a Apoe KO mouse. (D and E) Western blot (D) for APOE showing that ependymal-expressed APOE2 in the cortex of the Apoe KO mice is ∼10% (E) that of the endogenous level. (F) Viral genome copies in tissue extracted from each mouse (F4,35 = 5.546, p = 0.0014; post hoc Tukey’s multiple comparisons test). (G) Mass spectrometry-determined CSF APOE2 concentration as percentage of total APOE (F4,23 = 14.72, p < 0.0001; post hoc Dunnett’s test to vehicle). (H and I) The number of viral genome copies detected strongly correlates (H; R2 = 0.59, p < 0.0001) with the amount of APOE2 detected in CSF (I) and shows a V50 of 106.1 when assessed with a Boltzmann sigmoid curve (R2 = 0.67). n indicated as each mouse is an individual dot. ∗p < 0.05; ∗∗p < 0.01; ∗∗∗p < 0.001; ∗∗∗∗p < 0.0001. Bar graphs show mean ± SD, Box and whisker plots show median, interquartile range and min to max.
Figure 2
Figure 2
APOE2 reduces plaque deposition, number, and size in a dose-dependent manner (A) IHC for ThioS in the cortex of dosed APP/PS1/APOE4 animals. (B) Percentage of cortex coverage by ThioS staining is significantly lower in the high-dose animals (F3,27 = 4.310, p = 0.0329). (C) The percentage of cortical coverage by ThioS is significantly correlated (p = 0.01) to the number of viral genome copies in the brain sample from each mouse. (D and E) Plaque number (D) (F3,27 = 3.597, p = 0.0263) and plaque size (E) (F3,27 = 4.113, p = 0.0159); both show a significant effect in the high-dose group. n indicated as each mouse is an individual dot, with open circles as females and closed circles as males. Post hoc tests are shown as Dunnett’s multiple comparisons test compared with vehicle. ∗p < 0.05; ∗∗p < 0.01. Box and whisker plots show median, interquartile range and min to max.
Figure 3
Figure 3
APOE2 reduces microgliosis near plaques (A) IHC for IBA1 and Aβ in the cortex of dosed APP/PS1/APOE4 animals. (B and C) Average microglial response score (B) (F3,26 = 4.529, p = 0.0110) shows a reduction in microglial activation in the high- and mid-dose groups, and (C) is significantly correlated (p = 0.0081) to the number of viral genome copies in that mouse. (D) This reduction is due to a decrease in the number of plaques scored as a 4 and an increase in the number of plaques scored as a 1. n indicated as each mouse is an individual dot, with open circles as females and closed circles as males. Post hoc tests are shown as Dunnett’s multiple comparisons test compared with vehicle. (E and F) RNAscope for P2ry12 and Clec7a of high-dose and vehicle-treated animals (E) shows that there is (F) no change in the number of P2ry12 transcripts per microglia. (G) In the treated animals, there is a significant attenuation in the number of Clec7a transcripts per microglia in the plaque area (p = 0.0317) and the periplaque area (p = 0.0057) in the high-dose animals compared with controls. ∗p < 0.05; ∗∗p < 0.01. Box and whisker plots show median, interquartile range and min to max, scatter dot plots show mean ± SEM.
Figure 4
Figure 4
APOE2 reduces synaptic loss near plaques (A) IHC for PSD95 and Aβ in the cortex of dosed APP/PS1/APOE4 animals. (B and C) Synapse density is unchanged far from plaques (B), but (C) significantly increased near plaques (F3,27 = 5.153, p = 0.0060). (D) This leads to a significant decrease in the percentage of synapse loss in the high-dose animals compared with vehicle (F3,27 = 3.693, p = 0.0239). n indicated as each mouse is an individual dot, with open circles as females and closed circles as males. Post hoc tests are shown as Dunnett’s multiple comparisons test compared with vehicle. ∗p < 0.05. Bar graphs show mean ± SD, box and whisker plots show median, interquartile range and min to max.
Figure 5
Figure 5
APOE2 reduces microgliosis near plaques (A) IHC for IBA1 and Aβ in the frontal cortex of postmortem tissue from end-stage human AD cases. (B) Average microglial response score (t37 = 2.0, p = 0.0524) shows an increase in microglial activation in APOE4 carriers compared with noncarriers. (C) There is a significant correlation between microglia activation and APOE risk (where APOE2/3 individuals are assessed as having −1 APOE4 allele) (F1,35 = 5.410, p = 0.0259). ∗p < 0.05. Box and whisker plots show median, interquartile range and min to max.

Update of

References

    1. Corder E.H., Saunders A.M., Strittmatter W.J., Schmechel D.E., Gaskell P.C., Small G.W., Roses A.D., Haines J.L., Pericak-Vance M.A. Gene dose of apolipoprotein E type 4 allele and the risk of Alzheimer’s disease in late onset families. Science. 1993;261:921–923. doi: 10.1126/science.8346443. - DOI - PubMed
    1. Corder E.H., Saunders A.M., Risch N.J., Strittmatter W.J., Schmechel D.E., Gaskell P.C., Rimmler J.B., Locke P.A., Conneally P.M., Schmader K.E. Protective effect of apolipoprotein E type 2 allele for late onset Alzheimer disease. Nat. Genet. 1994;7:180–184. doi: 10.1038/ng0694-180. - DOI - PubMed
    1. AlzGene AlzGene. 2017. http://www.alzgene.org/meta.asp?geneID=83
    1. Rebeck G.W., Reiter J.S., Strickland D.K., Hyman B.T., William Rebeck G., Reiter J.S., Strickland D.K., Hyman B.T. Apolipoprotein E in sporadic Alzheimer’s disease: Allelic variation and receptor interactions. Neuron. 1993;11:575–580. doi: 10.1016/0896-6273(93)90070-8. - DOI - PubMed
    1. Reiman E.M., Arboleda-Velasquez J.F., Quiroz Y.T., Huentelman M.J., Beach T.G., Caselli R.J., Chen Y., Su Y., Myers A.J., Hardy J., et al. Exceptionally low likelihood of Alzheimer’s dementia in APOE2 homozygotes from a 5,000-person neuropathological study. Nat. Commun. 2020;11:667. doi: 10.1038/s41467-019-14279-8. - DOI - PMC - PubMed

Publication types

MeSH terms

LinkOut - more resources