. 2024 May 1;32(5):1425-1444.
doi: 10.1016/j.ymthe.2024.03.025. Epub 2024 Mar 19.

SOCS3 regulates pathological retinal angiogenesis through modulating SPP1 expression in microglia and macrophages

Affiliations

SOCS3 regulates pathological retinal angiogenesis through modulating SPP1 expression in microglia and macrophages

Tianxi Wang et al. Mol Ther. .

Abstract

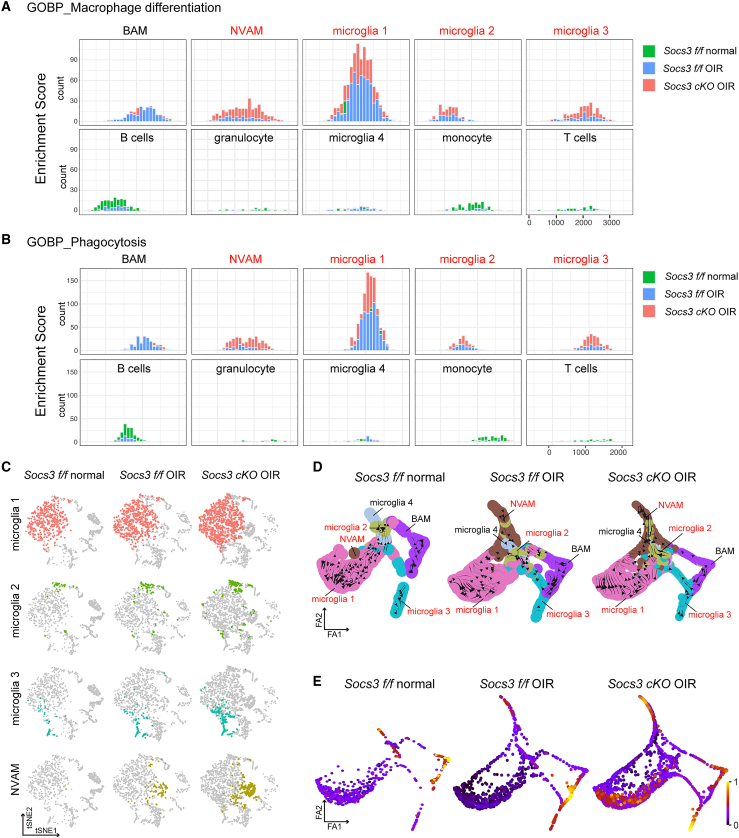
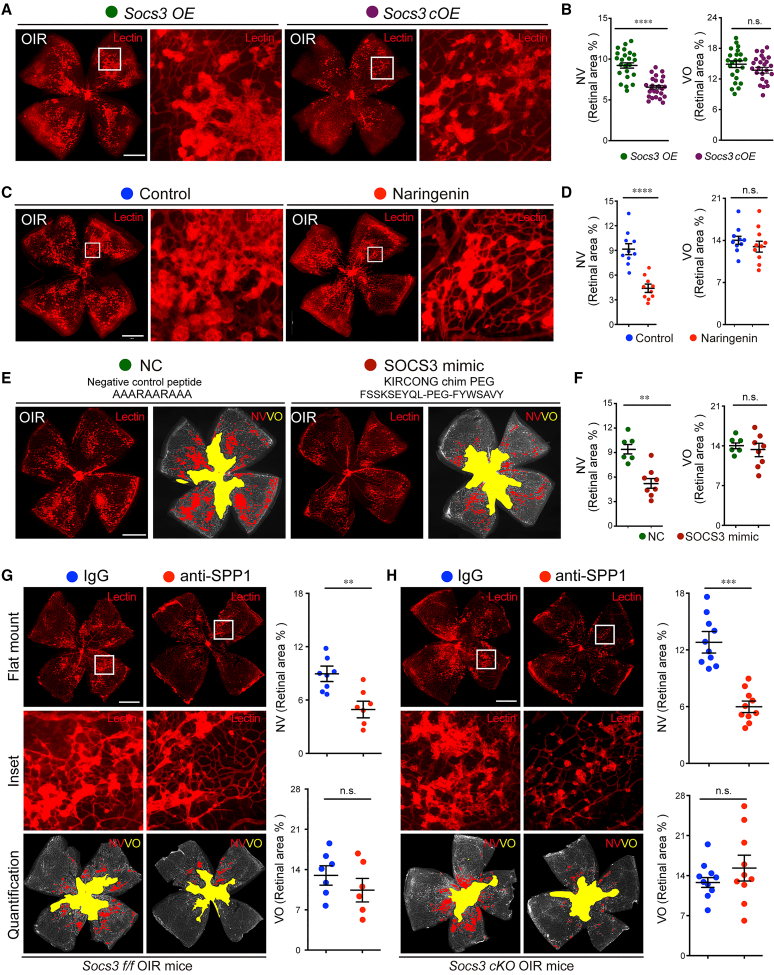
Pathological ocular angiogenesis has long been associated with myeloid cell activation. However, the precise cellular and molecular mechanisms governing the intricate crosstalk between the immune system and vascular changes during ocular neovascularization formation remain elusive. In this study, we demonstrated that the absence of the suppressor of cytokine signaling 3 (SOCS3) in myeloid cells led to a substantial accumulation of microglia and macrophage subsets during the neovascularization process. Our single-cell RNA sequencing data analysis revealed a remarkable increase in the expression of the secreted phosphoprotein 1 (Spp1) gene within these microglia and macrophages, identifying subsets of Spp1-expressing microglia and macrophages during neovascularization formation in angiogenesis mouse models. Notably, the number of Spp1-expressing microglia and macrophages exhibited further elevation during neovascularization in mice lacking myeloid SOCS3. Moreover, our investigation unveiled the Spp1 gene as a direct transcriptional target gene of signal transducer and activator of transcription 3. Importantly, pharmaceutical activation of SOCS3 or blocking of SPP1 resulted in a significant reduction in pathological neovascularization. In conclusion, our study highlights the pivotal role of the SOCS3/STAT3/SPP1 axis in the regulation of pathological retinal angiogenesis.

Keywords: SOCS3; SPP1; macrophages; microglia; neovascularization; neovascularization-associated microglia; retinal angiogenesis; retinopathy.


Conflict of interest statement

Declaration of interests Y.S. and T.W. are inventors on patent applications relating to this work filed by Boston Children’s Hospital.

Figures

None
Graphical abstract
Figure 1
Figure 1
Myeloid cell accumulation and SOCS3 induction during NV formation in OIR retinas (A) Representative cross-sections of IBA1 (green)- and Lectin (red)-stained normal and OIR retinas from C57BL/6J mice at P17. DAPI (blue) indicates nuclei. White boxes indicate retinal vessel areas or NV areas (n = 6). White arrows point to “Tufts” (NV). Scale bar, 100 μm. (B) Representative flat mounts of SOCS3 (green)-stained normal and OIR retinas from myeloid-specific LysM-Cre driven-Ai9 tdTomato (red) reporter mice at P17 (n = 6). Scale bar, 1,000 μm for flat-mount images, 200 μm for images in columns 2–4. The areas in white boxes were enlarged. (C) Representative flat mounts of Lectin (red)-stained OIR retinas from Socs3 floxed controls (Socs3 f/f) mice and myeloid SOCS3 deficiency (Socs3 cKO) mice at P17. Scale bar, 500 μm. (D) Quantification of the percentages of NV and VO relative to the total retinal areas in (C) (n = 26–35 retinas). ∗∗p < 0.01. (E) Representative fundus image of myeloid Socs3 cKO mice and Socs3 f/f mice under normal condition or during OIR at P90 and P180 (top). Retinal blood vessels on the fundus images were labeled with dark dashed lines (bottom). (F) Tortuosity index and integrated curvature were quantified using ImageJ (n = 6–8). ∗p < 0.05; ∗∗∗p < 0.001; ∗∗∗∗p < 0.0001. n.s., no significance.
Figure 2
Figure 2
Characterization of immune cell types in retinas during OIR (A) Schematic representation of retinal flat-mount images of normal and OIR retinas. (B) Workflow for 10x Genomics scRNA-seq on normal retinas (Socs3 f/f normal), OIR retinas (Socs3 f/f OIR), and myeloid SOCS3-deficient OIR retinas (Socs3 cKO OIR). (C) Identification of 11 distinct clusters of cells through single-cell transcriptomes of immune cells from the three groups. (D) Expression of gene markers in the 11 identified cell clusters presented as the percentage expressed and average expression. BAM, border-associated macrophage; NVAM, neovascular-associated microglia. (E) Recapitulation of the 11 clusters identified across the three groups. (F) Proportion of cells derived from each group. ∗p < 0.001 by hypergeometric enrichment test. The color of asterisk indicates the enriched groups, and the names of significantly enriched cell clusters and the number of the clusters (#1, 3, 4, and 6) are labeled in red.
Figure 3
Figure 3
Accumulation of subsets of microglia clusters regulated by SOCS3 during OIR (A) GOBP analysis depicting pathways involved in macrophage differentiation in the three groups. (B) GOBP analysis illustrating pathways involved in phagocytosis in the three groups. (C) tSNE plot showing the distribution of microglia 1, 2, 3, and NVAM within the total immune cells in the three groups. (D) RNA velocity analysis projected on ForceAtlas 2 (FA) embedding to represent cell fate transitions of significantly enriched clusters (microglia 1, 2, 3, and NVAM) in the three groups. (E) Pseudotime analysis of significantly enriched clusters (microglia 1, 2, 3, and NVAM) in the three groups, with latent time calculated using scVelo’s latent time function. Early cell types (microglia 1) were assigned as early time points, while mature cells (BAM and NVAM) were associated with later time points.
Figure 4
Figure 4
Induction of SPP1 in NVAMs in myeloid SOCS3-deficient OIR retinas (A) ForceAtlas2 (FA) plots illustrating Spp1 expressing in significantly enriched clusters across the three groups. (B) Representative cross-sections of IBA1 (red)- and SPP1 (green)-stained normal and OIR retinas from Socs3 f/f mice and Socs3 cKO mice at P13 and P14 (n = 6). DAPI (blue) indicates nuclei. White arrows in the top panel indicate SPP1+ microglia, and the white boxes highlight enlarged round-shaped microglia. INL, inner nuclear layer; ONL, outer nuclear layer; RGC, retinal ganglion cell layer; Scale bar, 200 μm. (C) The mRNA expression of Spp1 in CD45+ cells isolated from Socs3 f/f and Socs3 cKO OIR mice at P13 and P14 (n = 6). ∗∗p < 0.01. (D) Representative flat mounts of IBA1 (red)- and SPP1 (green)-stained choroids from Socs3 f/f and Socs3 cKO mice with laser-induced CNV at day 3 post-laser (n = 6–8). The areas in the blue boxes indicating similar sizes of CNV lesions were enlarged. Scale bar, 500 μm.
Figure 5
Figure 5
Suppression of myeloid Socs3 deficiency-induced NV by Spp1 inhibited in two angiogenesis mouse models (A) A schematic illustrating the strategy of deleting myeloid SOCS3 in wild-type (WT) genetic background or a Spp1 knockout background. (B) Representative retinal flat mounts of Lectin (red)-stained OIR retinas from myeloid SOCS3 knockout mice in Spp1 knockout background (Socs3 cKO::Spp1 KO) and Socs3 floxed mice in Spp1knockout background (Socs3 f/f:: Spp1 KO) at P17. NV areas in the white boxes (inset panel) were enlarged. In the Quantification panel, red areas indicate NV and yellow areas indicate VO. Scale bar, 1,000 μm. (C) Quantification of the percentages of NV and VO relative to the total retinal areas in (B) (n = 14–18 retinas). (D) Representative flat mounts of Lectin-stained choroids from myeloid SOCS3 knockout mice in WT background (Socs3 cKO::Spp1 WT) and Socs3 floxed mice in WT background (Socs3 f/f:: Spp1 WT) with laser-induced CNV at day 7 post-laser. The CNV areas in the white boxes were enlarged. Scale bar, 500 μm. (E) Quantification of CNV lesion areas in each group in (D) (n = 12–20 retinas). ∗∗∗p < 0.001. (F) Representative Lectin (red)-stained choroidal flat mounts from myeloid SOCS3 knockout mice in Spp1 KO background (Socs3 cKO::Spp1 KO) and Socs3 floxed mice in Spp1 knockout background (Socs3 f/f:: Spp1 KO) with laser-induced CNV at day 7 post-laser. The CNV areas in the white boxes were enlarged. Scale bar, 500 μm. (G) Quantification of CNV lesion areas in each group in (F) (n = 16–17). n.s., no significance.
Figure 6
Figure 6
Spp1 as a direct target of STAT3 (A) Schematic representation of three luciferase reporters, including the Spp1 promoter (P2.6k), enhancer region 1 (E1), and enhancer region 2 (E2). Three 5′ regions of the Spp1 gene were subcloned into the luciferase reporter pTA-luc plasmid. The gray dots indicate putative STAT3 binding sites. Luc, luciferase; TATA, a TATA box. (B) Fold changes in relative luciferase activities (normalized with Renilla luciferase activities) for P2.6k, E1, and E2 vs. the control (empty pTA-luc vector) (n = 6). ∗∗∗∗p < 0.0001; n.s., no significance. (C) Fold changes in relative luciferase activities (normalized with Renilla luciferase activities) for P2.6k and P2.6k-mutant (P2.6k-Mut) co-transfected with a STAT3-expressing vector (n = 6–8). P2.6k-Mut: STAT3 binding sites in P2.6k were mutated from TTCNNNGAA to GTGNNNCAC. ∗p < 0.05; ∗∗p < 0.01; ∗∗∗∗p < 0.0001; n.s., no significance. (D) Representative choroidal flat mounts from Ai9 f/f::Socs3 cKO and Ai9 f/f::LysM-Cre mice with laser-induced CNV at day 3 post-laser and quantification of tdTomato+SPP1+ areas in CNV (n = 12–19). Scale bar, 200 μm. (E) Representative retinal flat mounts from Ai9 f/f::Socs3 cKO and Ai9 f/f::LysM-Cre mice with laser-induced CNV at day 3 post-laser and quantification of tdTomato+SPP1+ cell numbers in retinas (n = 21–23). Scale bar, 200 μm. (F) Representative flat mounts of SPP1 (green)- and phospho-STAT3 (magenta)-stained retinas from Ai9 f/f::Socs3 cKO and Ai9 f/f::LysM-Cre tdTomato (red) reporter mice with laser-induced CNV at day 3 post-laser. DAPI (blue) indicates nuclei. Scale bar, 20 μm.
Figure 7
Figure 7
Inhibition of NV in OIR retinas by induction of SOCS3 or blocking SPP1 (A) Representative Lectin (red)-stained retinal flat mounts from myeloid SOCS3 overexpression (Socs3 cOE) OIR mice and littermate Socs3 floxed controls (Socs3 OE) OIR mice. Scale bar, 1,000 μm. (B) Quantification of the percentages of NV and VO relative to the total retinal areas in (A) (n = 23–25 retinas). ∗∗∗∗p < 0.0001, n.s., no significance. (C) Representative Lectin (red)-stained retinal flat mounts from OIR mice naringenin- or control-intraperitoneally injected from P12 to P16. Scale bar, 1,000 μm. (D) Quantification of the percentages of NV and VO relative to the total retinal areas in (C) (n = 10 retinas). ∗∗∗∗p < 0.0001, n.s., no significance. (E) Representative Lectin (red)-stained retinal flat mounts from OIR mice intravitreally injected with SOCS3 peptide mimic (KIRCONG chim PEG) or control peptide at P12. Scale bar, 1,000 μm. Red, Lectin, or NV area; yellow, VO area. (F) Quantification of the percentages of NV and VO relative to the total retinal areas at P17 in (E) (n = 8). ∗∗p < 0.01, n.s., no significance. (G) Representative Lectin (red)-stained retinal flat mounts from Socs3 f/f OIR mice and Socs3 cKO OIR mice OIR mice intravitreally injected with SPP1 neutralizing antibody or control antibody at P14. Scale bar, 1,000 μm. Red, Lectin, or NV area; yellow, VO area. (H) Quantification of the percentages of NV and VO relative to the total retinal areas at P17 (n = 6–9). ∗∗p < 0.01; ∗∗∗p < 0.001, n.s., no significance.

Similar articles

Cited by

References

    1. Wang Q., Zheng J., Pettersson S., Reynolds R., Tan E.K. The link between neuroinflammation and the neurovascular unit in synucleinopathies. Sci. Adv. 2023;9 doi: 10.1126/sciadv.abq1141. - DOI - PMC - PubMed
    1. Iadecola C. The Neurovascular Unit Coming of Age: A Journey through Neurovascular Coupling in Health and Disease. Neuron. 2017;96:17–42. doi: 10.1016/j.neuron.2017.07.030. - DOI - PMC - PubMed
    1. Fantin A., Vieira J.M., Gestri G., Denti L., Schwarz Q., Prykhozhij S., Peri F., Wilson S.W., Ruhrberg C. Tissue macrophages act as cellular chaperones for vascular anastomosis downstream of VEGF-mediated endothelial tip cell induction. Blood. 2010;116:829–840. doi: 10.1182/blood-2009-12-257832. - DOI - PMC - PubMed
    1. Haruwaka K., Ikegami A., Tachibana Y., Ohno N., Konishi H., Hashimoto A., Matsumoto M., Kato D., Ono R., Kiyama H., et al. Dual microglia effects on blood brain barrier permeability induced by systemic inflammation. Nat. Commun. 2019;10:5816. doi: 10.1038/s41467-019-13812-z. - DOI - PMC - PubMed
    1. Hartnett M.E., Penn J.S. Mechanisms and management of retinopathy of prematurity. N. Engl. J. Med. 2013;368:1162–1163. doi: 10.1056/NEJMc1301021. - DOI - PubMed

Publication types

MeSH terms