. 2024 Mar 4:15:1297893.
doi: 10.3389/fimmu.2024.1297893. eCollection 2024.

T cell specific deletion of Casitas B lineage lymphoma-b reduces atherosclerosis, but increases plaque T cell infiltration and systemic T cell activation

Affiliations

T cell specific deletion of Casitas B lineage lymphoma-b reduces atherosclerosis, but increases plaque T cell infiltration and systemic T cell activation

Winnie G Vos et al. Front Immunol. .

Abstract

Introduction: Atherosclerosis is a lipid-driven inflammatory disease of the arterial wall, and the underlying cause of the majority of cardiovascular diseases. Recent advances in high-parametric immunophenotyping of immune cells indicate that T cells constitute the major leukocyte population in the atherosclerotic plaque. The E3 ubiquitin ligase Casitas B-lymphoma proto-oncogene-B (CBL-B) is a critical intracellular regulator that sets the threshold for T cell activation, making CBL-B a potential therapeutic target to modulate inflammation in atherosclerosis. We previously demonstrated that complete knock-out of CBL-B aggravated atherosclerosis in Apoe-/- mice, which was attributed to increased macrophage recruitment and increased CD8+ T cell activation in the plaque.

Methods: To further study the T cell specific role of CBL-B in atherosclerosis, Apoe-/- CD4cre Cblb fl/fl (Cbl-bcKO) mice and Apoe-/-CD4WTCblbfl/fl littermates (Cbl-bfl/fl) were fed a high cholesterol diet for ten weeks.

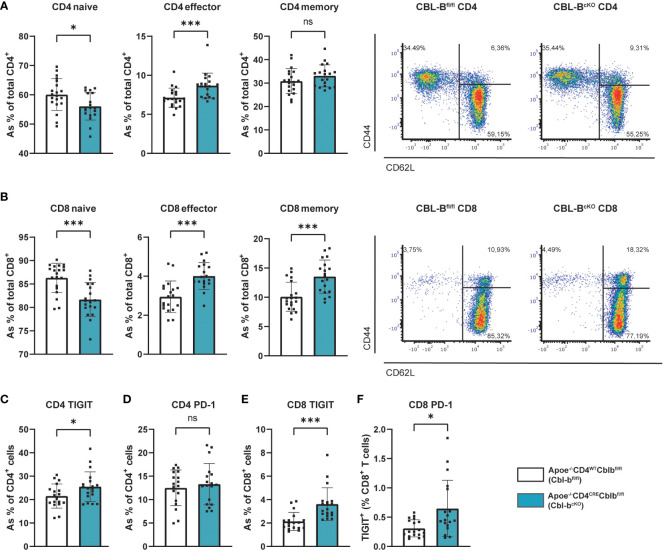
Results: Cbl-bcKO mice had smaller atherosclerotic lesions in the aortic arch and root compared to Cbl-bfl/fl, and a substantial increase in CD3+ T cells in the plaque. Collagen content in the plaque was decreased, while other plaque characteristics including plaque necrotic core, macrophage content, and smooth muscle cell content, remained unchanged. Mice lacking T cell CBL-B had a 1.4-fold increase in CD8+ T cells and a 1.8-fold increase in regulatory T cells in the spleen. Splenic CD4+ and CD8+ T cells had increased expression of C-X-C Motif Chemokine Receptor 3 (CXCR3) and interferon-γ (IFN-γ), indicating a T helper 1 (Th1)-like/effector CD8+ T cell-like phenotype.

Conclusion: In conclusion, Cbl-bcKO mice have reduced atherosclerosis but show increased T cell accumulation in the plaque accompanied by systemic T cell activation.

Keywords: CBL-B; T cells; atherosclerosis; exhaustion; inflammation.


Conflict of interest statement

HB was a recipient of funding from Nimbus Therapeutics for an unrelated project assessing the roles of CBL proteins. The remaining authors declare that the research was conducted in the absence of any commercial or financial relationships that could be construed as a potential conflict of interest. The author(s) declared that they were an editorial board member of Frontiers, at the time of submission. This had no impact on the peer review process and the final decision.

Figures

Figure 1
Figure 1
Cbl-bcKO mice have smaller atherosclerotic plaque size, with increased T cell infiltration. (A) Atherosclerotic plaque area in the aortic arch including its main branch points of Cbl-bfl/fl (n=20) and Cbl-bcKO mice (n=19) after 10 weeks of HCD. (B) Representative longitudinal section of aortic arches (haematoxylin and eosin staining, scale bar represents 100 µm). (C) Virmani classification of the plaques in the aortic arch, categorised in either intimal xanthoma (IX), pathological intimal thickening (PIT), or fibrous cap atheroma (FCA). (D) Quantification of necrotic core area in plaques of the aortic arch (n=20/16). (E) Quantification and representative images (scale bar represents 100 µm) of plaque smooth muscle cell (SMC) content (αSMA+, n=19/19) in the aortic arch. (F) Histochemical quantification and representative images (scale bar represents 100 µm) of collagen content (Sirius Red, n=20/19). (G) Total CD45+ cells per atherosclerotic aorta as measured by flow cytometry (n=10/10). (H) Immunohistochemical quantification and representative images (scale bar represents 100 µm) of plaque of macrophage (MAC3+, n=18/16) content. (I) The percentage of CD11b+ myeloid cells from the total CD45+ population in the atherosclerotic aorta (n=10/10). (J) Immunohistochemical quantification of the number of CD3+ T cells in the aortic arch (n=18/18). The percentage of CD4+ T cells (K), CD4+CD25+FoxP3+ Tregs (L), and CD8+ (M) T cells in the atherosclerotic aorta (n=10/10) as measured by flow cytometry. Data is shown as mean ± SD, outliers were removed by ROUT test (Q = 1%) and normality was tested Shapiro-Wilk normality test. Normally distributed data was analysed by an unpaired 2-tailed student t-test and non-normally distributed data was analysed by Mann-Whitney U test. Statistical significance is displayed as *p < 0.05, **p < 0.01, not significant (ns).
Figure 2
Figure 2
Cbl-bcKO mice have more T cells, while myeloid cells are not affected. Absolute number of CD45+ leukocytes (n=10/10) and relative amount of major immune cell populations in the spleen (A) and blood (B). (C) Percentage of CD11b+ myeloid cells in the circulation (n=12/12). (D) Frequency of Ly6G+ neutrophils (n=12/12), siglecF+ eosinophils (n=11/12), and CD11c+MHC-II+ dendritic cells (n=11/11). (E) Ly6C expression level of CD11b+Ly6G cells in the circulation (n=12/12). Absolute number of (F) CD4+ and CD8+ T cells (n=20/20), and (G) CD25+FoxP3+ regulatory T cells (n=16/18) in the spleen. (H) Frequency of CX3CR1 expressing of CD4+ T cells (n=14/15) or CD8+ T cells (n=17/15) in the circulation. Division index of (I) CD4+ and (J) CD8+ T cells after 3-day CD3/ CD28/IL-2 induced proliferation with representative image of CFSE proliferation flow cytometric staining of CD4+ T cells (n=4/4). Data is shown as mean ± SD, outliers were removed by ROUT test (Q = 1%) and normality was tested Shapiro-Wilk normality test. Normally distributed data was analysed by an unpaired 2-tailed student t-test and non-normally distributed data was analysed by Mann-Whitney U test. Statistical significance is displayed as **p < 0.01, ****p < 0.0001, not significant (ns).
Figure 3
Figure 3
Cbl-bcKO mice have increased T cell activation and exhaustion. Percentage of naive, effector, and central memory cells in the (A) splenic CD4+ T cell population (n=20/19) and the (B) splenic CD8+ T cell population (n=20/19), including representative dot plot of the flow cytometric analysis of T cell activation. Quantification of (C) TIGIT expression (n=18/19) and (D) PD-1 expression (n=18/19) of splenic CD4+ T cells. Quantification of (E) TIGIT expression of CD8+ T cells in spleen (n=19/18) and (F) PD-1 expression (n=18/18). Data is shown as mean ± SD, outliers were removed by ROUT test (Q = 1%) and normality was tested Shapiro-Wilk normality test. Normally distributed data was analysed by an unpaired 2-tailed student t-test and non-normally distributed data was analysed by Mann-Whitney U test. Statistical significance is displayed as *p < 0.05, ***p < 0.001, not significant (ns).
Figure 4
Figure 4
Cbl-bcKO T cells have a more pro-inflammatory phenotype. (A) Frequency of CXCR3 expressing splenic Th1 cells (n=19/18). (B) Quantification of IFN-γ producing splenic CD4+ T cells (n=12/12) after five hours of PMA/Ionomycin stimulation, with Monensin and Brefeldin added after the first hour. (C) Quantification of IFN-γ producing splenic CD4+ T cells after 5-day Th0 and Th1 polarization (n=5/5), including representative dot plot of the flow cytometric analysis of IFN-γ production by Th1 cells after 5-day polarization (E). (D) Relative normalised gene expression of Ifng in CD4+ T cells after 2-day stimulation with CD3/CD28/IL-2 (n=3/3). Percentage of (F) Th2 (CCR4+), (G) Th17 (CCR6+), and (H) T follicular helper (PD-1+CXCR5+) cells (n=18/19). Frequency of CXCR3 expressing splenic CD8+ T cells (n=19/18) in (I) spleen and (J) blood. (K) Quantification of IFN-γ producing splenic CD8+ T cells (n=12/12) after five hours of PMA/Ionomycin stimulation, with Monensin and Brefeldin added after the first hour. (L) Relative normalised gene expression of IFN-γ, perforin 1 (Prf1), and Granzyme B (Gzmb) in CD8+ T cells after 2-day stimulation with CD3/CD28/IL-2 (n=3/3). Data is shown as mean ± SD, outliers were removed by ROUT test (Q = 1%) and normality was tested Shapiro-Wilk normality test. Normally distributed data was analysed by an unpaired 2-tailed student t-test and non-normally distributed data was analysed by Mann-Whitney U test. Statistical significance is displayed as *p < 0.05, **p < 0.01, ***p < 0.001, ****p < 0.0001, not significant (ns).

References

    1. Kobiyama K, Ley K. Atherosclerosis. Circ Res. (2018) 123:1118–20. doi: 10.1161/CIRCRESAHA.118.313816 - DOI - PMC - PubMed
    1. Ross R. Atherosclerosis–an inflammatory disease. N Engl J Med. (1999) 340:115–26. doi: 10.1056/NEJM199901143400207 - DOI - PubMed
    1. Ridker PM, Everett BM, Thuren T, MacFadyen JG, Chang WH, Ballantyne C, et al. . Antiinflammatory therapy with canakinumab for atherosclerotic disease. N Engl J Med. (2017) 377:1119–31. doi: 10.1056/NEJMoa1707914 - DOI - PubMed
    1. Tardif JC, Kouz S, Waters DD, Bertrand OF, Diaz R, Maggioni AP, et al. . Efficacy and safety of low-dose colchicine after myocardial infarction. N Engl J Med. (2019) 381:2497–505. doi: 10.1056/NEJMoa1912388 - DOI - PubMed
    1. Nidorf SM, Eikelboom JW, Budgeon CA, Thompson PL. Low-dose colchicine for secondary prevention of cardiovascular disease. J Am Coll Cardiol. (2013) 61:404–10. doi: 10.1016/j.jacc.2012.10.027 - DOI - PubMed

Publication types

MeSH terms

Substances