

Artificial intelligence (AI)-assisted chest computer tomography (CT) insights: a study on intensive care unit (ICU) admittance trends in 78 coronavirus disease 2019 (COVID-19) patients
- PMID: 38505008
- PMCID: PMC10944742
- DOI: 10.21037/jtd-23-1150
Artificial intelligence (AI)-assisted chest computer tomography (CT) insights: a study on intensive care unit (ICU) admittance trends in 78 coronavirus disease 2019 (COVID-19) patients
Abstract
Background: The global coronavirus disease 2019 (COVID-19) pandemic has posed substantial challenges for healthcare systems, notably the increased demand for chest computed tomography (CT) scans, which lack automated analysis. Our study addresses this by utilizing artificial intelligence-supported automated computer analysis to investigate lung involvement distribution and extent in COVID-19 patients. Additionally, we explore the association between lung involvement and intensive care unit (ICU) admission, while also comparing computer analysis performance with expert radiologists' assessments.
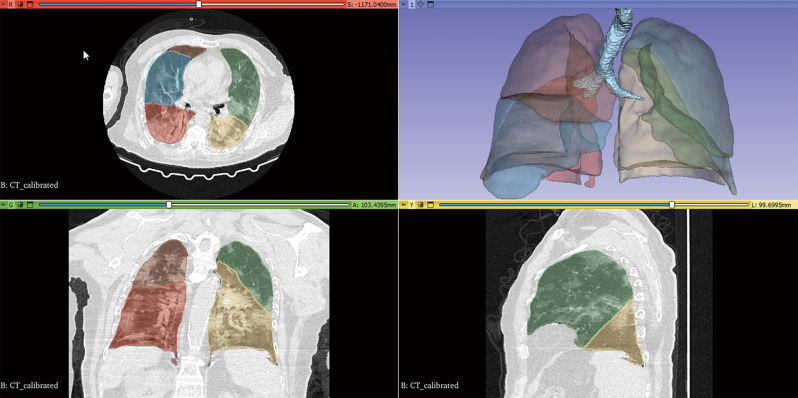
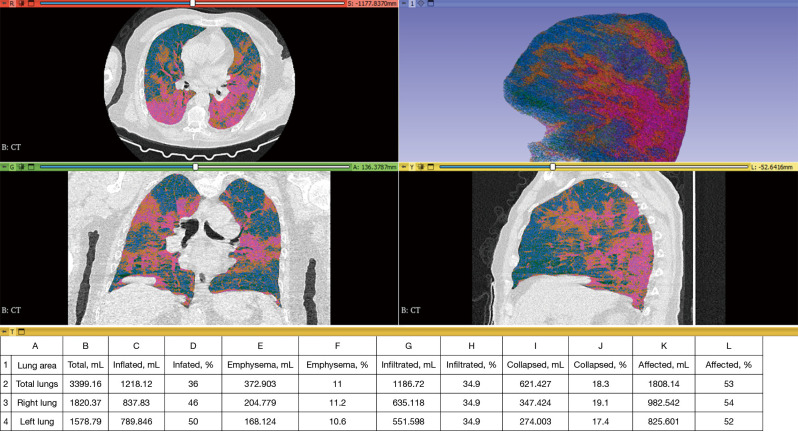
Methods: A total of 81 patients from an open-source COVID database with confirmed COVID-19 infection were included in the study. Three patients were excluded. Lung involvement was assessed in 78 patients using CT scans, and the extent of infiltration and collapse was quantified across various lung lobes and regions. The associations between lung involvement and ICU admission were analysed. Additionally, the computer analysis of COVID-19 involvement was compared against a human rating provided by radiological experts.
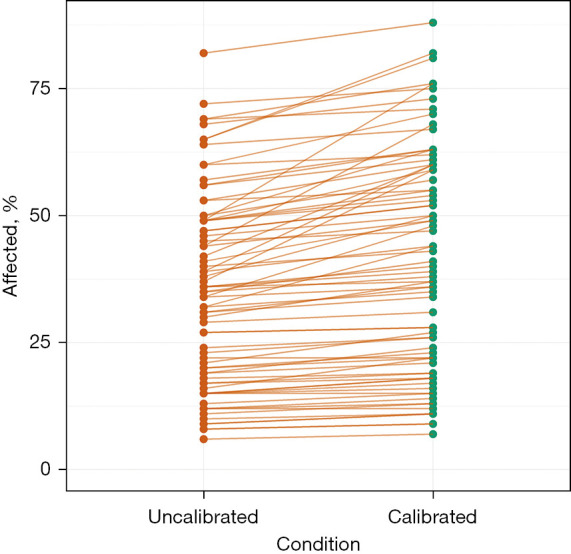
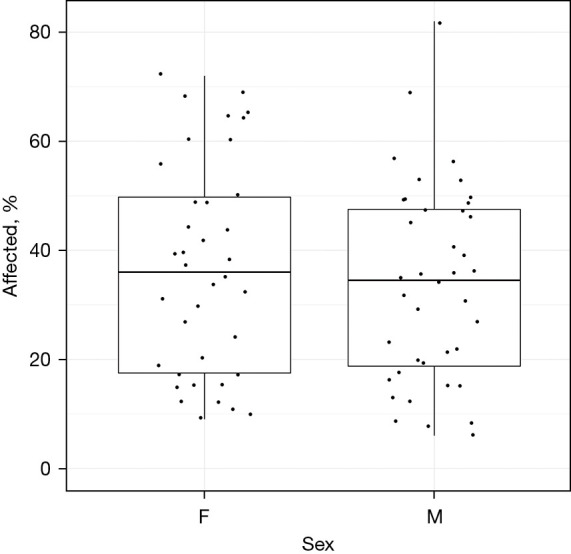
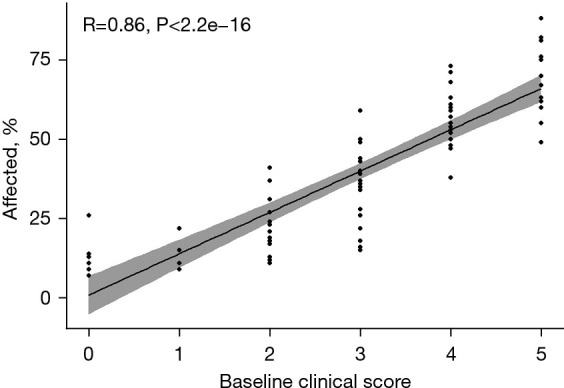
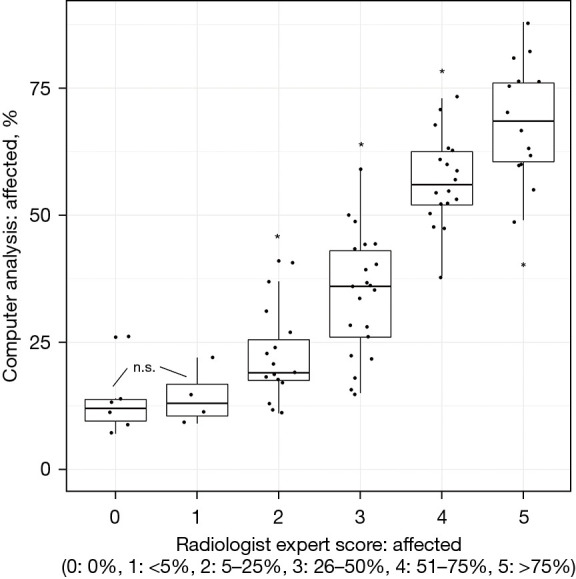
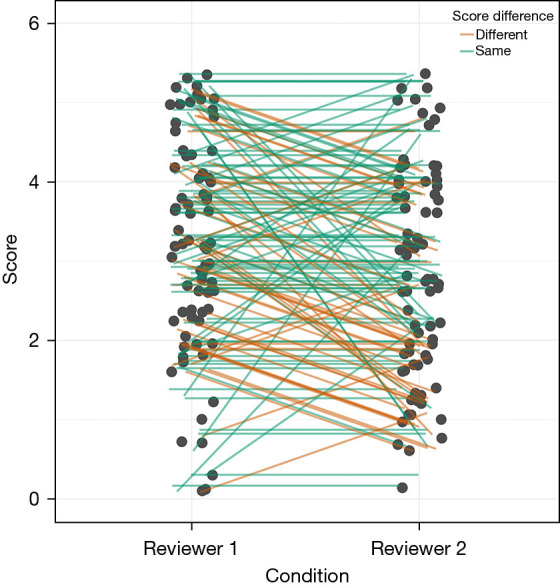
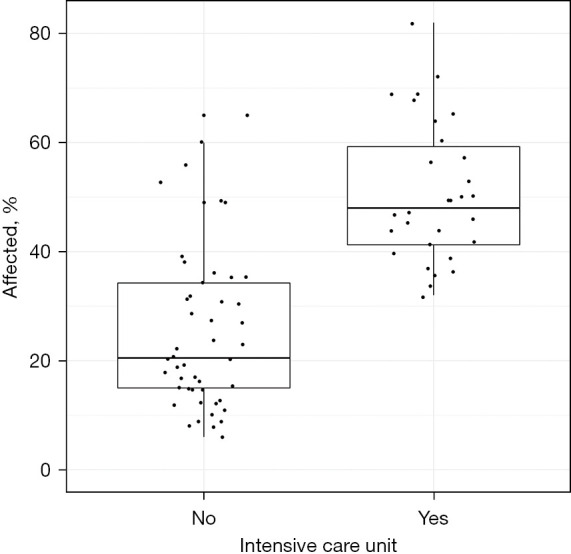
Results: The results showed a higher degree of infiltration and collapse in the lower lobes compared to the upper lobes (P<0.05). No significant difference was detected in the COVID-19-related involvement of the left and right lower lobes. The right middle lobe demonstrated lower involvement compared to the right lower lobes (P<0.05). When examining the regions, significantly more COVID-19 involvement was found when comparing the posterior vs. the anterior halves and the lower vs. the upper half of the lungs. Patients, who required ICU admission during their treatment exhibited significantly higher COVID-19 involvement in their lung parenchyma according to computer analysis, compared to patients who remained in general wards. Patients with more than 40% COVID-19 involvement were almost exclusively treated in intensive care. A high correlation was observed between computer detection of COVID-19 affections and the rating by radiological experts.
Conclusions: The findings suggest that the extent of lung involvement, particularly in the lower lobes, dorsal lungs, and lower half of the lungs, may be associated with the need for ICU admission in patients with COVID-19. Computer analysis showed a high correlation with expert rating, highlighting its potential utility in clinical settings for assessing lung involvement. This information may help guide clinical decision-making and resource allocation during ongoing or future pandemics. Further studies with larger sample sizes are warranted to validate these findings.
Keywords: COVID lung involvement; Coronavirus disease 2019 (COVID-19); artificial intelligence-supported computed tomography computer analysis (AI-supported CT computer analysis); clinical decision-making; forecast of intensive care unit admission (forecast of ICU admission).
2024 Journal of Thoracic Disease. All rights reserved.
Conflict of interest statement
Conflicts of Interest: All authors have completed the ICMJE uniform disclosure form (available at https://jtd.amegroups.com/article/view/10.21037/jtd-23-1150/coif). R.S.J.E. reports grants from the National Heart, Lung, and Blood Institute (NHLBI) for the present manuscript, with no time limit specified for this item; contract with Lung Biotechnology and Insmed to serve as Image Core for a study; sponsored research agreement with Boehringer Ingelheim; consulting fees from Leuko Labs and Mount Sinai; payment/honoraria Chiesi; patent pending in the area of lung cancer risk assessment using machine learning technology; he is co-founder and stockholder of Quantitative Imaging Solutions, a company specializing in imaging analytics in the lung cancer space. S.P. is a full-time employee of Isomics, Inc. and participated in the research as part of his normal work activities. The other authors have no conflicts of interest to declare.
Figures
Update of
-
From Voxels to Prognosis: AI-Driven Quantitative Chest CT Analysis Forecasts ICU Requirements in 78 COVID-19 Cases.Res Sq [Preprint]. 2023 Jul 5:rs.3.rs-3027617. doi: 10.21203/rs.3.rs-3027617/v5. Res Sq. 2023. Update in: J Thorac Dis. 2024 Feb 29;16(2):1009-1020. doi: 10.21037/jtd-23-1150. PMID: 37333197 Free PMC article. Updated. Preprint.
Similar articles
-
From Voxels to Prognosis: AI-Driven Quantitative Chest CT Analysis Forecasts ICU Requirements in 78 COVID-19 Cases.Res Sq [Preprint]. 2023 Jul 5:rs.3.rs-3027617. doi: 10.21203/rs.3.rs-3027617/v5. Res Sq. 2023. Update in: J Thorac Dis. 2024 Feb 29;16(2):1009-1020. doi: 10.21037/jtd-23-1150. PMID: 37333197 Free PMC article. Updated. Preprint.
-
Risk Stratification for ECMO Requirement in COVID-19 ICU Patients Using Quantitative Imaging Features in CT Scans on Admission.Diagnostics (Basel). 2021 Jun 3;11(6):1029. doi: 10.3390/diagnostics11061029. Diagnostics (Basel). 2021. PMID: 34205176 Free PMC article.
-
Clinical and laboratory data, radiological structured report findings and quantitative evaluation of lung involvement on baseline chest CT in COVID-19 patients to predict prognosis.Radiol Med. 2021 Jan;126(1):29-39. doi: 10.1007/s11547-020-01293-w. Epub 2020 Oct 12. Radiol Med. 2021. PMID: 33047295 Free PMC article.
-
Prognostic findings for ICU admission in patients with COVID-19 pneumonia: baseline and follow-up chest CT and the added value of artificial intelligence.Emerg Radiol. 2022 Apr;29(2):243-262. doi: 10.1007/s10140-021-02008-y. Epub 2022 Jan 20. Emerg Radiol. 2022. PMID: 35048222 Free PMC article. Review.
-
Comparison of the computed tomography findings in COVID-19 and other viral pneumonia in immunocompetent adults: a systematic review and meta-analysis.Eur Radiol. 2020 Dec;30(12):6485-6496. doi: 10.1007/s00330-020-07018-x. Epub 2020 Jun 27. Eur Radiol. 2020. PMID: 32594211 Free PMC article.
Cited by
-
Diagnostic Accuracy of Lung Ultrasound in Rabbit Subclinical Lung Lesions.Vet Sci. 2025 Apr 7;12(4):340. doi: 10.3390/vetsci12040340. Vet Sci. 2025. PMID: 40284842 Free PMC article.
-
Adapting Classification Neural Network Architectures for Medical Image Segmentation Using Explainable AI.J Imaging. 2025 Feb 13;11(2):55. doi: 10.3390/jimaging11020055. J Imaging. 2025. PMID: 39997558 Free PMC article.
-
Exploring Augmented Reality Integration in Diagnostic Imaging: Myth or Reality?Diagnostics (Basel). 2024 Jun 23;14(13):1333. doi: 10.3390/diagnostics14131333. Diagnostics (Basel). 2024. PMID: 39001224 Free PMC article. Review.
References
Grants and funding
LinkOut - more resources
Full Text Sources