. 2023 Nov 22;5(2):109-122.
doi: 10.1093/ehjdh/ztad073. eCollection 2024 Mar.

Development and internal validation of machine learning-based models and external validation of existing risk scores for outcome prediction in patients with ischaemic stroke

Affiliations

Development and internal validation of machine learning-based models and external validation of existing risk scores for outcome prediction in patients with ischaemic stroke

Daniel Axford et al. Eur Heart J Digit Health. .

Abstract

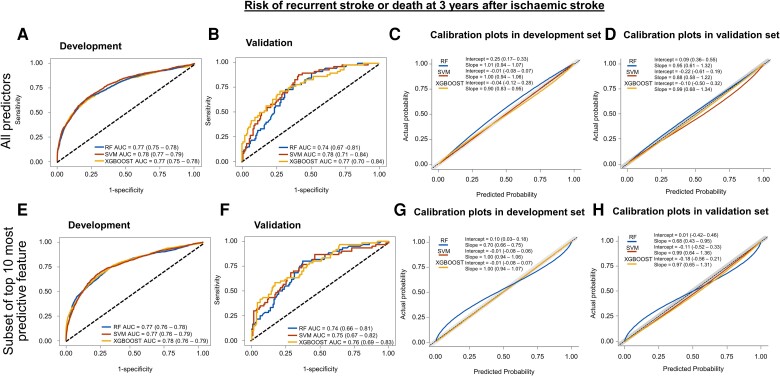
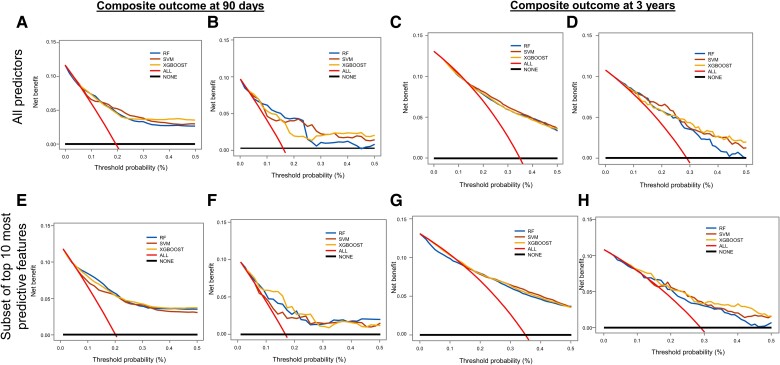
Aims: We developed new machine learning (ML) models and externally validated existing statistical models [ischaemic stroke predictive risk score (iScore) and totalled health risks in vascular events (THRIVE) scores] for predicting the composite of recurrent stroke or all-cause mortality at 90 days and at 3 years after hospitalization for first acute ischaemic stroke (AIS).

Methods and results: In adults hospitalized with AIS from January 2005 to November 2016, with follow-up until November 2019, we developed three ML models [random forest (RF), support vector machine (SVM), and extreme gradient boosting (XGBOOST)] and externally validated the iScore and THRIVE scores for predicting the composite outcomes after AIS hospitalization, using data from 721 patients and 90 potential predictor variables. At 90 days and 3 years, 11 and 34% of patients, respectively, reached the composite outcome. For the 90-day prediction, the area under the receiver operating characteristic curve (AUC) was 0.779 for RF, 0.771 for SVM, 0.772 for XGBOOST, 0.720 for iScore, and 0.664 for THRIVE. For 3-year prediction, the AUC was 0.743 for RF, 0.777 for SVM, 0.773 for XGBOOST, 0.710 for iScore, and 0.675 for THRIVE.

Conclusion: The study provided three ML-based predictive models that achieved good discrimination and clinical usefulness in outcome prediction after AIS and broadened the application of the iScore and THRIVE scoring system for long-term outcome prediction. Our findings warrant comparative analyses of ML and existing statistical method-based risk prediction tools for outcome prediction after AIS in new data sets.

Keywords: Machine-based learning; Mortality; Prediction models; Statistical; Stroke.


Conflict of interest statement

Conflict of interest: None declared.

Figures

Graphical Abstract
Graphical Abstract
Figure 1
Figure 1
Receiver operating characteristic curves and calibration plots for 90-day outcome. Receiver operating characteristic curves for predicting composite or recurrent stroke or mortality at 90 days after hospitalization for acute ischaemic stroke are shown in the development (A) and internal validation (B) data sets stratified according to individual models using all the predictors. The corresponding calibration plots are depicted for the development (C) and internal validation (D) data sets. The lower panel illustrates receiver operating characteristic curves for each model [(E) development, (F) internal validation data sets] and calibration plots [(G) development, (H) internal validation data sets] for predicting 90-day outcome using the 10 most important predictors. AUC, area under the receiver operating characteristic curve; CI, confidence interval; RF, random forest; SVM, support vector machine; XGBOOST, extreme gradient boosting.
Figure 2
Figure 2
Receiver operating characteristic curves and calibration plots for 3-year outcome. Receiver operating characteristic curves for predicting composite or recurrent stroke or mortality at 3 years after hospitalization for acute ischaemic stroke are shown in the development (A) and internal validation (B) data sets stratified according to individual models using all the predictors. The corresponding calibration plots are depicted for the development (C) and internal validation (D) data sets. The lower panel illustrates receiver operating characteristic curves for each model [(E) development, (F) internal validation data sets] and calibration plots [(G) development, (H) internal validation data sets] for predicting 3-year outcome using the 10 most important predictors. AUC, area under the receiver operating characteristic curve; CI, confidence interval; RF, random forest; SVM, support vector machine; XGBOOST, extreme gradient boosting.
Figure 3
Figure 3
Top 10 important predictors for the composite outcome identified by random forest, extreme gradient boosting, and the average of all models. The bars represent the relative contribution of variables in predicting the clinical outcome. All models are consistent in identifying exposure/no exposure to antithrombotic drugs as the most important predictor for 90-day clinical outcome. Similarly, all models are consistent in identifying age as the most important predictor for 3-year clinical outcome. ACEI, angiotensin-converting enzyme inhibitor or angiotensin type II receptor blocker; BMI, body mass index; CCB, calcium channel blocker; DBP, diastolic blood pressure; DM, diabetes mellitus; LOS, length of stay; NIHSS, National Institutes of Health Stroke Scale; SBP, systolic blood pressure; XGBOOST, extreme gradient boosting.
Figure 4
Figure 4
External validation with generation of receiver operating characteristic curves, calibration, and decision analysis curves of the ischaemic stroke predictive risk score and totalled health risks in vascular events scoring systems. The left two panels represent external validation of the ischaemic stroke predictive risk score with construction of receiver operating characteristic curves, recalibration plots, and decision curve analysis for 90-day and 3-year outcome prediction. Similarly, the right two panels represent the external validation of the totalled health risks in vascular events score with the generation of receiver operating characteristic curves, recalibration plots, and decision curve analysis for 90-day and 3-year outcome prediction.
Figure 5
Figure 5
Decision curve analysis plots for each study model with all predictors are shown at 90 days in the development (A) and the internal validation sets (B) and at 3 years in the development (C) and internal validation sets (D). Similarly, decision curve analysis plots for each study model with the top 10 most important predictors are shown at 90 days in the development set (E) and internal validation set (F) and at 3 years in the development (G) and internal validation sets (H). RF, random forest; SVM, support vector machine; XGBOOST, extreme gradient boosting.

References

    1. Virani SS, Alonso A, Aparicio HJ, Benjamin EJ, Bittencourt MS, Callaway CW, et al. Heart disease and stroke statistics—2021 update: a report from the American Heart Association. Circulation 2021;143:e254–e743. - PubMed
    1. Feng W, Hendry RM, Adams RJ. Risk of recurrent stroke, myocardial infarction, or death in hospitalized stroke patients. Neurology 2010;74:588–593. - PubMed
    1. Dhamoon MS, Sciacca RR, Rundek T, Sacco RL, Elkind MS. Recurrent stroke and cardiac risks after first ischemic stroke: the Northern Manhattan Study. Neurology 2006;66:641–646. - PubMed
    1. Hankey GJ, Jamrozik K, Broadhurst RJ, Forbes S, Burvill PW, Anderson CS, et al. Long-term risk of first recurrent stroke in the Perth Community Stroke Study. Stroke 1998;29:2491–2500. - PubMed
    1. Saposnik G, Cote R, Mamdani M, Raptis S, Thorpe KE, Fang J, et al. JURaSSiC: accuracy of clinician vs risk score prediction of ischemic stroke outcomes. Neurology 2013;81:448–455. - PMC - PubMed

LinkOut - more resources