. 2024 Mar 3;14(5):2190-2209.
doi: 10.7150/thno.92909. eCollection 2024.

G protein subunit alpha i2's pivotal role in angiogenesis

Affiliations

G protein subunit alpha i2's pivotal role in angiogenesis

Chao-Wen Bai et al. Theranostics. .

Abstract

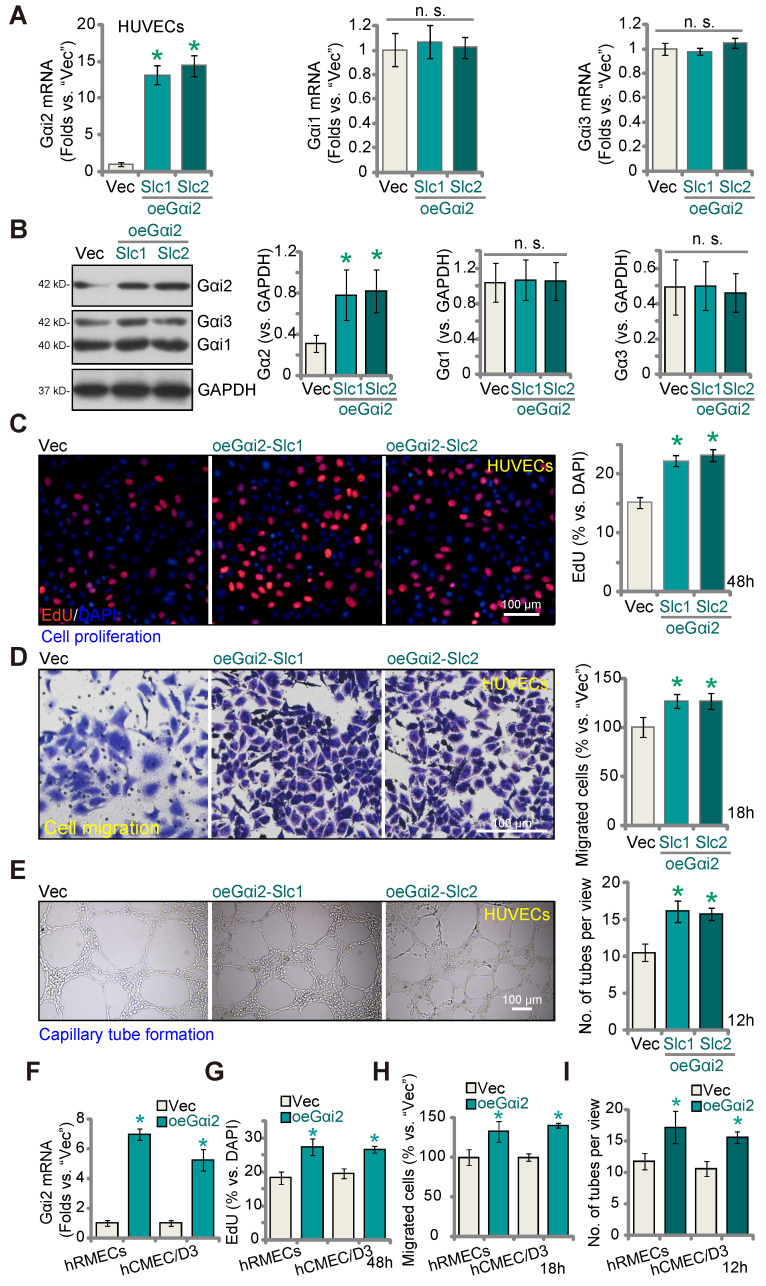
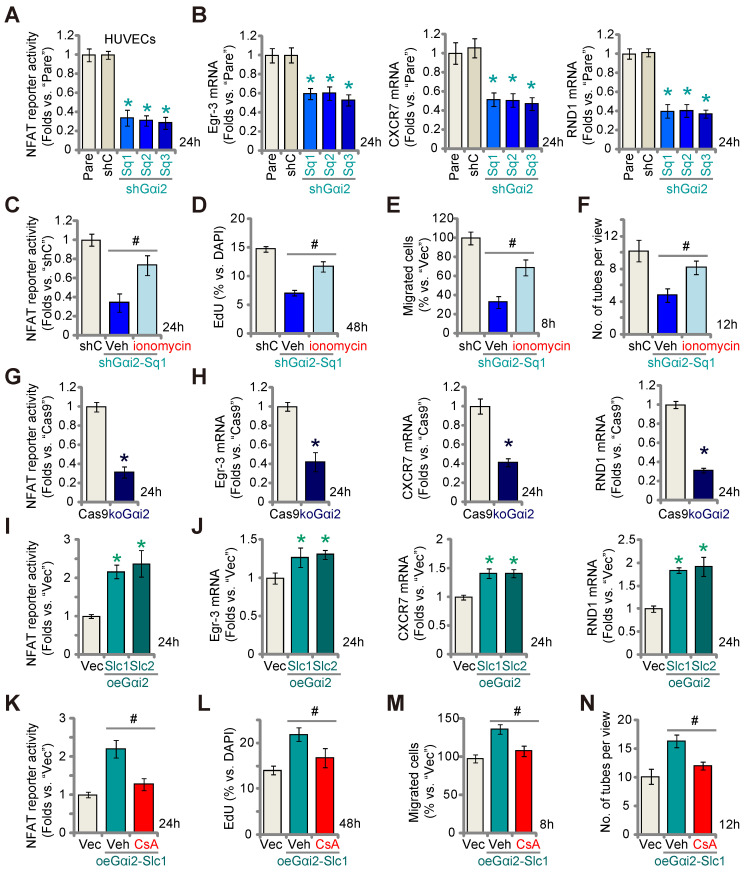
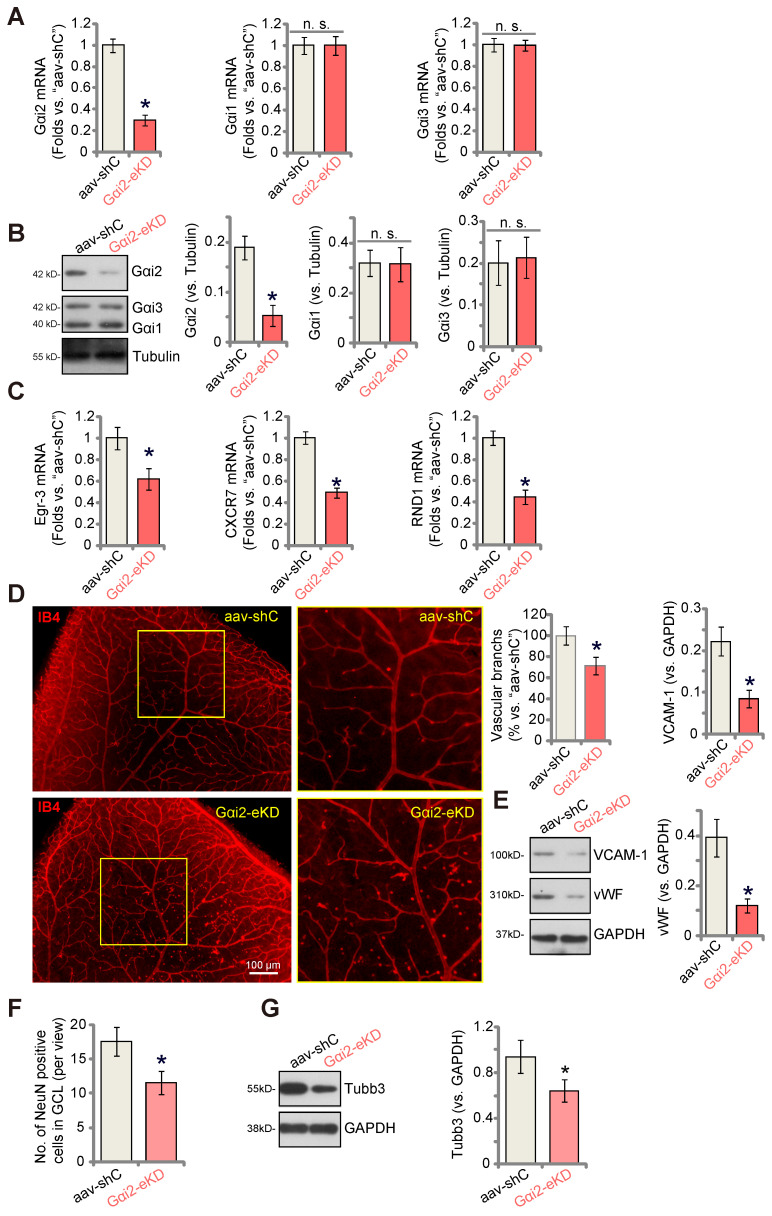
Here we explored the potential role of Gαi2 (G protein subunit alpha i2) in endothelial cell function and angiogenesis. Methods: Genetic methodologies such as shRNA, CRISPR/Cas9, dominant negative mutation, and overexpression were utilized to modify Gαi2 expression or regulate its function. Their effects on endothelial cell functions were assessed in vitro. In vivo, the endothelial-specific Gαi2 shRNA adeno-associated virus (AAV) was utilized to silence Gαi2 expression. The impact of this suppression on retinal angiogenesis in control mice and streptozotocin (STZ)-induced diabetic retinopathy (DR) mice was analyzed. Results: Analysis of single-cell RNA sequencing data revealed Gαi2 (GNAI2) was predominantly expressed in retinal endothelial cells and expression was increased in retinal endothelial cells following oxygen-induced retinopathy (OIR) in mice. Moreover, transcriptome analysis linking Gαi2 to angiogenesis-related processes/pathways, supported by increased Gαi2 expression in experimental OIR mouse retinas, highlighted its possible role in angiogenesis. In various endothelial cell types, shRNA-induced silencing and CRISPR/Cas9-mediated knockout (KO) of Gαi2 resulted in substantial reductions in cell proliferation, migration, invasion, and capillary tube formation. Conversely, Gαi2 over-expression in endothelial cells induced pro-angiogenic activities, enhancing cell proliferation, migration, invasion, and capillary tube formation. Furthermore, our investigation revealed a crucial role of Gαi2 in NFAT (nuclear factor of activated T cells) activation, as evidenced by the down-regulation of NFAT-luciferase reporter activity and pro-angiogenesis NFAT-targeted genes (Egr3, CXCR7, and RND1) in Gαi2-silenced or -KO HUVECs, which were up-regulated in Gαi2-overexpressing endothelial cells. Expression of a dominant negative Gαi2 mutation (S48C) also down-regulated NFAT-targeted genes, slowing proliferation, migration, invasion, and capillary tube formation in HUVECs. Importantly, in vivo experiments revealed that endothelial Gαi2 knockdown inhibited retinal angiogenesis in mice, with a concomitant down-regulation of NFAT-targeted genes in mouse retinal tissue. In contrast, Gαi2 over-expression in endothelial cells enhanced retinal angiogenesis in mice. Single-cell RNA sequencing data confirmed increased levels of Gαi2 specifically in retinal endothelial cells of mice with streptozotocin (STZ)-induced diabetic retinopathy (DR). Importantly, endothelial Gαi2 silencing ameliorated retinal pathological angiogenesis in DR mice. Conclusion: Our study highlights a critical role for Gαi2 in NFAT activation, endothelial cell activation and angiogenesis, offering valuable insights into potential therapeutic strategies for modulating these processes.


Conflict of interest statement

Competing Interests: The authors have declared that no competing interest exists.

Figures

Figure 1
Figure 1
Gαi2 is highly expressed in endothelial cells and participates in angiogenesis and signaling. Visualization of the publicly available retinal scRNA-seq data (GEO: #GSE150703) of oxygen-induced retinopathy mice (OIR) and normoxic mice (NORM) using Uniform Manifold Approximation and Projection (UMAP) projections (A). The density plot illustrates the expression and spatial distribution of Gαi2 in retinas, with the scale of expression density displayed on the right side of the plot (B). A differential gene volcano plot of endothelial cells compares differences between OIR and NORM group (C). Enrichment analysis shown possible biological process (BP, D) and KEGG pathways (E) of the top 100 co-expressing genes (CEGs) with Gαi2 in retinal tissues of OIR model mice. Expression of Gαi2 mRNA (F) and protein (G) in GFP-sorted retinal cells of OIR mice and normoxic mice (NORM) mice was shown. Data were expressed as mean ± standard deviation (SD). Each group included six mice (n = 6, half male, half female) (F and G). *P < 0.05 versus “NORM” group.
Figure 2
Figure 2
Gαi2 silencing impedes in vitro angiogenesis in cultured endothelial cells. The mRNA (A) and protein (B) expression of Gαi1/2/3 in stable human umbilical vein endothelial cells (HUVEC) with the listed Gαi2 shRNA (shGαi2-Sq1, shGαi2-Sq2 or shGαi2-Sq3), scramble shRNA (“shC”) or in parental control (“Pare”) HUVECs were shown; The exact same number of the above HUVECs were maintained under complete medium and cultivated for designated hours, in vitro cell proliferation (by measuring nuclear EdU incorporation, C), migration (“Transwell” assays, D) and capillary tube formation (E) were examined. Gαi2 mRNA expression in human retinal microvascular endothelial cells (hRMECs) and human cerebral microvascular endothelial cells (hCMEC/D3) with shC or shGαi2-Sq1 was shown (F); The endothelial cells were maintained under complete medium and cultivated for designated hours, in vitro cell proliferation (G), migration (H) and capillary tube formation (I) were tested similarly, with results quantified. Data were expressed as mean ± standard deviation (SD). The quantifications were from five biological repeats (n = 5). *P < 0.05 versus “shC” group. “n.s.” stands for non-statistical differences (P > 0.05). Scale bar = 100 μm.
Figure 3
Figure 3
Gαi2 silencing provokes apoptosis in cultured endothelial cells. The exact same number of HUVECs with the listed Gαi2 shRNA (shGαi2-Sq1, shGαi2-Sq2 or shGαi2-Sq3), scramble shRNA (“shC”) or the parental control (“Pare”) HUVECs were cultivated for 60h, Caspase-3/9-PARP activation/cleavages were tested (A-C); The depolarization of mitochondria was examined by quantifying aggregation of JC-1 green monomers (D); Cell apoptosis was tested by measuring TUNEL-positive nuclei ratio (E). The exact same number of hRMECs or hCMEC/D3 with shC or shGαi2-Sq1 were cultivated for 60h, depolarization of mitochondria and apoptosis were respectively examined via JC-1 staining (F) and nuclear TUNEL staining assays (G). Data were expressed as mean ± standard deviation (SD). Quantifications were from five biological repeats (n = 5). *P < 0.05 versus “shC” group. Scale bar = 100 μm.
Figure 4
Figure 4
Complete Gαi2 knockout (KO) leads to significant anti-angiogenic activity in cultured endothelial cells. The mRNA (A) and protein (B) expression of Gαi1/2/3 in single stable HUVECs with both Cas9-expressing construct plus the CRISPR/Cas9-Gαi2-KO construct (“koGαi2”) or the control construct (“Cas9”) was shown. The exact same number of the above HUVECs were cultivated for designated hours, in vitro cell proliferation (by measuring nuclear EdU incorporation, C), migration (“Transwell” assays, D), invasion (“Matrigel Transwell” assays, E) and capillary tube formation (F) were tested; Depolarization of mitochondria and apoptosis were respectively examined via measuring JC-1 monomer intensity (G) and nuclear TUNEL ratio (H). Gαi2 mRNA expression in hRMECs or hCMEC/D3 with same CRISPR/Cas9 genetic treatment, “koGαi2” or “Cas9”, was shown (I); The exact same number of cells were cultivated for designated hours, in vitro cell proliferation (J), migration (K) and capillary tube formation (L) were tested similarly. Data were expressed as mean ± standard deviation (SD). Quantifications were from five biological repeats (n = 5). *P < 0.05 versus “Cas9” group. “n.s.” stands for non-statistical differences (P > 0.05). Scale bar = 100 μm.
Figure 5
Figure 5
Gαi2 over-expression promotes angiogenesis in cultured endothelial cells. The mRNA (A) and protein (B) expression of Gαi1/2/3 in HUVECs with the Gαi2-overexpressing construct (oeGαi2-Slc1 and oeGαi2-Slc2, representing two stable selections) or empty vector (“Vec”) was shown; The exact same number of the above HUVECs were cultivated for designated hours, in vitro cell proliferation (by measuring nuclear EdU incorporation, C), migration (“Transwell” assays, D), and capillary tube formation (E) were tested. Gαi2 mRNA expression in hRMECs or hCMEC/D3 with the Gαi2-overexpressing construct (oeGαi2) or empty vector (“Vec”) was shown (F); The exact same number of cells were cultivated for designated hours, in vitro cell proliferation (G), cell migration (H) and capillary tube formation (I) were tested similarly. Data were expressed as mean ± standard deviation (SD). Quantifications were from five biological repeats (n = 5). *P < 0.05 versus “Vec” group. “n.s.” stands for non-statistical differences (P > 0.05). Scale bar = 100 μm.
Figure 6
Figure 6
Gαi2 is important for activation of the transcription factor NFAT in endothelial cells. Stable HUVECs with the listed Gαi2 shRNA (shGαi2-Sq1, shGαi2-Sq2 or shGαi2-Sq3), scramble nonsense shRNA (“shC”), Cas9-expressing construct plus the CRISPR/Cas9-Gαi2-KO construct (“koGαi2”), the control construct (“Cas9”), the Gαi2-overexpressing construct (oeGαi2-Slc1 and oeGαi2-Slc2), empty vector (“Vec”) were established, the NFAT-luciferase reporter activity was tested (A, G and I), and expression of listed mRNAs tested as well (B, H and J). Stable shGαi2-Sq1-expressing HUVECs were treated with ionomycin (5 µM) or vehicle control (DMSO) for listed hours, the NFAT-luciferase reporter activity was tested (C); The in vitro cell proliferation (by measuring nuclear EdU incorporation, D), migration (“Transwell” assays, E) and capillary tube formation (F) were measured, with results quantified. Stable oeGαi2-Slc1-expressing HUVECs were treated with cyclosporin A (CsA, 2.5 µM) or vehicle control (DMSO) for listed hours, the NFAT-luciferase reporter activity was tested (K); The in vitro cell proliferation (L), cell migration (M) and capillary tube formation (N) were tested similarly, with results quantified. “Pare” stands for the parental control cells. Data were expressed as mean ± standard deviation (SD). Quantifications were from five biological repeats (n = 5). *P < 0.05 versus “shC”/”Cas9”/”Vec” control cells (A, B, G-J). # P < 0.05 versus “Veh” treatment (C-F, K-N).
Figure 7
Figure 7
A dominant negative Gαi2 hinders in vitro angiogenesis in cultured endothelial cells. The expression of Gαi1/2/3 in stable HUVECs with the dominant negative mutant Gαi2 (S48C, “dnGαi2”) or the empty vector (“Vec”) was shown (A); The NFAT-luciferase reporter activity (B) and expression of listed mRNAs (C) were measured as well. The exact same number of the above HUVECs were cultivated for designated hours, in vitro cell proliferation (by measuring nuclear EdU incorporation, D), migration (“Transwell” assays, E), invasion (“Matrigel Transwell” assays, F) and capillary tube formation (G) were also tested, with results quantified. Data were expressed as mean ± standard deviation (SD). Quantifications were from five biological repeats (n = 5). *P < 0.05 versus “Vec” control cells.
Figure 8
Figure 8
Endothelial knockdown of Gαi2 inhibits retinal angiogenesis in mice. Adult C57BL/6 mice (32.40 ± 2.32-day old, three male two female in each group) received intravitreal injections of either murine AAV5-TIE1-Gαi2 shRNA (“Gαi2-eKD”, 0.1 μL) or AAV5-TIE1 scramble control shRNA (“aav-shC”, 0.1 μL). After a twenty-one-day period, expression of listed mRNAs and proteins in murine retinal tissues was tested (A-C, E and G). Additionally, the retinal vasculature was visualized using retinal isolectin B4 (IB4) staining (D). In the retinal slides, NeuN/DAPI immunofluorescence staining was performed, and the quantification of NeuN-positive RGCs within GCL was conducted (F). “GCL”: ganglion cell layer, “ONL”: Outer nuclear layer, “INL”: Inner nuclear layer. Data were expressed as mean ± standard deviation (SD). Quantifications were from five biological repeats (n = 5). *P < 0.05 versus “aav-shC” group. Scale bar = 50/100 μm.
Figure 9
Figure 9
Endothelial over-expression of Gαi2 strengthens retinal angiogenesis in mice. Adult C57BL/6 mice (31.30 ± 2.45 day old, three male two female in each group) received intravitreal injections of either murine AAV5-TIE1-Gαi2-expressing construct (“Gαi2-eOE”, 0.1 μL) or AAV5-TIE1-vector (“aav-Vec”, 0.1 μL). After a twenty-one-day period, expression of listed mRNAs and proteins in murine retinal tissues was tested (A-C, and E). Additionally, the retinal vasculature was visualized using retinal isolectin B4 (IB4) staining (D). Data were expressed as mean ± standard deviation (SD). Quantifications were from five biological repeats (n = 5). *P < 0.05 versus “aav-Vec” group. Scale bar = 100 μm.
Figure 10
Figure 10
Endothelial Gαi2 silencing ameliorates retinal pathological angiogenesis in diabetic retinopathy mice. The publicly accessible scRNA-seq data (GEO: #GSE209872) obtained from STZ-induced diabetic mice through Uniform Manifold Approximation and Projection (UMAP) projections were displayed (A). The density plot reveals the expression and spatial distribution of Gαi2 in retinas, with the expression density scale depicted on the right side of the plot (B). Analysis based on single-cell data demonstrates the expression profiles of Gαi2 across different retinal cell types in STZ mice (C). Ninety days post the final STZ administration, retinal tissues from diabetic retinopathy ("DR") and "Mock" control mice (31.94 ± 1.98 day old, half male half female) were collected for the analysis of Gαi2 mRNA and protein expression (D-F). Thirty days after the last STZ treatment, mice received intravitreal injections of murine AAV5-TIE1-Gαi2 shRNA ("Gαi2-eKD", 0.1 μL) or AAV5-containing scramble control shRNA ("aav-shC", 0.1 μL). After an additional 60 days, examination of listed mRNA and protein expression in retinal tissues was conducted (G, H, K-M). Alternatively, mice underwent Evans blue (EB) infusion for 2h, and the subsequent EB leakage was quantified (I). IB4 staining was conducted to visualize the retinal vasculature (J, scale bar = 50 μm). "Mock" refers to mice administered with citrate buffer. Each group consisted of eight mice (n = 8). *P< 0.05 compared to "Mock" (D-F). *P< 0.05 (G-M).

References

    1. Dudley AC, Griffioen AW. Pathological angiogenesis: mechanisms and therapeutic strategies. Angiogenesis. 2023;26:313–47. - PMC - PubMed
    1. Risau W, Flamme I. Vasculogenesis. Annu Rev Cell Dev Biol. 1995;11:73–91. - PubMed
    1. Eelen G, Treps L, Li X, Carmeliet P. Basic and Therapeutic Aspects of Angiogenesis Updated. Circ Res. 2020;127:310–29. - PubMed
    1. Betz C, Lenard A, Belting HG, Affolter M. Cell behaviors and dynamics during angiogenesis. Development. 2016;143:2249–60. - PubMed
    1. Albini A, Tosetti F, Li VW, Noonan DM, Li WW. Cancer prevention by targeting angiogenesis. Nat Rev Clin Oncol. 2012;9:498–509. - PubMed

Publication types

MeSH terms