

Noninvasive intervention by transcranial ultrasound stimulation: Modulation of neural circuits and its clinical perspectives
- PMID: 38505983
- PMCID: PMC11488602
- DOI: 10.1111/pcn.13663
Noninvasive intervention by transcranial ultrasound stimulation: Modulation of neural circuits and its clinical perspectives
Abstract
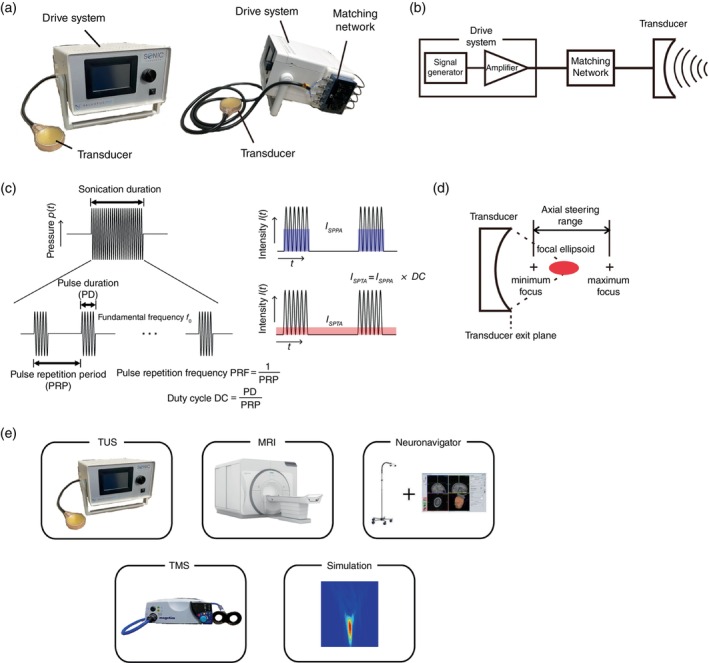
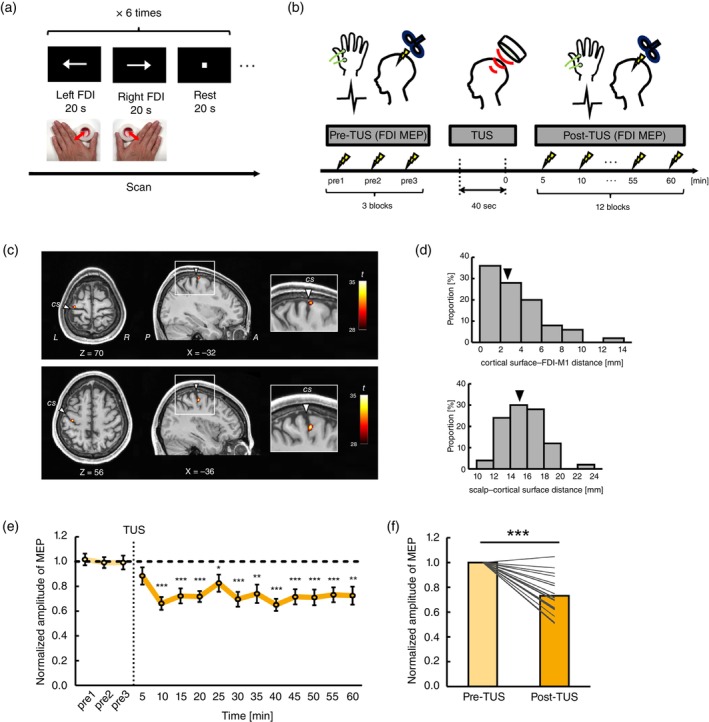
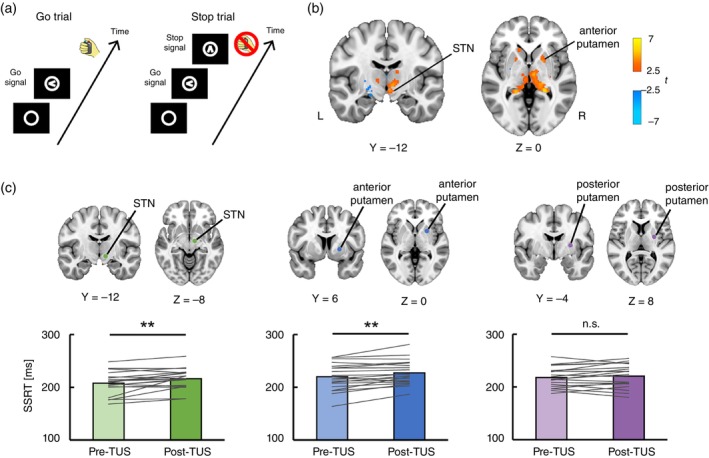
Low-intensity focused transcranial ultrasound stimulation (TUS) is an emerging noninvasive technique capable of stimulating both the cerebral cortex and deep brain structures with high spatial precision. This method is recognized for its potential to comprehensively perturb various brain regions, enabling the modulation of neural circuits, in a manner not achievable through conventional magnetic or electrical brain stimulation techniques. The underlying mechanisms of neuromodulation are based on a phenomenon where mechanical waves of ultrasound kinetically interact with neurons, specifically affecting neuronal membranes and mechanosensitive channels. This interaction induces alterations in the excitability of neurons within the stimulated region. In this review, we briefly present the fundamental principles of ultrasound physics and the physiological mechanisms of TUS neuromodulation. We explain the experimental apparatus and procedures for TUS in humans. Due to the focality, the integration of various methods, including magnetic resonance imaging and magnetic resonance-guided neuronavigation systems, is important to perform TUS experiments for precise targeting. We then review the current state of the literature on TUS neuromodulation, with a particular focus on human subjects, targeting both the cerebral cortex and deep subcortical structures. Finally, we outline future perspectives of TUS in clinical applications in psychiatric and neurological fields.
Keywords: low‐intensity focused ultrasound; neuromodulation; noninvasive brain stimulation; transcranial ultrasound stimulation.
© 2024 The Authors. Psychiatry and Clinical Neurosciences published by John Wiley & Sons Australia, Ltd on behalf of Japanese Society of Psychiatry and Neurology.
Figures
Similar articles
-
Non-invasive transcranial ultrasound stimulation for neuromodulation.Clin Neurophysiol. 2022 Mar;135:51-73. doi: 10.1016/j.clinph.2021.12.010. Epub 2021 Dec 31. Clin Neurophysiol. 2022. PMID: 35033772 Review.
-
Modelling transcranial ultrasound neuromodulation: an energy-based multiscale framework.Acta Biomater. 2022 Oct 1;151:317-332. doi: 10.1016/j.actbio.2022.07.034. Epub 2022 Jul 25. Acta Biomater. 2022. PMID: 35902037
-
Multi-modal investigation of transcranial ultrasound-induced neuroplasticity of the human motor cortex.Brain Stimul. 2022 Nov-Dec;15(6):1337-1347. doi: 10.1016/j.brs.2022.10.001. Epub 2022 Oct 11. Brain Stimul. 2022. PMID: 36228977
-
A practical guide to transcranial ultrasonic stimulation from the IFCN-endorsed ITRUSST consortium.Clin Neurophysiol. 2025 Mar;171:192-226. doi: 10.1016/j.clinph.2025.01.004. Epub 2025 Jan 28. Clin Neurophysiol. 2025. PMID: 39933226 Review.
-
Biophysical effects and neuromodulatory dose of transcranial ultrasonic stimulation.Brain Stimul. 2025 May-Jun;18(3):659-664. doi: 10.1016/j.brs.2025.02.019. Epub 2025 Mar 5. Brain Stimul. 2025. PMID: 40054576 Review.
Cited by
-
Multiple insular-prefrontal pathways underlie perception to execution during response inhibition in humans.Nat Commun. 2024 Dec 3;15(1):10380. doi: 10.1038/s41467-024-54564-9. Nat Commun. 2024. PMID: 39627197 Free PMC article.
-
Mechanobiological insight into brain diseases based on mechanosensitive channels: Common mechanisms and clinical potential.CNS Neurosci Ther. 2024 Jun;30(6):e14809. doi: 10.1111/cns.14809. CNS Neurosci Ther. 2024. PMID: 38923822 Free PMC article. Review.
-
Neuromodulation Strategies in Lifelong Bipolar Disorder: A Narrative Review.Behav Sci (Basel). 2024 Dec 8;14(12):1176. doi: 10.3390/bs14121176. Behav Sci (Basel). 2024. PMID: 39767317 Free PMC article. Review.
References
-
- Logothetis NK. What we can do and what we cannot do with fMRI. Nature 2008; 453: 869–878. - PubMed
-
- Finn ES, Poldrack RA, Shine JM. Functional neuroimaging as a catalyst for integrated neuroscience. Nature 2023; 623: 263–273. - PubMed
-
- Polanía R, Nitsche MA, Ruff CC. Studying and modifying brain function with non‐invasive brain stimulation. Nat. Neurosci. 2018; 21: 174–187. - PubMed
-
- Bergmann TO, Hartwigsen G. Inferring causality from noninvasive brain stimulation in cognitive neuroscience. J. Cogn. Neurosci. 2021; 33: 195–225. - PubMed
Publication types
MeSH terms
Grants and funding
LinkOut - more resources
Full Text Sources
