. 2024 Aug;18(8):1904-1922.
doi: 10.1002/1878-0261.13619. Epub 2024 Mar 20.

Combining VPS34 inhibitors with STING agonists enhances type I interferon signaling and anti-tumor efficacy

Affiliations

Combining VPS34 inhibitors with STING agonists enhances type I interferon signaling and anti-tumor efficacy

Yasmin Yu et al. Mol Oncol. 2024 Aug.

Abstract

An immunosuppressive tumor microenvironment promotes tumor growth and is one of the main factors limiting the response to cancer immunotherapy. We have previously reported that inhibition of vacuolar protein sorting 34 (VPS34), a crucial lipid kinase in the autophagy/endosomal trafficking pathway, decreases tumor growth in several cancer models, increases infiltration of immune cells and sensitizes tumors to anti-programmed cell death protein 1/programmed cell death 1 ligand 1 therapy by upregulation of C-C motif chemokine 5 (CCL5) and C-X-C motif chemokine 10 (CXCL10) chemokines. The purpose of this study was to investigate the signaling mechanism leading to the VPS34-dependent chemokine increase. NanoString gene expression analysis was applied to tumors from mice treated with the VPS34 inhibitor SB02024 to identify key pathways involved in the anti-tumor response. We showed that VPS34 inhibitors increased the secretion of T-cell-recruitment chemokines in a cyclic GMP-AMP synthase (cGAS)/stimulator of interferon genes protein (STING)-dependent manner in cancer cells. Both pharmacological and small interfering RNA (siRNA)-mediated VPS34 inhibition increased cGAS/STING-mediated expression and secretion of CCL5 and CXCL10. The combination of VPS34 inhibitor and STING agonist further induced cytokine release in both human and murine cancer cells as well as monocytic or dendritic innate immune cells. Finally, the VPS34 inhibitor SB02024 sensitized B16-F10 tumor-bearing mice to STING agonist treatment and significantly improved mice survival. These results show that VPS34 inhibition augments the cGAS/STING pathway, leading to greater tumor control through immune-mediated mechanisms. We propose that pharmacological VPS34 inhibition may synergize with emerging therapies targeting the cGAS/STING pathway.

Keywords: STING; autophagy; cancer; immunotherapy; interferons.


Conflict of interest statement

YY, SP, LT, CS, JL, JV, MA, JM, and ADM are employees/shareholders of Sprint Bioscience. MB, JS, MJT, HA, BDS, and DLF are employees/shareholders of Deciphera Pharmaceuticals. The other authors declare no potential conflicts of interest.

Figures

Fig. 1
Fig. 1
Identification of SB02024 as a potent and selective inhibitor of VPS34. (A) Chemical structure of SB02024. (B) Cartoon representation of the structure of complex between VPS34ΔC2 and SB02024. The N‐, C‐lobes, and helical domains of VPS34ΔC2 are colored in yellow, pink, and light cyan, respectively. The hinge region, P‐loop, and activation loop are colored in green, blue, and red, respectively. SB02024 is displayed as sticks with its carbon atoms colored orange. SB02024 location in VPS34ΔC2 active site is pinpointed by a black arrow. (C) SB02024 binding‐site with color code as in panel B. SB02024, protein sidechain, and main‐chain atoms involved in interactions with SB02024 are displayed as sticks. Water molecules interacting with SB02024 are shown as red spheres. Hydrogen bonds are represented by green dashes. The molecular surface and a slice through the molecular surface are colored in gray. The structures in panels B and C were generated using pymol (The PyMOL Molecular Graphics System, Version 2.5; Schrödinger, LLC, New York, NY, USA). (D) Potency of SB02024 in a biochemical assay. VPS34 enzyme was incubated with different concentrations of SB02024 and IC50 was determined. The dose–response curve shows an average of two representative experiments of n = 12 independent experiments. (E) Potency of SB02024 in NanoBRET assay. HEK293T cells transfected with VPS34 incubated with different concentrations of SB02024 and IC50 were determined. The dose–response curve shows a representative experiment of n = 4 independent experiments. mBU, milliBRET units. (F) Key SB02024 physiochemical and absorption, distribution, metabolism, and excretion (ADME) properties. CYP, cytochrome P450; FaSSIF, fasted state simulated intestinal fluid; Hep, hepatocyte; LogD, distribution coefficient; Papp, apparent permeability coefficient; PK, pharmacokinetics; PPB, plasma protein binding; PXR, pregnane X receptor; SGF, simulated gastric fluid; Vd, volume of distribution.
Fig. 2
Fig. 2
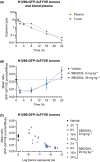
Pharmacokinetic and ‐dynamic profile of SB02024. (A–C) H1299 cells expressing GFP‐2xFVYE were subcutaneously implanted in NOD.Cg‐Prkdc scid Il2rg tm1Sug /JicTac mice. Mice were administered with one dose of vehicle (n = 6), 9 mg·kg−1 (n = 18) or 29 mg·kg−1 (n = 18) of SB02024 by oral gavage. (A) Concentration of SB02024 in blood plasma (green) and tumor tissue (purple) of n = 3 mice at indicated time points after one dose of 29 mg·kg−1. (B) Quantification VPS34 activity in tumors at indicated timepoints and dose as measured by anti‐GFP staining of GFP‐2xFYVE puncta using immunohistochemistry. Data represent mean ratio ± SD of n = 3 mice per time point for SB02024 treatment and n = 6 mice for vehicle treatment (plotted for reference at t = 0 h). The dotted line indicates signal mean for vehicle control animal. (C) Correlation of GFP‐2xFYVE puncta and SB02024 concentration in each individual tumor at indicated time point and dose as compared to vehicle control tumors.
Fig. 3
Fig. 3
VPS34i treatment increases an anti‐tumor immune response via IFN signaling in vivo. (A) Quantification of CCL5 and CXCL10 protein levels in the blood plasma of Renca tumor‐bearing BALB/c mice treated with control vehicle (n = 6) or 20 mg·kg−1 SB02024 (n = 8) using Mesoscale Discovery assays. (B) NanoString gene signature analysis for immune cell types in Renca tumors treated with either control vehicle (vehicle, n = 6) or 20 mg·kg−1 SB02024 (n = 7). NK, natural killer. (A, B) Graphs represent mean ± SEM. *P < 0.05; **P < 0.01 using an unpaired two‐tailed Student's t‐test. (C–G) NEA was carried out using NanoString gene expression data. One‐way ANOVA test was performed with FDR < 0.1 as a cut‐off threshold for statistical significance. (C) Heatmap showing log(signed chi) values for enrichment of NanoString gene signatures for immune pathways. Blue, low enrichment; red, high enrichment. JAK, janus kinase; MAPK, mitogen‐activated protein kinase; NF, nuclear factor; PI3K, phosphoinositide 3‐kinase; TGF, transforming growth factor. (D–G) Boxplots showing log(signed chi) values for enrichment of (D) KEGG pathways involved in cytokine signaling (mmu04060, mmu04062), (E) GO terms related to interferon signaling (go0060337, go0060333), (F) a gene signature for ICB sensitivity in Renca published by Zemek et al. [25], and (G) reactome pathway for STING signaling (r‐mmu‐1834941).
Fig. 4
Fig. 4
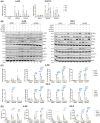
VPS34 inhibition triggers type I IFN signaling in a cGAS/STING‐dependent manner in vitro. (A) Quantification of IFNB1, IRF1, IRF7, and IRF9 gene expression after treatment with DMSO control or 2 μm of VPS34 inhibitor (= VPS34i, SB02024 or SAR405) for 24 h in A‐498 or B16‐F10 cells using qRT‐PCR. Bars represent mean ± SEM of three independent experiments. (B–D) A498 or 786‐O cells were transfected with scrambled siRNA control (siSCR) or siRNA targeting TBK1 (siTBK1), STING (siSTING) or CGAS (siCGAS) for 48 h and then treated as in panel A. (B) Western blot images showing expression of indicated proteins. Upper and lower blot for each cell line were derived from the same lysate and performed simultaneously. Blots are representative of three independent experiments. (C) Quantification of IFNB1, IRF7, CCL5, or CXCL10 gene expression using qRT‐PCR. Bars represent mean ± SEM of four (siSCR) or three (siTBK1, siSTING, siCGAS) independent experiments. (D) Quantification of CCL5 or CXCL10 secretion in media supernatant using mesoscale discovery assays. Bars represent mean ± SEM of four (siSCR) or three (siTBK1, siSTING, siCGAS) independent experiments. *P < 0.05; **P < 0.01; ***P < 0.001; ****P < 0.0001 using one‐way ANOVA followed by Dunnett's (A) or Šidák multiple comparison test (C, D; black asterisks indicate comparison to DMSO‐treated siSCR control and blue to indicated VPS34i‐treated siSCR control).
Fig. 5
Fig. 5
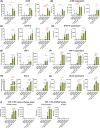
VPS34 inhibitors synergize with the STING agonist ADU‐S100 in vitro. (A) Quantification of IFNB1, CCL5, and CXCL10 gene expression using qRT‐PCR and (B) secreted IFNβ, CCL5, and CXCL10 using Mesoscale Discovery (MSD) assays in A‐498 cells treated with DMSO control, 2 μm SB02024 or SAR405 in combination with 50 μm STING agonist ADU‐S100 for 24 h. Bars represent mean ± SEM of three independent experiments. (C) Quantification of Ifnb1, Ccl5, and Cxcl10 gene expression using qRT‐PCR and (D) secreted CCL5 and CXCL10 using MSD assays in B16‐F10 cells treated with DMSO control, 2 μm SB02024 or SAR405 in combination with 5 μm ADU‐S100 for 24 h. Bars represent mean ± SEM of three independent experiments (in (C) four independent experiments were run for SB02024/ADI100 combo). (E) Quantification of IFNB1, CCL5, and CXCL10 gene expression using qRT‐PCR and (F) secreted IFNβ, CCL5, and CXCL10 using ELISA assays in THP‐1 cells treated with DMSO control, 2 μm SB02024 or SAR405 in combination with 50 μm ADU‐S100 for 24 h. Bars represent mean ± SEM of three independent experiments. (G) Quantification of Ifnb1, Ccl5, and Cxcl10 gene expression using qRT‐PCR and (H) secreted IFNβ, CCL5, and CXCL10 using ELISA assays in DC2.4 cells treated with DMSO control, 2 μm SB02024 or SAR405 in combination with 10 μm ADU‐S100 for 24 h. Bars represent mean ± SEM of three independent experiments. (I) THP‐1 reporter cells (STING present or knockout) were treated with DMSO, 2 μm of VPS34 inhibitor (SB02024 or SAR405) in combination with 5 μg·mL−1 ADU‐S100 for 24 h. Interferon‐stimulated response element (ISRE) or NFκB signal was read out via luciferase or secreted embryonic alkaline phosphatase (SEAP), respectively. Bars represent mean ± SEM of four independent experiments. *P < 0.05; **P < 0.01; ***P < 0.001; ****P < 0.0001 using one‐way ANOVA followed by Dunnett's (black asterisks indicating comparison to DMSO‐treated control) or Šidák multiple comparison test (red asterisks indicating comparison of the combination treatment to the more effective single treatment).
Fig. 6
Fig. 6
SB02024 potentiates the response to STING agonist in tumor‐bearing mice. (A–C) B16‐F10 cells were subcutaneously implanted in C57BL/6 mice. Mice were injected intratumorally with PBS or 10 μg STING agonist ADU‐S100 (on days 9, 11, 13, and 15) in combination with daily oral administration of vehicle or 20 mg·kg−1 SB02024 by gavage starting from day 7 to day 16 after implantation. (A) Dosing schematic and tumor growth curves of n = 15 mice per treatment group. Percent tumor growth inhibition was calculated compared to vehicle control. (B) Tumor weight of n = 10 mice per treatment group sacrificed on day 17. (C) Mice survival of n = 5 mice per treatment group. Lack of survival was defined as death or tumor size > 1000 mm3. Data represent mean ± SEM. *P < 0.05; **P < 0.01; ***P < 0.001; ****P < 0.0001 using one‐way ANOVA followed by Šidák multiple comparison test. Survival percentage was defined using graphpad prism, and P values were calculated using the log‐rank (Mantel‐Cox) test.

References

    1. Galluzzi L, Bravo‐San Pedro JM, Levine B, Green DR, Kroemer G. Pharmacological modulation of autophagy: therapeutic potential and persisting obstacles. Nat Rev Drug Discov. 2017;16(7):487–511. - PMC - PubMed
    1. Amaravadi R, Kimmelman AC, White E. Recent insights into the function of autophagy in cancer. Genes Dev. 2016;30(17):1913–1930. - PMC - PubMed
    1. Degenhardt K, Mathew R, Beaudoin B, Bray K, Anderson D, Chen G, et al. Autophagy promotes tumor cell survival and restricts necrosis, inflammation, and tumorigenesis. Cancer Cell. 2006;10(1):51–64. - PMC - PubMed
    1. Wei H, Wei S, Gan B, Peng X, Zou W, Guan JL. Suppression of autophagy by FIP200 deletion inhibits mammary tumorigenesis. Genes Dev. 2011;25(14):1510–1527. - PMC - PubMed
    1. Poillet‐Perez L, Sharp DW, Yang Y, Laddha SV, Ibrahim M, Bommareddy PK, et al. Autophagy promotes growth of tumors with high mutational burden by inhibiting a T‐cell immune response. Nat Cancer. 2020;1(9):923–934. - PMC - PubMed