4-octyl itaconate alleviates cisplatin-induced ferroptosis possibly via activating the NRF2/HO-1 signalling pathway
- PMID: 38506087
- PMCID: PMC10951885
- DOI: 10.1111/jcmm.18207
4-octyl itaconate alleviates cisplatin-induced ferroptosis possibly via activating the NRF2/HO-1 signalling pathway
Abstract
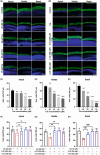
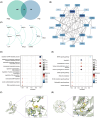
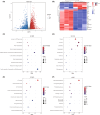
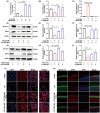
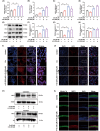
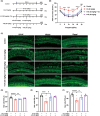
Ferroptosis, characterized by iron-dependent lipid reactive oxygen species (ROS) accumulation, plays a pivotal role in cisplatin-induced ototoxicity. Existing research has suggested that in cisplatin-mediated damage to auditory cells and hearing loss, ferroptosis is partially implicated. 4-Octyl itaconate (4-OI), derived from itaconic acid, effectively permeates cell membranes, showcasing potent anti-inflammatory as well as antioxidant effects in several disease models. Our study aimed to investigate the effect of 4-OI on cisplatin-induced ferroptosis and the underlying molecular mechanisms. The survival rates of HEI-OC1 cells and mice cochlea hair cells were measured by CCK8 and immunofluorescence, respectively. The auditory brainstem response (ABR) audiometry was used to detect changes in hearing thresholds in mice before and after treatment. Levels of ROS were evaluated by DCFH-DA. Real-time PCR quantified inflammatory cytokines TNF-α, IL-6 and IL-1β. Network Pharmacology and RNA sequencing (RNA-seq) analysis of the potential mechanism of 4-OI resistance to cisplatin-induced ferroptosis. The expressions of ferroptosis-related factors (GPX4, SLC7A11 and PTGS2) and important antioxidant factors (NRF2, HO-1, GCLC and NQO1) were tested by real-time PCR, Western blot and immunofluorescence. Results demonstrated cisplatin-induced significant ROS and inflammatory factor release, reduced NRF2 expression, hindered nuclear translocation and activated ferroptosis. Pretreatment with 4-OI exhibited anti-inflammatory and antioxidant effects, along with resistance to ferroptosis, ultimately mitigating cisplatin-induced cell loss. In the present study, we show that 4-OI inhibits cisplatin-induced ferroptosis possibly through activation of the NRF2/HO-1 signalling pathway, thereby exerting a protective effect against cisplatin-induced damage to auditory cells, and providing a new therapeutic strategy for cisplatin-induced hearing loss.
Keywords: 4-octyl itaconate; NRF2; cisplatin; ferroptosis; ototoxicity.
© 2024 The Authors. Journal of Cellular and Molecular Medicine published by Foundation for Cellular and Molecular Medicine and John Wiley & Sons Ltd.
Conflict of interest statement
The authors declare that they have no conflict of interest.
Figures



Similar articles
-
4-Octyl Itaconate Activates Nrf2 Signaling to Inhibit Pro-Inflammatory Cytokine Production in Peripheral Blood Mononuclear Cells of Systemic Lupus Erythematosus Patients.Cell Physiol Biochem. 2018;51(2):979-990. doi: 10.1159/000495400. Epub 2018 Nov 22. Cell Physiol Biochem. 2018. PMID: 30466076
-
Nrf2 Knockout Affected the Ferroptosis Signaling Pathway against Cisplatin-Induced Hair Cell-Like HEI-OC1 Cell Death.Oxid Med Cell Longev. 2022 Jul 1;2022:2210733. doi: 10.1155/2022/2210733. eCollection 2022. Oxid Med Cell Longev. 2022. PMID: 35814275 Free PMC article.
-
Erdosteine protects HEI-OC1 auditory cells from cisplatin toxicity through suppression of inflammatory cytokines and induction of Nrf2 target proteins.Toxicol Appl Pharmacol. 2015 Oct 15;288(2):192-202. doi: 10.1016/j.taap.2015.07.014. Epub 2015 Jul 18. Toxicol Appl Pharmacol. 2015. PMID: 26193055
-
Astragaloside IV regulates the ferroptosis signaling pathway via the Nrf2/SLC7A11/GPX4 axis to inhibit PM2.5-mediated lung injury in mice.Int Immunopharmacol. 2022 Nov;112:109186. doi: 10.1016/j.intimp.2022.109186. Epub 2022 Sep 15. Int Immunopharmacol. 2022. PMID: 36115280 Review.
-
Nrf2-mediated ferroptosis inhibition: a novel approach for managing inflammatory diseases.Inflammopharmacology. 2024 Oct;32(5):2961-2986. doi: 10.1007/s10787-024-01519-7. Epub 2024 Aug 10. Inflammopharmacology. 2024. PMID: 39126567 Review.
Cited by
-
Targeting Ferroptosis: Small-molecule Inducers as Novel Anticancer Agents.Anticancer Agents Med Chem. 2025;25(8):517-532. doi: 10.2174/0118715206342278241008081126. Anticancer Agents Med Chem. 2025. PMID: 39411969 Review.
-
[Experimental study on promotion of peripheral nerve regeneration by selenium-methylselenocysteine].Zhongguo Xiu Fu Chong Jian Wai Ke Za Zhi. 2024 May 15;38(5):598-607. doi: 10.7507/1002-1892.202402031. Zhongguo Xiu Fu Chong Jian Wai Ke Za Zhi. 2024. PMID: 38752248 Free PMC article. Chinese.
-
Antioxidant Intervention Against Microplastic Hazards.Antioxidants (Basel). 2025 Jun 27;14(7):797. doi: 10.3390/antiox14070797. Antioxidants (Basel). 2025. PMID: 40722901 Free PMC article. Review.
-
Apoptosis, autophagy, ferroptosis, and pyroptosis in cisplatin-induced ototoxicity and protective agents.Front Pharmacol. 2024 Sep 24;15:1430469. doi: 10.3389/fphar.2024.1430469. eCollection 2024. Front Pharmacol. 2024. PMID: 39380912 Free PMC article. Review.
-
Targeting Programmed Cell Death in Acquired Sensorineural Hearing Loss: Ferroptosis, Necroptosis, and Pyroptosis.Neurosci Bull. 2025 Jun;41(6):1085-1102. doi: 10.1007/s12264-025-01370-y. Epub 2025 Apr 22. Neurosci Bull. 2025. PMID: 40261527 Free PMC article. Review.
References
-
- Nieman CL, Oh ES. Hearing loss. Ann Intern Med. 2020;17311:ITC81‐ITC96. - PubMed
-
- Schaake‐Koning C, van den Bogaert W, Dalesio O, et al. Effects of concomitant cisplatin and radiotherapy on inoperable non‐small‐cell lung cancer. N Engl J Med. 1992;3268:524‐530. - PubMed
-
- Armstrong DK, Bundy B, Wenzel L, et al. Intraperitoneal cisplatin and paclitaxel in ovarian cancer. N Engl J Med. 2006;3541:34‐43. - PubMed
-
- Hager S, Ackermann CJ, Joerger M, Gillessen S, Omlin A. Anti‐tumour activity of platinum compounds in advanced prostate cancer‐a systematic literature review. Ann Oncol. 2016;276:975‐984. - PubMed
Publication types
MeSH terms
Substances
Grants and funding
LinkOut - more resources
Full Text Sources
Research Materials
Miscellaneous

