. 2024 May 6;221(5):e20232148.
doi: 10.1084/jem.20232148. Epub 2024 Mar 20.

Dietary fiber is a critical determinant of pathologic ILC2 responses and intestinal inflammation

Collaborators, Affiliations

Dietary fiber is a critical determinant of pathologic ILC2 responses and intestinal inflammation

Mohammad Arifuzzaman et al. J Exp Med. .

Abstract

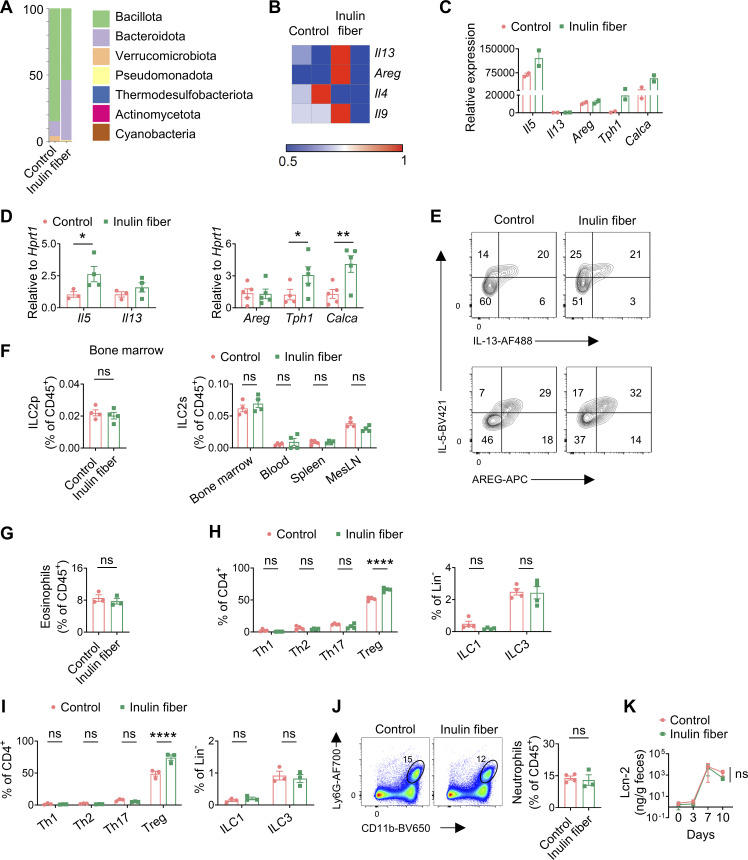
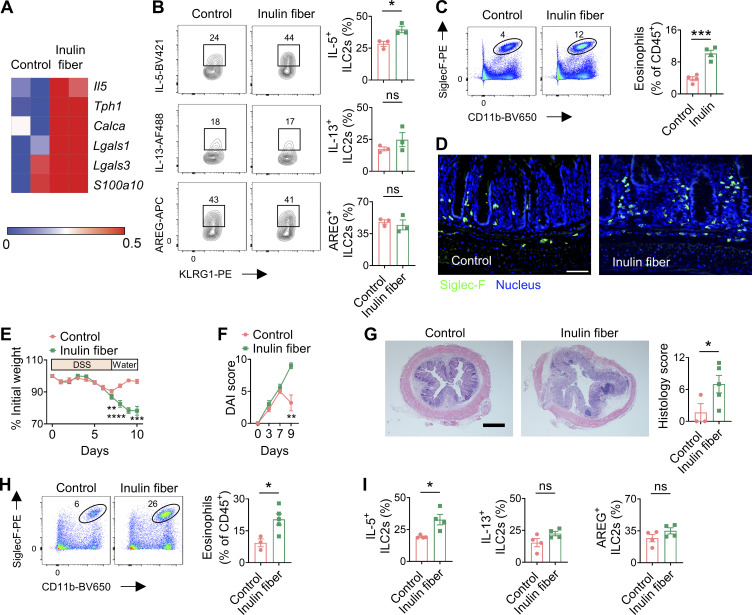
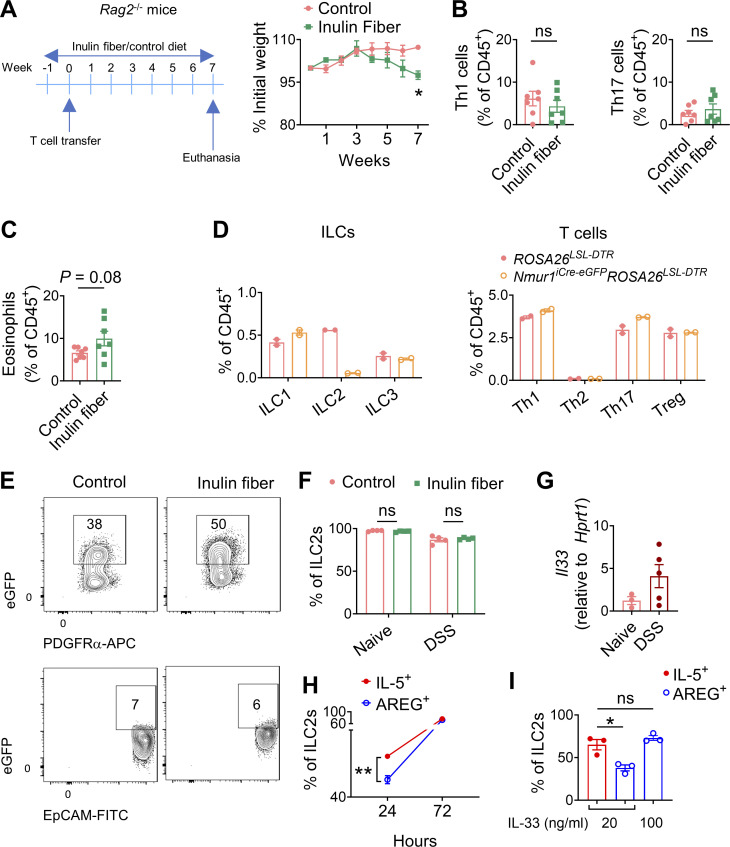
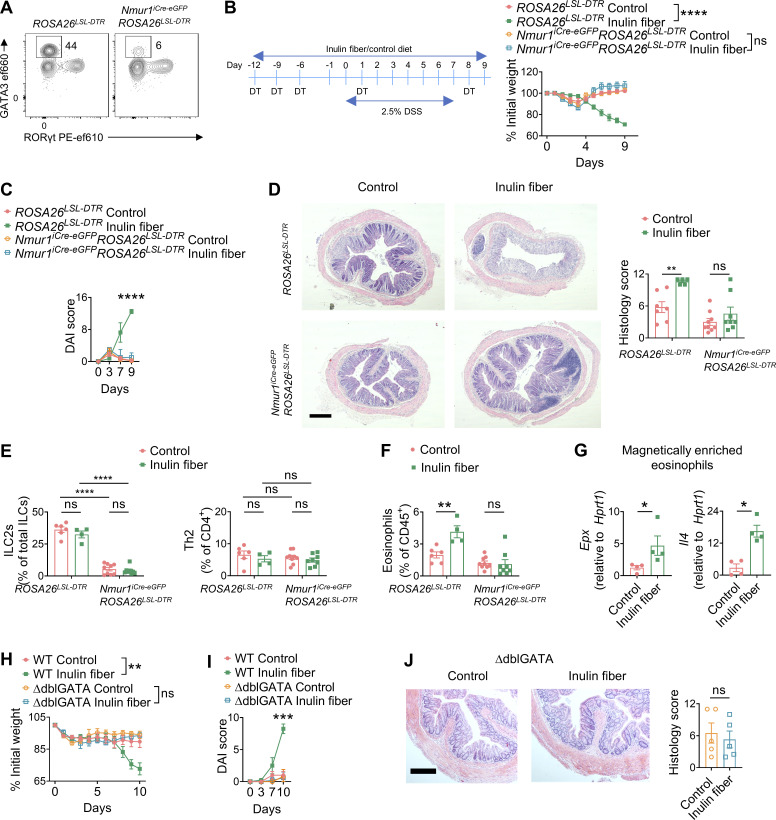
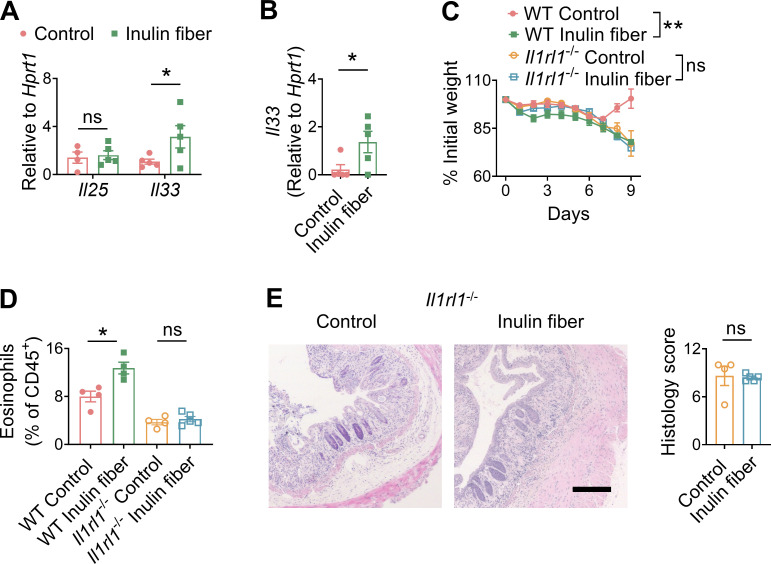
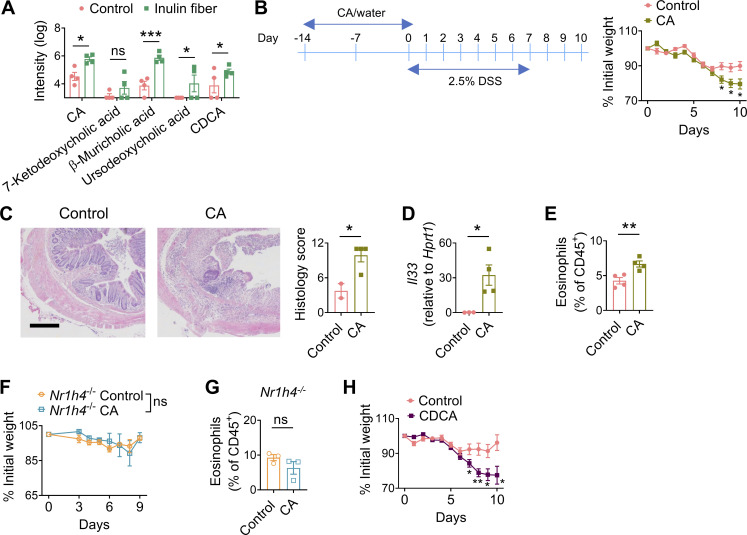
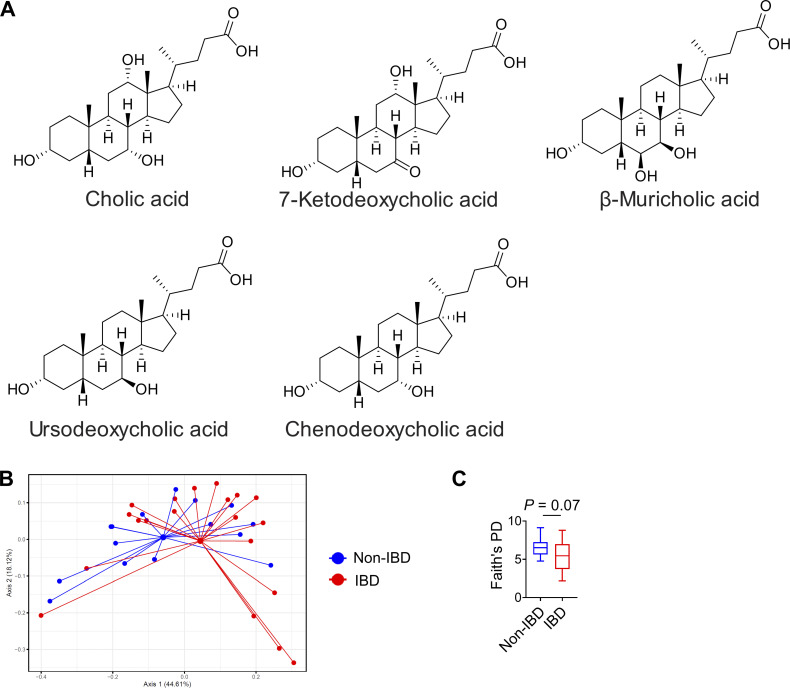
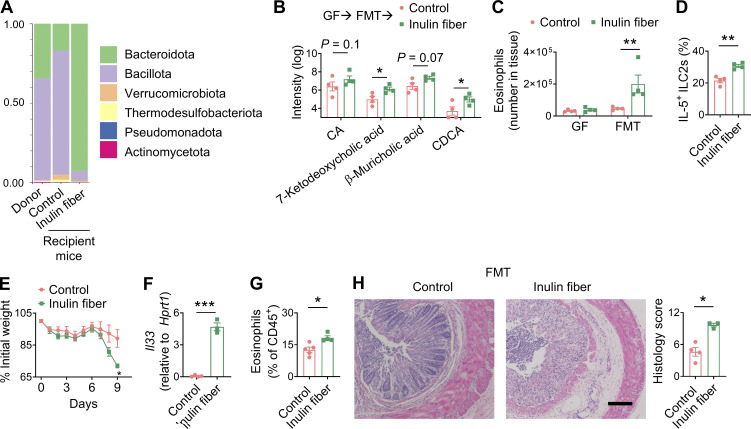
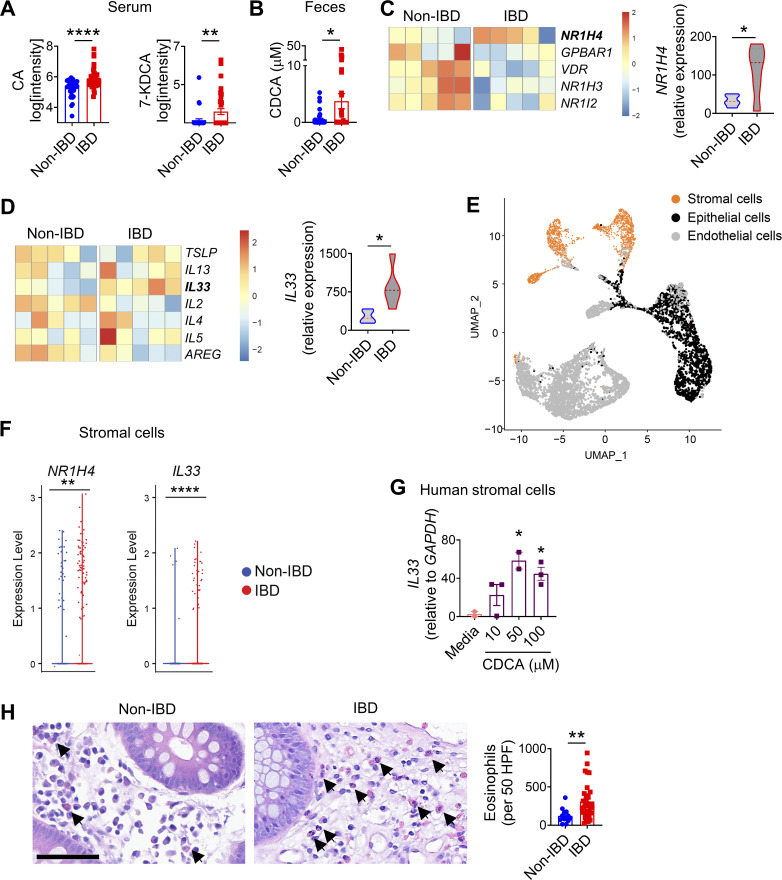
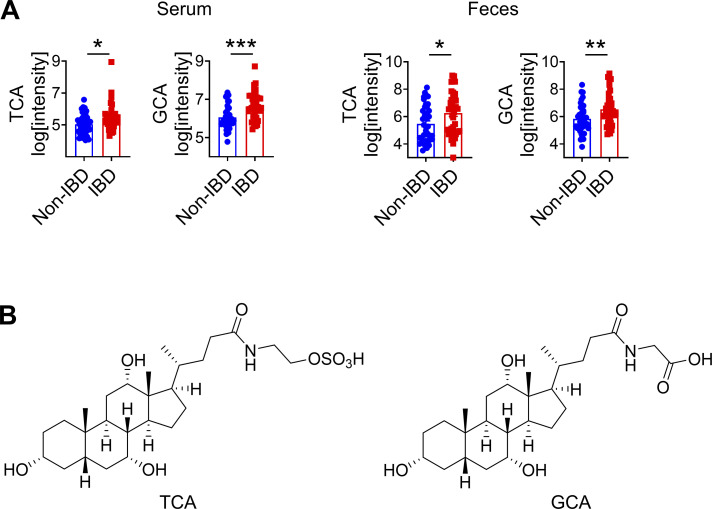
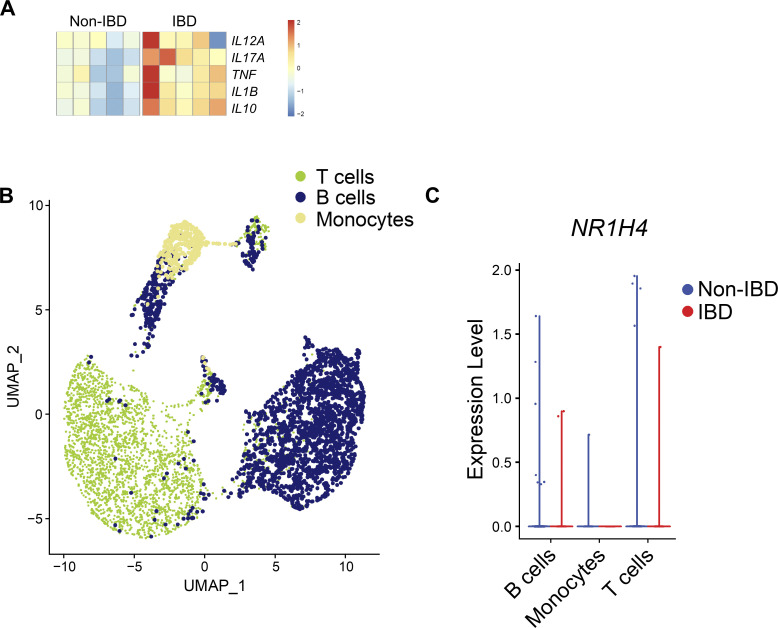
Innate lymphoid cells (ILCs) can promote host defense, chronic inflammation, or tissue protection and are regulated by cytokines and neuropeptides. However, their regulation by diet and microbiota-derived signals remains unclear. We show that an inulin fiber diet promotes Tph1-expressing inflammatory ILC2s (ILC2INFLAM) in the colon, which produce IL-5 but not tissue-protective amphiregulin (AREG), resulting in the accumulation of eosinophils. This exacerbates inflammation in a murine model of intestinal damage and inflammation in an ILC2- and eosinophil-dependent manner. Mechanistically, the inulin fiber diet elevated microbiota-derived bile acids, including cholic acid (CA) that induced expression of ILC2-activating IL-33. In IBD patients, bile acids, their receptor farnesoid X receptor (FXR), IL-33, and eosinophils were all upregulated compared with controls, implicating this diet-microbiota-ILC2 axis in human IBD pathogenesis. Together, these data reveal that dietary fiber-induced changes in microbial metabolites operate as a rheostat that governs protective versus pathologic ILC2 responses with relevance to precision nutrition for inflammatory diseases.


Conflict of interest statement

Disclosures: C.-J. Guo reported grants from NIH and the Kenneth Rainin Foundation during the conduct of the study (NIH grants 1DP2HD101401-01, DK135816-01, the Kenneth Rainin Foundation). F.C. Schroeder reported personal fees from Ascribe Bioscience and other from Holoclara outside the submitted work. D. Artis reported personal fees from Pfizer and the Rainin Foundation outside the submitted work. No other disclosures were reported.

Figures

Figure S1.
Figure S1.
Microbial and immunological parameters in mice upon exposure to inulin fiber diet and DSS. (A) Representative taxonomic classification of 16S rRNA genes in fecal suspension from mice fed with control or inulin fiber diet for 2 wk. (B) Heatmap showing gene expression of colonic ILC2s in mice fed the control or inulin fiber diet (n = 2 mice). (C) Expression levels of various genes determined by RNA-seq of sorted ILC2s (n = 2 mice). (D) Expression levels of various genes determined by RT-qPCR of sorted ILC2s (n = 3–5 mice). (E) Representative flow cytometry plots showing co-expression of IL-5 and IL-13 (top panels) and IL-5 and AREG (bottom panels) in the colonic ILC2s. (F) Frequency of ILC2 progenitor cells (ILC2p) in the bone marrow and ILC2s in various tissues of mice fed with control or inulin fiber diet for 2 wk (n = 4 mice). (G) Frequency of colonic eosinophils in mice fed with control or inulin fiber diet for 2 wk and then regular chow for 4 wk (n = 3 mice). (H) Frequency of various T cells and ILCs in the colons of mice fed with control or inulin fiber diet for 2 wk (n = 4 mice). (I) Frequency of various T cells and ILCs in the colons of mice at the endpoint after DSS treatment (n = 3 mice). (J) Representative flow cytometry plots and frequency of CD11b+Ly6G+ neutrophils in colons of mice treated with DSS (n = 3–4 mice). (K) Levels of fecal lipocalin-2 (Lcn-2) in DSS-treated mice measured by ELISA (n = 5 mice). Data are representative of two independent experiments (A and D–K). Data are means ± SEM. Statistics were calculated by unpaired two-tailed t test (F, G, J, and K) or two-way ANOVA with uncorrected Fisher’s LSD test (D, H, and I). *P < 0.05, **P < 0.01, ****P < 0.0001, ns, not significant.
Figure 1.
Figure 1.
Inulin fiber diet activates ILC2INFLAM and exacerbates intestinal damage and inflammation. (A) Heatmap showing differential gene expression of colonic ILC2s in mice fed the control or inulin fiber diet for 2 wk (n = 2 mice). (B) Frequency of IL-5–expressing, IL-13–expressing, or AREG-expressing KLRG1+ ILC2s in colonic lamina propria, determined by intracellular cytokine staining (n = 3 mice). Flow cytometry plots were gated from CD45+LinCD90.2+CD127+ cells. (C) Representative flow cytometry plots and frequency of CD11b+SiglecF+ eosinophils in the CD45+ population (n = 4 mice). (D) Representative immunofluorescence staining showing Siglec-F+ eosinophils in the colons. Scale bar = 50 μm. (E and F) Disease and recovery of DSS-treated control diet– and inulin fiber diet–fed mice were monitored by daily weight loss (E) and DAI (F). Mice were fed control or inulin fiber diet from 2 wk prior to the DSS challenge to the endpoint of the experiment (n = 5 mice). (G) Representative H&E staining of distal colons at the endpoint of the DSS experiment. Scale bar = 500 μm. Graph shows histological scores (n = 3–5 mice). (H) Representative flow cytometry plots and frequency of CD11b+SiglecF+ eosinophils in the CD45+ population (n = 3–5 mice). (I) Frequency of IL-5–expressing, IL-13–expressing, or AREG-expressing KLRG1+ ILC2s in colonic lamina propria, determined by intracellular cytokine staining (n = 4 mice). Data are representative of three (C and E–G) or two (B, D, H, and I) independent experiments. Data are means ± SEM. Statistics were calculated by unpaired two-tailed t test. *P < 0.05, **P < 0.01, ***P < 0.001, ****P < 0.0001, ns, not significant.
Figure S2.
Figure S2.
Immune profiling related to T cell transfer colitis, ILC2 depletion and IL-33 treatment. (A) Experimental schematic and body weights in a T cell transfer model of colitis (n = 3–4 mice). (B and C) Frequency of T-bet+ Th1 and RORγt+ Th17 cells (B) and eosinophils (C) in the colon in a T cell transfer model of colitis (n = 7). (D) Colonic levels of various immune cells in DT-treated mice (n = 2). (E) Representative flow cytometry plots showing IL33-eGFP expression in epithelial (EpCAM+) and stromal (PDGFRα+) cell subsets in the colons of mice fed with control or inulin fiber diet for 2 wk. (F) Frequency of ST2+ ILC2s in the colons of mice after 2 wk of diets (naïve) or after 2 wk of diets followed by DSS treatment and recovery (DSS) (n = 4 mice). (G) Expression of Il33 in the colons of naïve or DSS-treated mice on a control diet (n = 3–5 mice). (H and I) ILC2s sorted from mouse colons were plated at a density of 5,000 cells per well in a 96-well round-bottom plate in complete medium with 100 ng/ml IL-2, 100 ng/ml IL-7, and various concentrations of IL-33. Graphs show frequencies of IL-5+ ILC2s and AREG+ ILC2s at various time points after incubation with 20 ng/ml IL-33 (H) and at 72 h after incubation with various concentrations of IL-33 (I). Data are representative of A and D–I or pooled from B and C two independent experiments. Data are means ± SEM. Statistics were calculated by unpaired two-tailed t test. *P < 0.05, **P < 0.01, ns, not significant.
Figure 2.
Figure 2.
ILC2s and eosinophils mediate the exacerbation of intestinal damage by the inulin fiber diet. (A) Representative flow cytometry plots showing depletion of ILC2s 4 wk after intraperitoneal injections with 100 ng/mouse DT on days 0, 3, 6, 14, and 21. (B and C) Experimental schematic and body weights (B) and DAI (C) of DSS-treated mice (n = 4–5 mice). (D) Representative H&E staining of distal colons of DSS-treated mice (scale bar = 500 μm), and histology scores at the endpoint (day 9) (n = 5–9 mice). (E and F) Frequency of ILC2s and GATA3+ Th2 cells (E) and eosinophils (F) in the colon of the DSS-treated mice at the endpoint (n = 4–9 mice). (G) Gene expression in magnetically enriched colonic eosinophils determined by RT-qPCR from mice fed with control or inulin fiber diet for 2 wk (n = 4 mice). (H–J) Body weights (H) and DAI (I) on various days and colon histology at the endpoint (J) in DSS-treated mice fed with control or inulin fiber diet (n = 4–9 mice). Scale bar = 200 μm. Data are representative of (A–C and G) or pooled from (D–F and H) two independent experiments. Data are means ± SEM. Statistics were calculated by unpaired two-tailed t test (C, I, and J) or two-way ANOVA with Tukey’s multiple comparison test (B and H) or uncorrected Fisher’s LSD test (D–F) or Mann–Whitney U test (G). *P < 0.05, **P < 0.01, ***P < 0.001, ****P < 0.0001, ns, not significant.
Figure 3.
Figure 3.
IL-33 is required for inulin fiber diet–induced colonic eosinophilia. (A) Gene expression in the distal colon was determined by RT-qPCR analysis of mice fed with control or inulin fiber diet for 2 wk (n = 4–5 mice). (B) Expression of Il33 in the distal colon of mice at the endpoint (day 9) after challenge with DSS. (C–E) Body weights (C) and colonic eosinophil levels (D) and histology scores (E) at the endpoint in DSS-treated mice fed with control or inulin fiber diet (n = 4–5 mice). Scale bar = 200 μm. Data are representative of two independent experiments. Data are means ± SEM. Statistics were calculated by unpaired two-tailed t test (A, B, D, and E) or two-way ANOVA with Tukey’s multiple comparison test (C). *P < 0.05, **P < 0.01, ns, not significant.
Figure 4.
Figure 4.
Administration of bile acids worsens DSS-induced disease severity. (A) Bile acid levels were measured by LC-MS in the serum of mice after feeding with a control or inulin fiber diet for 2 wk (n = 4 mice). Peak integration data from HPLC-MS analysis were log-transformed (Karpievitch et al., 2012) prior to statistical analysis. (B) Experimental schematic and body weights of DSS-treated mice under control (water) and CA treatment groups (n = 7–9 mice). (C) Representative H&E staining of distal colons at the endpoint of DSS experiment (day 10), Scale bar = 200 μm. Graph shows histological scores (n = 2–4 mice). (D–E) Expression of Il33 (D) and frequency of eosinophils (E) in the colons of DSS-treated mice at the endpoint (n = 3–4 mice). (F) Body weights of DSS-treated Nr1h4−/− mice under control (water) and CA-treated groups (n = 3 mice). (G) Frequency of eosinophils in the colons of mice at the endpoint of DSS experiment (n = 3 mice). (H) Body weights of DSS-treated mice under control (water) and CDCA treatment groups (n = 8–9 mice). Data are pooled from (B and H) or representative of (A and C–G) two independent experiments. Data are means ± SEM. Statistics were calculated by unpaired two-tailed t test. *P < 0.05, **P < 0.01, ***P < 0.001, ns, not significant.
Figure S3.
Figure S3.
Chemical structures of bile acids and analyses of human fecal microbial composition. (A) Chemical structures of differential unconjugated bile acids identified in mouse serum. (B and C) Weighted UniFrac PCoA of 16S rRNA (B) and Faith’s phylogenic diversity (PD) (C) in fecal samples from non-IBD controls and IBD patients (n = 15–20 humans). For PCoA plot PERMANOVA: F = 12.6, Df = 1, P = 0.09. Statistics were calculated by unpaired two-tailed t test with Welch’s correction (C).
Figure 5.
Figure 5.
Human FMT can reproduce inulin fiber diet–induced eosinophilia and intestinal damage. (A) Representative taxonomic classification of 16S rRNA genes in fecal suspension from individual human donor or stool pellets collected from recipient mice with human microbiota on control or inulin fiber diet for 2 wk. (B–D) Serum bile acids (B), colonic eosinophils (C), and colonic IL-5+ ILC2s (D) in the recipient mice (n = 4) after 2 wk of diet. (E) Body weights of DSS-treated control diet– and inulin fiber diet–fed human FMT mice (n = 4 mice). (F and G) Expression of Il33 (F) and frequency of eosinophils (G) in the colon of DSS-treated human FMT mice at the endpoint (day 9) (n = 3–5 mice). (H) Representative H&E staining and histology scores of distal colons at the endpoint (day 9) of the DSS experiment. Scale bar = 100 μm. Data are representative of two independent experiments. Data are means ± SEM. Statistics were calculated by unpaired two-tailed t test (D–H) or two-way ANOVA with uncorrected Fisher’s LSD test (B and C). *P < 0.05, **P < 0.01, ***P < 0.001.
Figure 6.
Figure 6.
The bile acid–eosinophil axis is dysregulated in IBD. (A and B) Serum (A) and fecal (B) levels of unconjugated bile acids (n = 37–40 humans). (C) Heatmap showing bile acid receptor genes and the violin plot showing NR1H4 expression in the colon biopsies of non-IBD controls and IBD patients (n = 5 humans). (D) Heatmap showing type 2 cytokine genes and the violin plot showing IL33 expression in the colons of non-IBD controls and IBD patients (n = 5 humans). (E) UMAP plot of scRNA-seq data of non-IBD control and IBD patient colons. (F) Violin plots showing expression of NR1H4 and IL33 in the stromal cells shown in E. (G) IL33 gene expression in human colonic cell line CCD-18Co determined by RT-qPCR after 4 h incubation with increasing concentrations of CDCA (n = 2–3 replicates). Data are representative of two independent experiments. (H) Representative H&E staining of human colorectal tissues (scale bar = 60 μm). Bar plot shows the number of eosinophils in 50 high power fields (HPF) in the colons of non-IBD controls (n = 13) and IBD patients (n = 35). Data are means ± SEM. Statistics were calculated by unpaired two-tailed t test (A–E, F, and H) or one-way ANOVA with Dunnett’s multiple comparisons test (G). *P < 0.05, **P < 0.01, ****P < 0.0001.
Figure S4.
Figure S4.
Analyses of metabolites in human serum and fecal samples. (A) Serum and fecal levels of conjugated bile acids (n = 37–40 humans). (B) Chemical structures of TCA and GCA. Data are means ± SEM. Statistics were calculated by unpaired two-tailed t test (A). *P < 0.05, **P < 0.01, ***P < 0.001.
Figure S5.
Figure S5.
Analyses of human intestinal transcriptional profile. (A) Heatmap showing type 1/3 cytokine genes in non-IBD controls and IBD patients (n = 5 humans). (B) UMAP plot of scRNA-seq data of non-IBD control and IBD patient colons. (C) Violin plot showing expression of NR1H4 in various immune cell clusters in B.

References

    1. Ahrens, R., Waddell A., Seidu L., Blanchard C., Carey R., Forbes E., Lampinen M., Wilson T., Cohen E., Stringer K., et al. 2008. Intestinal macrophage/epithelial cell-derived CCL11/eotaxin-1 mediates eosinophil recruitment and function in pediatric ulcerative colitis. J. Immunol. 181:7390–7399. 10.4049/jimmunol.181.10.7390 - DOI - PMC - PubMed
    1. Alexander, M., and Turnbaugh P.J.. 2020. Deconstructing mechanisms of diet-microbiome-immune interactions. Immunity. 53:264–276. 10.1016/j.immuni.2020.07.015 - DOI - PMC - PubMed
    1. Ananthakrishnan, A.N. 2015. Epidemiology and risk factors for IBD. Nat. Rev. Gastroenterol. Hepatol. 12:205–217. 10.1038/nrgastro.2015.34 - DOI - PubMed
    1. Arifuzzaman, M., Won T.H., Li T.T., Yano H., Digumarthi S., Heras A.F., Zhang W., Parkhurst C.N., Kashyap S., Jin W.B., et al. 2022. Inulin fibre promotes microbiota-derived bile acids and type 2 inflammation. Nature. 611:578–584. 10.1038/s41586-022-05380-y - DOI - PMC - PubMed
    1. Armstrong, H.K., Bording-Jorgensen M., Santer D.M., Zhang Z., Valcheva R., Rieger A.M., Sung-Ho Kim J., Dijk S.I., Mahmood R., Ogungbola O., et al. 2022. Unfermented beta-fructan fibers fuel inflammation in select inflammatory bowel disease patients. Gastroenterology. 164:228–240. 10.1053/j.gastro.2022.09.034 - DOI - PubMed