Clinical Trial
. 2024 Jun 3;30(11):2412-2423.
doi: 10.1158/1078-0432.CCR-23-3940.

Phase I Trial of Viral Vector-Based Personalized Vaccination Elicits Robust Neoantigen-Specific Antitumor T-Cell Responses

Affiliations
Clinical Trial

Phase I Trial of Viral Vector-Based Personalized Vaccination Elicits Robust Neoantigen-Specific Antitumor T-Cell Responses

Anna Morena D'Alise et al. Clin Cancer Res. .

Abstract

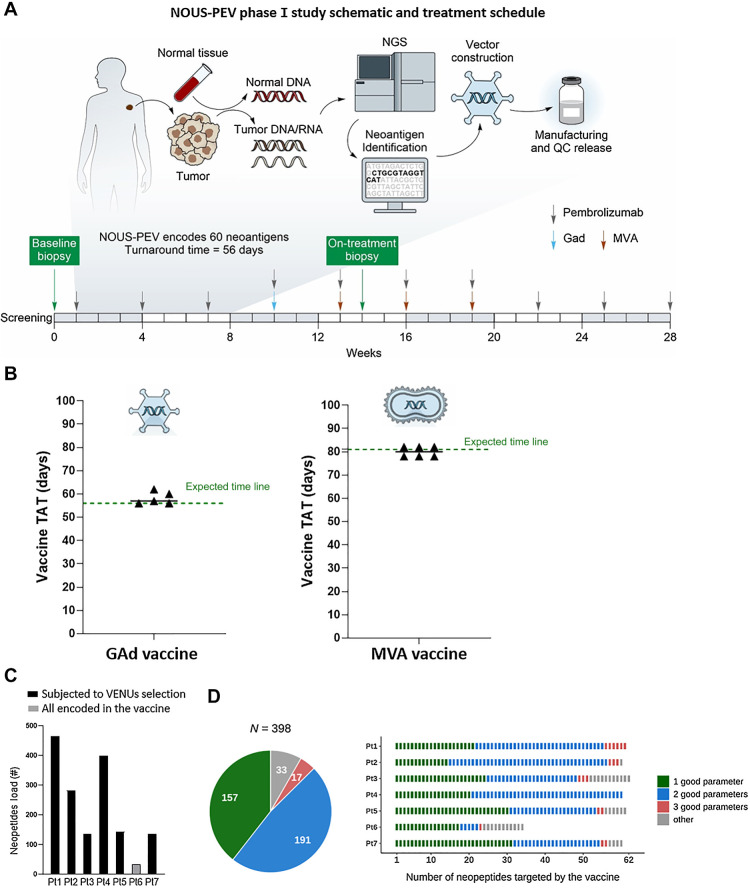
Purpose: Personalized vaccines targeting multiple neoantigens (nAgs) are a promising strategy for eliciting a diversified antitumor T-cell response to overcome tumor heterogeneity. NOUS-PEV is a vector-based personalized vaccine, expressing 60 nAgs and consists of priming with a nonhuman Great Ape Adenoviral vector (GAd20) followed by boosts with Modified Vaccinia Ankara. Here, we report data of a phase Ib trial of NOUS-PEV in combination with pembrolizumab in treatment-naïve patients with metastatic melanoma (NCT04990479).

Patients and methods: The feasibility of this approach was demonstrated by producing, releasing, and administering to 6 patients 11 of 12 vaccines within 8 weeks from biopsy collection to GAd20 administration.

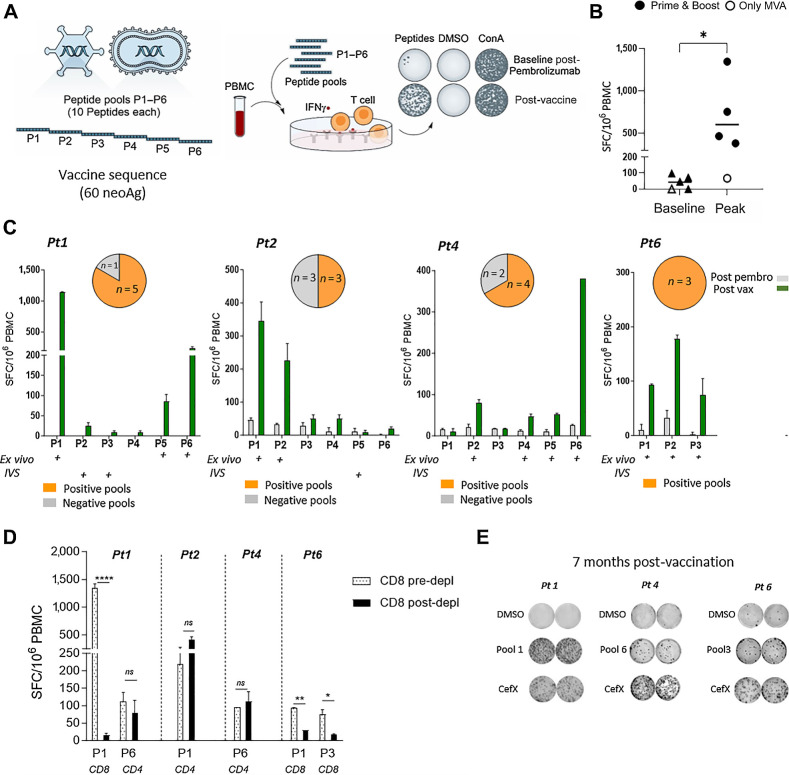
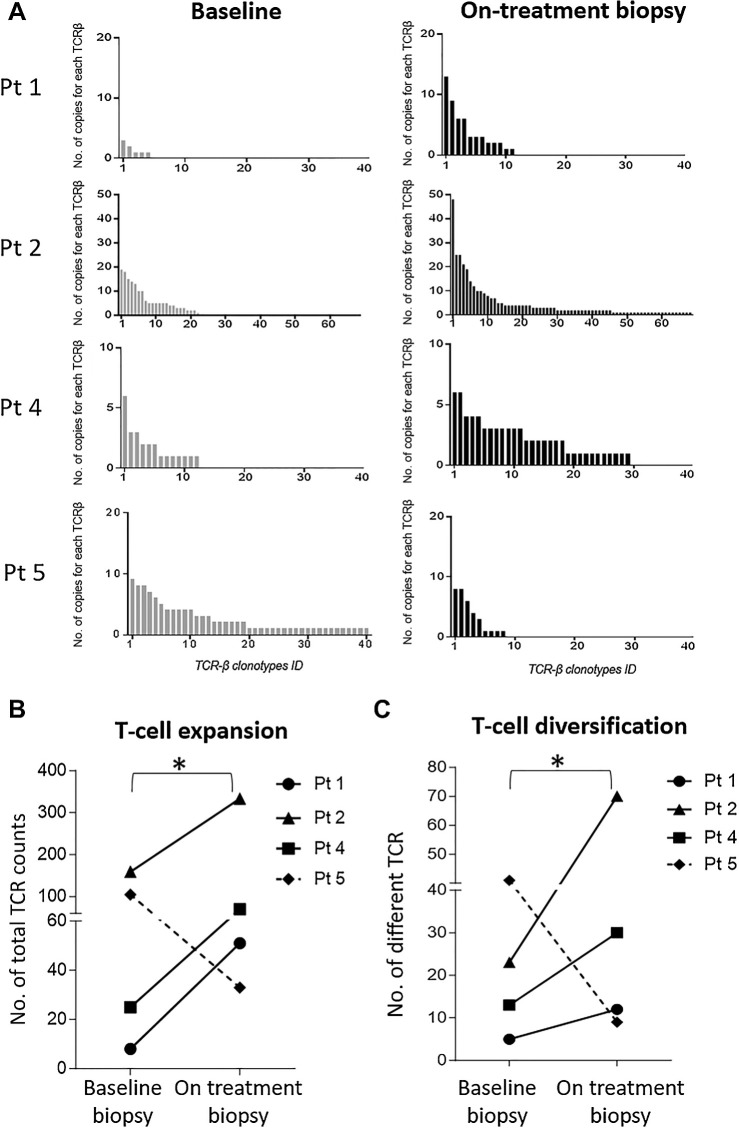
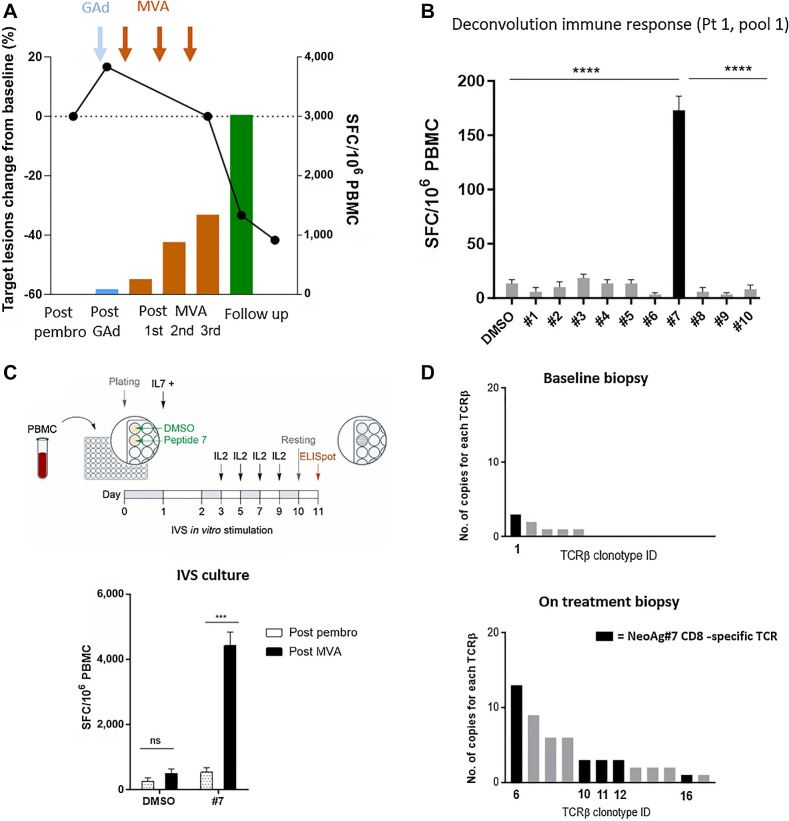
Results: The regimen was safe, with no treatment-related serious adverse events observed and mild vaccine-related reactions. Vaccine immunogenicity was demonstrated in all evaluable patients receiving the prime/boost regimen, with detection of robust neoantigen-specific immune responses to multiple neoantigens comprising both CD4 and CD8 T cells. Expansion and diversification of vaccine-induced T-cell receptor (TCR) clonotypes was observed in the posttreatment biopsies of patients with clinical response, providing evidence of tumor infiltration by vaccine-induced neoantigen-specific T cells.

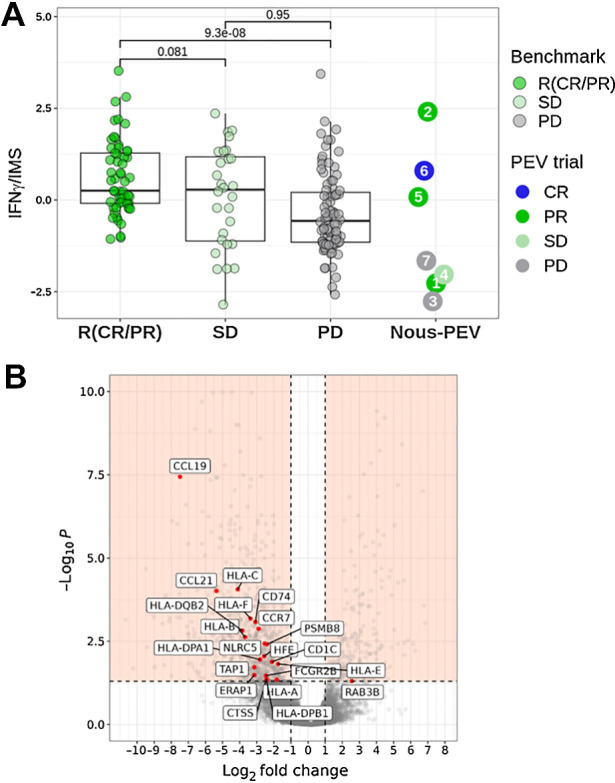
Conclusions: These findings indicate the ability of NOUS-PEV to amplify and broaden the repertoire of tumor-reactive T cells to empower a diverse, potent, and durable antitumor immune response. Finally, a gene signature indicative of the reduced presence of activated T cells together with very poor expression of the antigen-processing machinery genes has been identified in pretreatment biopsies as a potential biomarker of resistance to the treatment.


Figures

Figure 1. NOUS-PEV neoantigen vaccines: trial design, feasibility, and selection of encoded neoantigens. A, Schematic outlining the NOUS-PEV trial design, vaccine production, and treatment schedule. B, Achieved (triangles) and expected (green dotted line) turnaround time (TAT) to manufacture and release GAd20 and MVA-PEV. The TAT is calculated in days, from when the biopsy is available for the nucleic acid extraction till the day the vaccine is released. C, Total number of neopeptides detected in NOUS-PEV patients. Each bar represents the total number of neopeptides encoded by nonsynonymous somatic mutations detected in baseline tumor biopsies. Black and gray bars indicate the patients’ mutation subjected or not to VENUS prioritization algorithm, respectively. D, Quality of neopeptides included in NOUS-PEV. The pie chart displays the total number of candidate neopeptides targeted by NOUS-PEV. In green, blue, and salmon are indicated respectively, the selected neopeptides showing one, two, or three of the parameters defined “good” according to the following thresholds (TPM of the RNA carrying the mutation ≥1; MHC class I predicted binding IC50 ≤ 500 nmol/L; mutation allele frequency >50%). In gray are the other neopeptides not included in the previous three categories. The bar plot indicates the detail of candidate neopeptides for each individual patient.
Figure 1.
NOUS-PEV neoantigen vaccines: trial design, feasibility, and selection of encoded neoantigens. A, Schematic outlining the NOUS-PEV trial design, vaccine production, and treatment schedule. B, Achieved (triangles) and expected (green dotted line) turnaround time (TAT) to manufacture and release GAd20 and MVA-PEV. The TAT is calculated in days, from when the biopsy is available for the nucleic acid extraction till the day the vaccine is released. C, Total number of neopeptides detected in NOUS-PEV patients. Each bar represents the total number of neopeptides encoded by nonsynonymous somatic mutations detected in baseline tumor biopsies. Black and gray bars indicate the patients’ mutation subjected or not to VENUS prioritization algorithm, respectively. D, Quality of neopeptides included in NOUS-PEV. The pie chart displays the total number of candidate neopeptides targeted by NOUS-PEV. In green, blue, and salmon are indicated respectively, the selected neopeptides showing one, two, or three of the parameters defined “good” according to the following thresholds (TPM of the RNA carrying the mutation ≥1; MHC class I predicted binding IC50 ≤ 500 nmol/L; mutation allele frequency >50%). In gray are the other neopeptides not included in the previous three categories. The bar plot indicates the detail of candidate neopeptides for each individual patient.
Figure 2. NOUS-PEV elicits a potent neoantigen T-cell response. A, Schematic overview of ex vivo IFNγ ELISpot assay to measure immune response on PBMCs stimulated with 6 patient-specific peptide pools P1 to P6 (∼10 peptides per pool) covering the entire vaccine sequence. B, T-cell response measured in NOUS-PEV–vaccinated patients by ex vivo IFNγ ELISpot on PBMCs collected pre- and post-vaccination. Numbers of IFNγ spot-forming cells (SFC) per 106 PBMCs are shown for 4 patients receiving the full regimen GAd and MVA prime/boost (solid dots), and 1 receiving MVA-PEV (empty dot), comparing the baseline (post-pembrolizumab) responses versus the post-vaccination response at peak. Two-tailed Mann–Whitney test was performed (*, P < 0.05). C, T-cell response measured in NOUS-PEV evaluable patients receiving the full regimen GAd/MVA (Pt 1, 2, 4, 6). Shown are the ex vivo immune responses measured post-pembrolizumab versus the post-vaccine immune responses against the peptide pools (P1–P6) covering the entire vaccine sequence for 4 patients (Pt 1, 2, 4, 6). Graphs show mean SFC ± SEM per 106 PBMCs for triplicate ELISpot wells. Pools showing positive after ex vivo and in vitro restimulation (IVS) cultures are indicated with a “+” symbol. Pie charts on the top represent the frequency of peptide pools inducing CD8 and CD4 responses on the total pools eliciting a positive response by ex vivo/IVS ELISpot for each patient (NA, not available). D, Ex vivo IFNγ ELISpot on PBMCs before or after depletion of CD8+ T cells in the presence of patient-specific neopeptide pools. “CD4” and “CD8” indicate the subtype-specific CD4 and CD8 T-cell responses. An unpaired t test was used to detect significant differences between the groups (pre- and post-CD8 depletion); ****, P < 0.0001; **, P < 0.01; *, P < 0.05. E, Representative wells from IFNγ ELISpot assay of PBMCs analyzed 7 months post-vaccination. The dimethylsulfoxide (DMSO) wells represent the negative control, whereas a pool of viral peptides (CEFX) was used as positive control.
Figure 2.
NOUS-PEV elicits a potent neoantigen T-cell response. A, Schematic overview of ex vivo IFNγ ELISpot assay to measure immune response on PBMCs stimulated with 6 patient-specific peptide pools P1 to P6 (∼10 peptides per pool) covering the entire vaccine sequence. B, T-cell response measured in NOUS-PEV–vaccinated patients by ex vivo IFNγ ELISpot on PBMCs collected pre- and post-vaccination. Numbers of IFNγ spot-forming cells (SFC) per 106 PBMCs are shown for 4 patients receiving the full regimen GAd and MVA prime/boost (solid dots), and 1 receiving MVA-PEV (empty dot), comparing the baseline (post-pembrolizumab) responses versus the post-vaccination response at peak. Two-tailed Mann–Whitney test was performed (*, P < 0.05). C, T-cell response measured in NOUS-PEV evaluable patients receiving the full regimen GAd/MVA (Pt 1, 2, 4, 6). Shown are the ex vivo immune responses measured post-pembrolizumab versus the post-vaccine immune responses against the peptide pools (P1–P6) covering the entire vaccine sequence for 4 patients (Pt 1, 2, 4, 6). Graphs show mean SFC ± SEM per 106 PBMCs for triplicate ELISpot wells. Pools showing positive after ex vivo and in vitro restimulation (IVS) cultures are indicated with a “+” symbol. Pie charts on the top represent the frequency of peptide pools inducing CD8 and CD4 responses on the total pools eliciting a positive response by ex vivo/IVS ELISpot for each patient (NA, not available). D,Ex vivo IFNγ ELISpot on PBMCs before or after depletion of CD8+ T cells in the presence of patient-specific neopeptide pools. “CD4” and “CD8” indicate the subtype-specific CD4 and CD8 T-cell responses. An unpaired t test was used to detect significant differences between the groups (pre- and post-CD8 depletion); ****, P < 0.0001; **, P < 0.01; *, P < 0.05. E, Representative wells from IFNγ ELISpot assay of PBMCs analyzed 7 months post-vaccination. The dimethylsulfoxide (DMSO) wells represent the negative control, whereas a pool of viral peptides (CEFX) was used as positive control.
Figure 3. Increase of intratumoral T cells post-NOUS-PEV treatment with vaccine-induced T cells infiltrating tumor. A, Expansion and diversification of TCRβ repertoire in pre- and posttreatment tumor biopsies in four NOUS-PEV patients (3 PR;1 SD). Each bar indicates the abundance of individual TCRβ clones detected in the total tumor RNAs extracted from the biopsies collected at the two time points (details in Patients and Methods). B, Total number of TCRβ counts detected in tumor biopsies estimated by summing up the abundance of the individual clones reported in A. The solid lines represent NOUS-PEV patients receiving the full vaccine regimen GAd/MVA; the dashed line represents the patient (Pt 5) who only received MVA-PEV. C, Number of individual clones with different TCRβ CDR3 detected in the patients’ tumor biopsies (*, P ≤ 0.05, paired t test).
Figure 3.
Increase of intratumoral T cells post-NOUS-PEV treatment with vaccine-induced T cells infiltrating tumor. A, Expansion and diversification of TCRβ repertoire in pre- and posttreatment tumor biopsies in four NOUS-PEV patients (3 PR;1 SD). Each bar indicates the abundance of individual TCRβ clones detected in the total tumor RNAs extracted from the biopsies collected at the two time points (details in Patients and Methods). B, Total number of TCRβ counts detected in tumor biopsies estimated by summing up the abundance of the individual clones reported in A. The solid lines represent NOUS-PEV patients receiving the full vaccine regimen GAd/MVA; the dashed line represents the patient (Pt 5) who only received MVA-PEV. C, Number of individual clones with different TCRβ CDR3 detected in the patients’ tumor biopsies (*, P ≤ 0.05, paired t test).
Figure 4. Vaccine-induced neoantigen T cells migrate into the tumor. A, T-cell response assessed by ex vivo ELISpot versus percentage changes in target lesion size (sum of target lesion measurements evaluated per RECIST v1.1.) from baseline are displayed for NOUS-PEV Pt 1. B, Deconvolution of T-cell response by ex vivo ELISpot against individual peptides of the immunogenic pool 1. The immunogenic NeoAg7 is shown in black. The unpaired t test was used to make comparisons (****, P < 0.0001). C, Top, schematic representation of the IVS protocol to expand vaccine induced neoantigen specific T cells against NeoAg7 peptide. Bottom, T-cell responses in Pt 1 measured by IFNγ ELISpot assay after IVS with NeoAg7 peptide. Tested PBMCs were collected after pembrolizumab (week 10) and after vaccination (week 14). The unpaired t test was used to make comparisons (***, P < 0.001). D, Expansion and diversification of TCRβ repertoire in pre- and posttreatment tumor biopsies of Pt 1. Each bar is a TCRβ individual clone; the clonotypes specific for NeoAg7 detected on the tumor biopsies of Pt 1 are shown as black bars.
Figure 4.
Vaccine-induced neoantigen T cells migrate into the tumor. A, T-cell response assessed by ex vivo ELISpot versus percentage changes in target lesion size (sum of target lesion measurements evaluated per RECIST v1.1.) from baseline are displayed for NOUS-PEV Pt 1. B, Deconvolution of T-cell response by ex vivo ELISpot against individual peptides of the immunogenic pool 1. The immunogenic NeoAg7 is shown in black. The unpaired t test was used to make comparisons (****, P < 0.0001). C, Top, schematic representation of the IVS protocol to expand vaccine induced neoantigen specific T cells against NeoAg7 peptide. Bottom, T-cell responses in Pt 1 measured by IFNγ ELISpot assay after IVS with NeoAg7 peptide. Tested PBMCs were collected after pembrolizumab (week 10) and after vaccination (week 14). The unpaired t test was used to make comparisons (***, P < 0.001). D, Expansion and diversification of TCRβ repertoire in pre- and posttreatment tumor biopsies of Pt 1. Each bar is a TCRβ individual clone; the clonotypes specific for NeoAg7 detected on the tumor biopsies of Pt 1 are shown as black bars.
Figure 5. Analysis of potential biomarkers predictive for antitumor response. A, Ratio of the IFNγ signature score to the IMS score predictive of PD-1 blockade (18) estimated according to RNASEQ gene expression values detected in pretreatment tumor biopsies. The values of the signature estimated in NOUS-PEV patients were compared with a dataset of 172 patients with melanoma (57 CR/PR; 28 SD; 87 PD) treated with anti-PD-1 monotherapy and retrieved from four published studies (18, 31–33). B, Volcano plot of differentially expressed genes detected by analyzing the RNASEQ of pretreatment biopsies of patients in progression (PD; n = 2) versus the ones collected from responder patients (n = 3; median log2 FC < −1 or >1; Benjamini–Hochberg corrected P value <0.05 according to a consensus of four different methods. Details in Patients and Methods). The plot highlights in red a subset of 21 antigen present machinery-related genes (APM) downregulated in NOUS-PEV PD patients.
Figure 5.
Analysis of potential biomarkers predictive for antitumor response. A, Ratio of the IFNγ signature score to the IMS score predictive of PD-1 blockade (18) estimated according to RNASEQ gene expression values detected in pretreatment tumor biopsies. The values of the signature estimated in NOUS-PEV patients were compared with a dataset of 172 patients with melanoma (57 CR/PR; 28 SD; 87 PD) treated with anti-PD-1 monotherapy and retrieved from four published studies (, 31–33). B, Volcano plot of differentially expressed genes detected by analyzing the RNASEQ of pretreatment biopsies of patients in progression (PD; n = 2) versus the ones collected from responder patients (n = 3; median log2 FC < −1 or >1; Benjamini–Hochberg corrected P value <0.05 according to a consensus of four different methods. Details in Patients and Methods). The plot highlights in red a subset of 21 antigen present machinery-related genes (APM) downregulated in NOUS-PEV PD patients.

References

    1. Rizvi NA, Hellmann MD, Snyder A, Kvistborg P, Makarov V, Havel JJ, et al. . Cancer immunology. Mutational landscape determines sensitivity to PD-1 blockade in non-small cell lung cancer. Science 2015;348:124–8. - PMC - PubMed
    1. Schumacher TN, Schreiber RD. Neoantigens in cancer immunotherapy. Science 2015;348:69–74. - PubMed
    1. Yarchoan M, Johnson BA 3rd, Lutz ER, Laheru DA, Jaffee EM. Targeting neoantigens to augment antitumour immunity. Nat Rev Cancer 2017;17:209–22. - PMC - PubMed
    1. Hu Z, Ott PA, Wu CJ. Towards personalized, tumour-specific, therapeutic vaccines for cancer. Nat Rev Immunol 2018;18:168–82. - PMC - PubMed
    1. Blass E, Ott PA. Advances in the development of personalized neoantigen-based therapeutic cancer vaccines. Nat Rev Clin Oncol 2021;18:215–29. - PMC - PubMed

Publication types

MeSH terms

Associated data

Grants and funding