Randomized Controlled Trial
. 2024 Mar;132(3):37006.
doi: 10.1289/EHP13225. Epub 2024 Mar 20.

Prenatal Household Air Pollution Exposure and Childhood Blood Pressure in Rural Ghana

Affiliations
Randomized Controlled Trial

Prenatal Household Air Pollution Exposure and Childhood Blood Pressure in Rural Ghana

Misbath Daouda et al. Environ Health Perspect. 2024 Mar.

Abstract

Background: The association between prenatal household air pollution (HAP) exposure and childhood blood pressure (BP) is unknown.

Objective: Within the Ghana Randomized Air Pollution and Health Study (GRAPHS) we examined time-varying associations between a) maternal prenatal and b) first-year-of-life HAP exposure with BP at 4 years of age and, separately, whether a stove intervention delivered prenatally and continued through the first year of life could improve BP at 4 years of age.

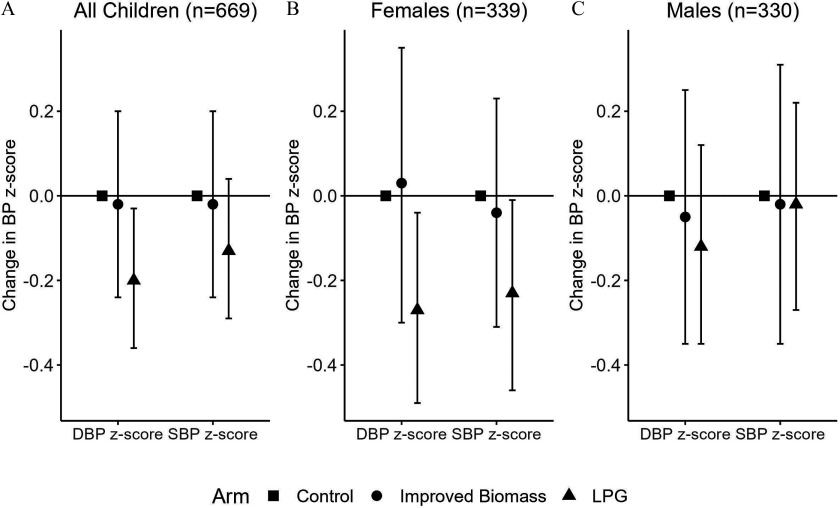
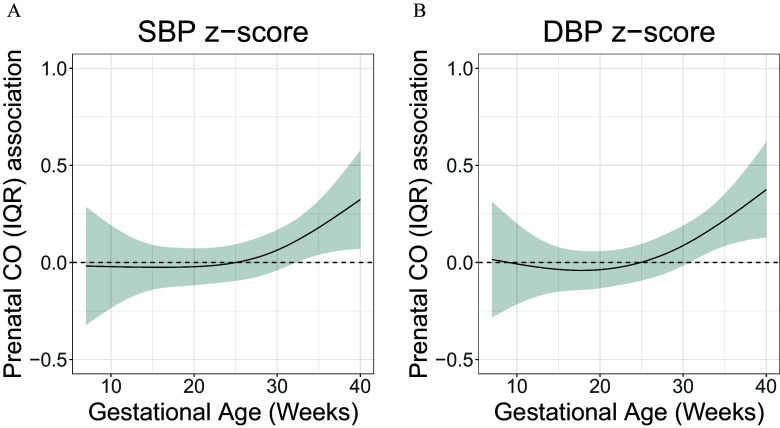
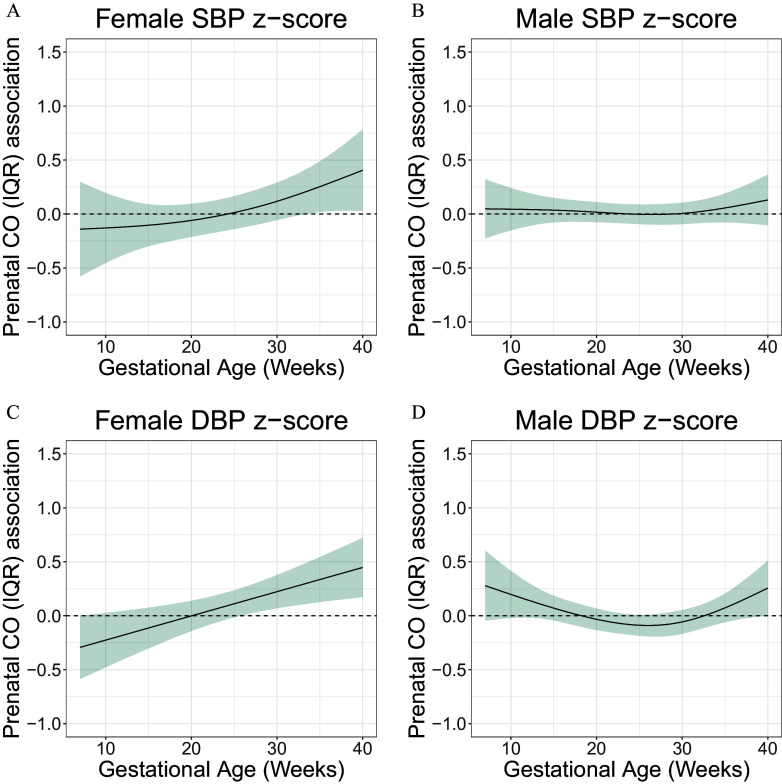
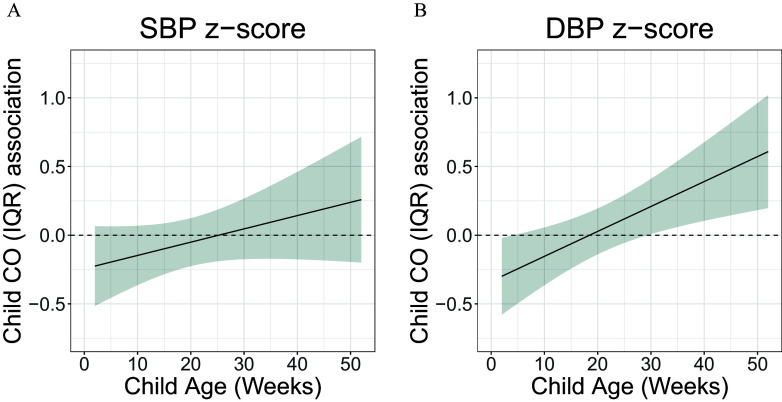
Methods: GRAPHS was a cluster-randomized cookstove intervention trial wherein n=1,414 pregnant women were randomized to one of two stove interventions: a) a liquefied petroleum gas (LPG) stove or improved biomass stove, or b) control (open fire cooking). Maternal HAP exposure over pregnancy and child HAP exposure over the first year of life was quantified by repeated carbon monoxide (CO) measurements; a subset of women (n=368) also performed one prenatal and one postnatal personal fine particulate matter (PM2.5) measurement. Systolic and diastolic BP (SBP and DBP) were measured in n=667 4-y-old children along with their PM2.5 exposure (n=692). We examined the effect of the intervention on resting BP z-scores. We also employed reverse distributed lag models to examine time-varying associations between a) maternal prenatal and b) first-year-of-life HAP exposure and resting BP z-scores. Among those with PM2.5 measures, we examined associations between PM2.5 and resting BP z-scores. Sex-specific effects were considered.

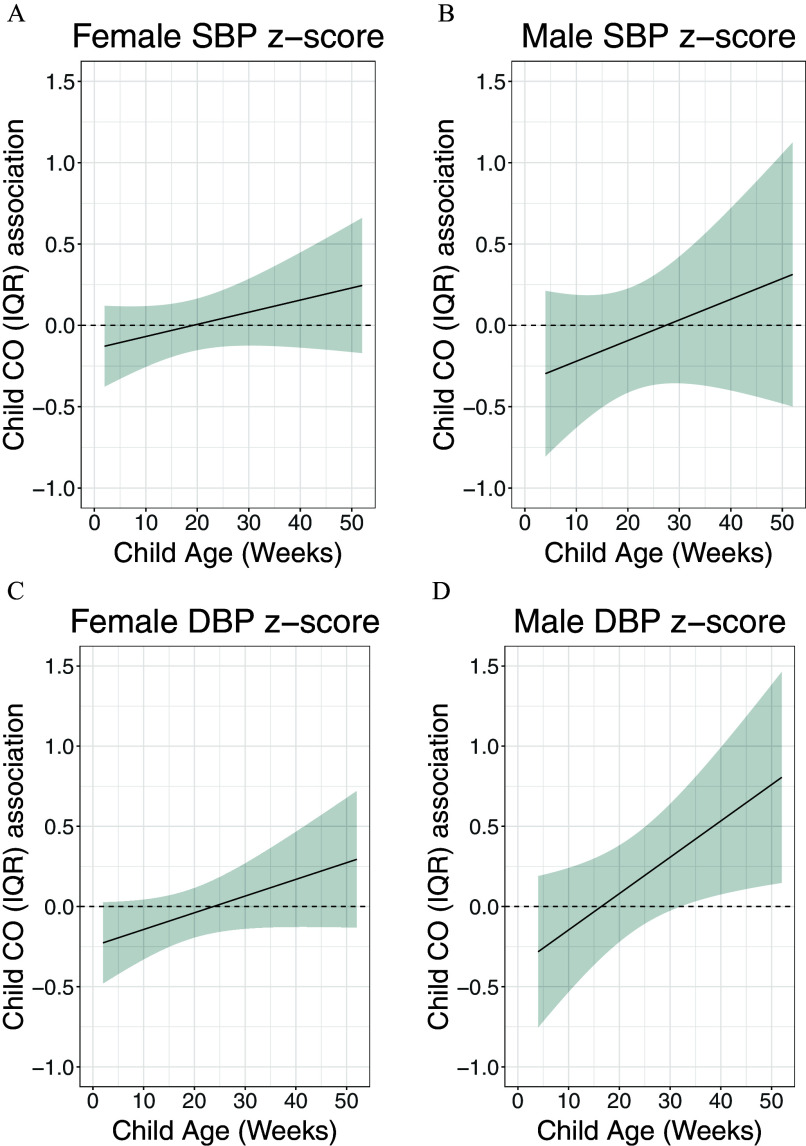
Results: Intention-to-treat analyses identified that DBP z-score at 4 years of age was lower among children born in the LPG arm (LPG β=-0.20; 95% CI: -0.36, -0.03) as compared with those in the control arm, and females were most susceptible to the intervention. Higher CO exposure in late gestation was associated with higher SBP and DBP z-score at 4 years of age, whereas higher late-first-year-of-life CO exposure was associated with higher DBP z-score. In the subset with PM2.5 measurements, higher maternal postnatal PM2.5 exposure was associated with higher SBP z-scores.

Discussion: These findings suggest that prenatal and first-year-of-life HAP exposure are associated with child BP and support the need for reductions in exposure to HAP, with interventions such as cleaner cooking beginning in pregnancy. https://doi.org/10.1289/EHP13225.


Figures

Figures 1A to 1C are point estimates and error bar graphs titled All children, Females, and Males, plotting Change in blood pressure lowercase z score, ranging from negative 0.4 to 0.2 in increments of 0.2 (y-axis) across Diastolic blood pressure lowercase z scores and Systolic blood pressure lowercase z score (x-axis) for Arm, Control, Improved biomass, and Liquefied petroleum gas, respectively.
Figure 1.
Systolic and diastolic blood pressure (SBP and DBP) z-scores by GRAPHS stove intervention arm. This figure shows the intention-to-treat associations between GRAPHS stove intervention arm and SBP and DBP z-scores at 4 years of age, using cluster-robust generalized linear regression models. In GRAPHS, pregnant women were randomized to open fire (control), liquefied petroleum gas (LPG), or improved biomass stoves that were supported over pregnancy and through the index child’s first year of life. Resting SBP and DBP were measured at the child age 4-y visit, 3 y after support for the intervention ended. The pinteraction term was only significant for DBP z-score in females in the improved biomass arm (pinteraction=0.03); all other pinteraction terms were >0.10. Numeric values can be found in Table S3. Note: GRAPHS, Ghana Randomized Air Pollution and Health Study; LPG, liquefied petroleum gas.
Figures 2A and 2B are ribbon plus line graphs titled Systolic blood pressure lowercase z score and Diastolic blood pressure lowercase z score, plotting Prenatal carbon monoxide (interquartile range) association with blood pressure, ranging from negative 0.5 to 1.0 in increments of 0.5 (y-axis) across Gestational age (weeks), ranging from 10 to 40 in increments of 10 (x-axis), respectively.
Figure 2.
Time-varying associations between prenatal household air pollution exposure, as represented by personal carbon monoxide (CO), and resting (A) systolic blood pressure (SBP) and (B) diastolic BP (DBP) z-scores at 4 years of age in the GRAPHS intervention study, Ghana. The multivariable model 1 (n=1,654 observations from n=640 children) adjusted for child sex and BMI; maternal ethnicity, secondhand tobacco smoke exposure and enrollment BP; and household asset index. The y-axis represents the time-varying association between BP z-score and an interquartile (IQR) increase in CO exposure; the x-axis depicts gestational age in weeks at CO measurement. The solid line shows the predicted estimate, and the shaded area represents the 95% CI. A sensitive window was identified when the CIs did not include zero. Data are included in Excel Table S1. Note: BMI, body mass index; CI, confidence interval; GRAPHS, Ghana Randomized Air Pollution and Health Study.
Figures 3A to 3D are ribbon plus line graphs titled Female systolic blood pressure lowercase z score, Male systolic blood pressure lowercase z score, Female diastolic blood pressure lowercase z score, and Male diastolic blood pressure lowercase z score, plotting Prenatal carbon monoxide (interquartile range) association, ranging from negative 1.0 to 1.5 in increments of 0.5 (y-axis) across Gestational age (weeks), ranging from 10 to 40 in increments of 10 (x-axis), respectively.
Figure 3.
Sex-specific associations between prenatal household air pollution exposure, as represented by personal maternal carbon monoxide (CO) measurements, and resting diastolic blood pressure (DBP) and systolic BP (SBP) at 4 years of age in children in the GRAPHS intervention study, Ghana. This figure demonstrates the association between maternal personal CO exposure measurements over pregnancy and SBP and DBP at 4 years of age assuming week-specific effects among females [(A,C) n=828 observations from n=321 children] and males [(B,D) n=826 observations from n=319 children]. The multivariable model 1 adjusted for child BMI; maternal ethnicity, secondhand tobacco smoke exposure, and enrollment BP; and household asset index. The y-axis represents the time-varying association between BP z-score and an interquartile (IQR) increase in CO exposure; the x-axis depicts gestational age in weeks at CO measurement. The solid line shows the predicted estimate, and the shaded area represents the 95% CI. A sensitive window was identified when the CIs did not include zero. Data are included in Excel Table S2. Note: BMI, body mass index; CI, confidence interval; GRAPHS, Ghana Randomized Air Pollution and Health Study.
Figures 4A and 4B are ribbon plus line graphs titled Systolic blood pressure lowercase z score and Diastolic blood pressure lowercase z score, plotting Child carbon monoxide (interquartile range) association with blood pressure, ranging from negative 0.5 to 1.0 in increments of 0.5 (y-axis) across Child age (weeks), ranging from 0 to 50 in increments of 10 (x-axis), respectively.
Figure 4.
Time-varying associations between child household air pollution exposure, as represented by maternal personal carbon monoxide (CO), and resting (A) systolic blood pressure (SBP) and (B) diastolic BP (DBP) z-scores at 4 years of age in children in the GRAPHS intervention study, Ghana. The multivariable model 1 (n=827 observations from n=520 children) adjusted for child sex and BMI; maternal ethnicity, secondhand tobacco smoke exposure, average prenatal CO exposure and enrollment BP; and household asset index. The y-axis represents the time-varying association between BP z-score and an interquartile (IQR) increase in CO exposure; the x-axis depicts gestational age in weeks at CO measurement. The solid line shows the predicted estimate, and the shaded area represents the 95% CI. A sensitive window was identified when the CIs did not include zero. Data are included in Excel Table S3. Note: BMI, body mass index; CI, confidence interval; GRAPHS, Ghana Randomized Air Pollution and Health Study.
Figures 5A to 5D are ribbon plus line graphs titled Female systolic blood pressure lowercase z score, Male systolic blood pressure lowercase z score, Female diastolic blood pressure lowercase z score, and Male diastolic blood pressure lowercase z score, plotting Child carbon monoxide (interquartile range) association with blood pressure, ranging from negative 1.0 to 1.5 in increments of 0.5 (y-axis) across Child age (weeks), ranging from 0 to 50 in increments of 10 (x-axis), respectively.
Figure 5.
Sex-specific associations between child household air pollution exposure, as represented by maternal personal carbon monoxide (CO), and resting diastolic BP (DBP) and systolic BP (SBP) at 4 years of age in children in the GRAPHS intervention study, Ghana. This figure demonstrates the association between child personal carbon monoxide exposure and SBP and DBP at 4 years of age assuming week-specific effects among [(A,C) females and (B,D) males, n=415 observations from n=262 children)]. The multivariable model 1 adjusted for child BMI; maternal ethnicity, secondhand tobacco smoke exposure, average prenatal CO exposure and enrollment BP; and household asset index. The y-axis represents the time-varying association between BP z-score and an interquartile (IQR) increase in CO exposure; the x-axis depicts gestational age in weeks at CO measurement. The solid line shows the predicted estimate, and the shaded area represents the 95% CI. A sensitive window was identified when the CIs did not include zero. Data are included in Excel Table S4. Note: BMI, body mass index; CI, confidence interval; GRAPHS, Ghana Randomized Air Pollution and Health Study.

References

    1. Chen X, Wang Y. 2008. Tracking of blood pressure from childhood to adulthood: a systematic review and meta-regression analysis. Circulation 117(25):3171–3180, PMID: , 10.1161/CIRCULATIONAHA.107.730366. - DOI - PMC - PubMed
    1. Suh I, Nam CM, Jee SH, Kim SI, Lee KH, Kim HC, et al. . 1999. Twelve-year tracking of blood pressure in Korean school children: the Kangwha Study. Yonsei Med J 40(4):383–387, PMID: , 10.3349/ymj.1999.40.4.383. - DOI - PubMed
    1. Bao W, Threefoot SA, Srinivasan SR, Berenson GS. 1995. Essential hypertension predicted by tracking of elevated blood pressure from childhood to adulthood: the Bogalusa Heart Study. Am J Hypertens 8(7):657–665, PMID: , 10.1016/0895-7061(95)00116-7. - DOI - PubMed
    1. Naidoo S, Kagura J, Fabian J, Norris SA. 2019. Early life factors and longitudinal blood pressure trajectories are associated with elevated blood pressure in early adulthood. Hypertension 73(2):301–309, PMID: , 10.1161/HYPERTENSIONAHA.118.11992. - DOI - PubMed
    1. Davis PH, Dawson JD, Riley WA, Lauer RM. 2001. Carotid intimal-medial thickness is related to cardiovascular risk factors measured from childhood through middle age: the Muscatine Study. Circulation 104(23):2815–2819, PMID: , 10.1161/hc4601.099486. - DOI - PubMed

Publication types

Substances