. 2024 Apr 23;43(4):113975.
doi: 10.1016/j.celrep.2024.113975. Epub 2024 Mar 19.

SIRT4 loss reprograms intestinal nucleotide metabolism to support proliferation following perturbation of homeostasis

Affiliations

SIRT4 loss reprograms intestinal nucleotide metabolism to support proliferation following perturbation of homeostasis

Sarah A Tucker et al. Cell Rep. .

Abstract

The intestine is a highly metabolic tissue, but the metabolic programs that influence intestinal crypt proliferation, differentiation, and regeneration are still emerging. Here, we investigate how mitochondrial sirtuin 4 (SIRT4) affects intestinal homeostasis. Intestinal SIRT4 loss promotes cell proliferation in the intestine following ionizing radiation (IR). SIRT4 functions as a tumor suppressor in a mouse model of intestinal cancer, and SIRT4 loss drives dysregulated glutamine and nucleotide metabolism in intestinal adenomas. Intestinal organoids lacking SIRT4 display increased proliferation after IR stress, along with increased glutamine uptake and a shift toward de novo nucleotide biosynthesis over salvage pathways. Inhibition of de novo nucleotide biosynthesis diminishes the growth advantage of SIRT4-deficient organoids after IR stress. This work establishes SIRT4 as a modulator of intestinal metabolism and homeostasis in the setting of DNA-damaging stress.

Keywords: CP: Cancer; SIRT4; glutamine; intestinal organoids; irradiation; nucleotide biosynthesis; nucleotide metabolism; sirtuin.


Conflict of interest statement

Declaration of interests M.C.H. received research funding from Agilent Technologies and Roche Pharmaceuticals. M.C.H. serves on the scientific advisory boards of Alixia, Minovia, and MitoQ and is on the editorial boards of Cell Metabolism and Molecular Cell. S.V. served as a Cell Reports editor between 2018 and 2021 and is currently the lead editor for Cell Press Multi-Journal Submission. She carried out the work reported in this paper before joining Cell Press. She was not given access to information related to the peer review of this paper, nor did she participate in the decision-making process. K.M.H. received research funding from Novartis and TUO Therapeutics.

Figures

Figure 1.
Figure 1.. Conditional knockout of Sirt4 in the intestinal epithelium.
(A) Schematic illustrating generation of mice with conditional SIRT4 KO in the intestinal epithelium. (B) Western blot of intestine-specific knockout of SIRT4. Each lane represents tissue from one individual mouse. (C) Representative IHC in small intestines from Sirt4Fl/Fl (WT) and Villin-Cre; Sirt4Fl/Fl (KO) mice for intestinal epithelial markers; lysozyme, Paneth cells; keratin 20, enterocytes; mucin 2, goblet cells. Scale bars equal 100 μm. (D) Quantification of epithelial crypt height as a function of colonic position in the colons of either WT or SIRT4 KO mice. (E) Box and whisker plot illustrating the quantification of average epithelial crypt height in the colons of WT and SIRT4 KO mice; n=4 mice per group, 550-750 crypts quantified per group. Statistical analysis performed by Mann-Whitney test. (F) Representative images of Ki67 fluorescent staining of colon swiss rolls from SIRT4 WT and KO mice. Arrows indicate Ki67 positive cells not restricted to crypt base. Green: Ki67, Blue: DAPI. Scale bars equal 100 μm. (G) Quantification of the relative position of the highest Ki67+ cell/crypt across the length of the distal colon epithelium. 200-300 crypts quantified per group. (H) Quantification of the number of Ki67+ cells/crypt across the length of the distal colon epithelium. 200-300 crypts quantified per group. (I) Representative cleaved caspase 3 (CC3) fluorescent staining of colon swiss rolls. Green: CC3, Blue: DAPI. Scale bars equal 100 μm. (J) Quantification of CC3+ cell/crypt from SIRT4 WT and KO mice. 200-300 crypts quantified per group. (K) Representative Ki67 fluorescent staining of colon swiss rolls. Green: Ki67, Blue: DAPI. Scale bars equal 100 μm. (L) Quantification of Ki67+ cells/crypt from 0 and 8 Gy irradiated SIRT4 WT and KO mice. 300-400 crypts quantified per group. All mice used for experiments presented in this figure (B-I) were 10-14 weeks old. Data in this figure are represented as mean ± SEM. WT n=3, KO n=3 (unless stated otherwise). Statistical significance was assessed by Student’s t test. *p<0.05. **p<0.01. ***p<0.001. ****p<0.0001.
Figure 2.
Figure 2.. SIRT4 acts as a tumor suppressor in the intestine.
(A) Schematic of experiments performed in Apc mutant CRC GEMM with Sirt4 knockout in the intestine. (B-C) Box and whisker plot illustrating the quantification of average epithelial crypt height in the proximal (B) and distal (C) colons of Villin-Cre; ApcEx14Fl/+ (WT) and Villin-Cre; Sirt4Fl/Fl; ApcEx14Fl/+ (KO) mice; n=3 mice per group, 300-400 crypts quantified per group. All mice used in this experiment were 20 weeks old. Statistical analysis performed by Mann-Whitney test. (D) Box and whisker plot illustrating the quantification of average epithelial crypt-villus height in the proximal, middle, and distal small intestine of SIRT4 WT and KO mice with Apc mutation; n=3 mice per group, 300-400 crypts quantified per group. Statistical analysis performed by Mann-Whitney test. All mice used in this experiment were 20 weeks old. (E) Number of colon tumors in SIRT4 WT and KO mice with Apc mutation. n=10-22 mice of each gender per group. All mice used in this experiment were 20 weeks old. (F) Number of small intestinal tumors in SIRT4 WT and KO mice with Apc mutation. n=12-22 mice of each gender per group. All mice were 20 weeks old. (G) Number of tumors in the proximal, middle, or distal portion of the small intestine in SIRT4 WT and KO mice with Apc mutation. n=10-20 mice of each gender per group. All mice were 20 weeks old. (H) Tumor area in the proximal, middle, or distal portion of the small intestine in SIRT4 WT and KO mice with Apc mutation. n=7-10 mice of each gender per group. All mice used in this experiment were 20 weeks old. (I) Survival of SIRT4 WT and KO mice with Apc mutation (p<0.001, Log-rank Mantel-Cox test). Bl6 mice, n=15-20 mice of each gender per group. (J-K) SIRT4 mRNA expression levels in human patient APC mutant colorectal adenomas (J) and human patient colon adenocarcinomas (K). (L) Kaplan-Meier curve showing correlation of SIRT4 expression with disease-free survival. Data reflects upper and lower quintiles of TCGA Colorectal patient data. (M) Volcano plot depicting polar metabolite levels from SIRT4 WT and KO small intestinal tumors with an Apc mutation. Dotted lines indicate 1.25-fold change. (N) Table of the metabolic pathways significantly changed in SIRT4 KO small intestinal tumors with an Apc mutation. The pathway analysis module in MetaboAnalyst 5.0 was used for the analysis. Data in this figure are represented as mean ± SEM. Statistical significance was assessed by Student’s t test, *p<0.05. **p<0.01. ****p<0.0001.
Figure 3.
Figure 3.. SIRT4 loss promotes cell proliferation in the intestine post-injury.
(A) Schematic depicting the generation of intestinal organoid cultures from Sirt4Fl/Fl (WT) and Villin-Cre; Sirt4Fl/Fl; (KO) mice. (B) Western blot of differentiated intestinal cell markers and mitochondrial markers in SIRT4 WT and KO organoids. (C-D) Quantification of the protein levels of SDHA (C) and VDAC (D) after normalization by actin. (E) Schematic of primary organoid outgrowth assay. (F) Representative images of primary organoid outgrowth from SIRT4 WT and KO mice. Scale bars equal 100 μm. (G) Quantification of primary organoid outgrowth of crypts isolated from SIRT4 WT and KO organoids after 5 days. (H) Schematic of secondary organoid outgrowth assay. (I) Representative images of secondary organoid outgrowth from SIRT4 WT and KO mice after 5 Gy irradiation (IR); red arrows indicate aborted organoids. Scale bars equal 100 μm. (J) Quantification of secondary organoid outgrowth from SIRT4 WT and KO mice after 5 Gy IR. (K) Quantification of secondary organoid outgrowth from SIRT4 WT, KO, or KO mice with empty vector, WT SIRT4 re-expressed, or SIRT4-HY catalytic mutant expressed after 5 Gy IR. Organoids were established from mice that were 10-14 weeks old. Data in this figure are represented as mean ± SEM. WT n=3, KO n=3. Statistical significance was assessed by Student’s t test, *p<0.05. **p<0.01. ***p<0.001. ****p<0.0001.
Figure 4.
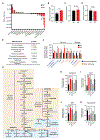
Figure 4.. SIRT4 regulates glutamine and nucleotide metabolism in intestinal organoids.
(A) Amino acid uptake or secretion in WT and SIRT4 KO organoids. (B-D) Glutamine uptake (B), glucose uptake (C), and lactate production (D) in Sirt4Fl/Fl (WT) and Villin-Cre; Sirt4Fl/Fl (KO) organoids. (E) Table of the metabolic pathways significantly changed in SIRT4 KO organoids. The pathway analysis module in MetaboAnalyst 5.0 was used for the analysis. (F) Steady state levels of metabolites in pyrimidine and purine metabolism from WT and SIRT4 KO organoids. (G) Model for de novo and salvage nucleotide biosynthesis pathways. (H-K) Relative levels of glutamine (H), UMP (I), AMP (J), and hypoxanthine (K) in WT and SIRT4 KO organoids with empty vector, WT SIRT4 re-expressed, or SIRT4-HY catalytic mutant expressed. Organoids were established from mice that were 10-14 weeks old. Data in this figure are represented as mean ± SEM. WT n=3, KO n=3. Statistical significance was assessed by Student’s t test, *p<0.05. **p<0.01. ***p<0.001.
Figure 5.
Figure 5.. SIRT4 loss increases de novo nucleotide biosynthesis to support organoid proliferation post-injury.
(A) Schematic of 15N2-glutamine labeling of de novo pyrimidine biosynthesis. (B) Schematic of 15N2-glutamine labeling of de novo purine biosynthesis. (C-D) Relative levels and fractions labeled of orotate (C) and UMP (D) after labeling with 2 mM 15N2-glutamine for 1 hour, 6 hours, or 24 hours in WT and SIRT4 KO organoids (hashes indicate differences in metabolite pool sizes, asterisks indicate differences in fraction labeled). (E-F) Relative levels and fractions labeled of AMP (E) and GMP (F) after labeling with 2 mM 15N2-glutamine for 1 hour, 6 hours, or 24 hours in WT and SIRT4 KO organoids (hashes indicate differences in metabolite pool sizes, asterisks indicate differences in fraction labeled). (G) Schematic of 15N2-uridine labeling of salvage pyrimidine biosynthesis. (H) Relative levels and fractions labeled of UMP after labeling with 40 μM 15N2-uridine for 3 hours or 6 hours in WT and SIRT4 KO organoids (hashes indicate differences in metabolite pool sizes, asterisks indicate differences in fraction labeled). (I) Schematic of 15N4-hypoxanthine labeling of salvage purine biosynthesis. (J-K) Relative levels and fractions labeled of hypoxanthine (J) and AMP (K) after labeling with 40 μM 15N4-hypoxanthine for 3 hours or 6 hours in WT and SIRT4 KO organoids (hashes indicate differences in metabolite pool sizes, asterisks indicate differences in fraction labeled). (L) Schematic of secondary outgrowth assay followed by drug treatment to rescue organoid growth post-IR. (M-O) Quantification of secondary organoid outgrowth from SIRT4 WT and KO mice after 5 Gy IR following 3 days of growth in 0.01 mM glutamine (M) or supplementation with either 1.5 μM DON (N) or 0.1 μM brequinar (O). (P) Quantification of secondary organoid outgrowth from SIRT4 WT and KO mice after 5 Gy IR following 4 days of growth in ENR or ENR supplemented with exogenous nucleosides. Organoids were established from mice that were 10-14 weeks old. Data in this figure are represented as mean ± SEM. WT n=3, KO n=3. Statistical significance was assessed by Student’s t test, *p<0.05. **p<0.01. ***p<0.001.

Similar articles

Cited by

References

    1. Barker N, van Es JH, Kuipers J, Kujala P, van den Born M, Cozijnsen M, Haegebarth A, Korving J, Begthel H, Peters PJ, and Clevers H (2007). Identification of stem cells in small intestine and colon by marker gene Lgr5. Nature 449, 1003–1007. 10.1038/nature06196. - DOI - PubMed
    1. Sato T, Vries RG, Snippert HJ, van de Wetering M, Barker N, Stange DE, van Es JH, Abo A, Kujala P, Peters PJ, and Clevers H (2009). Single Lgr5 stem cells build crypt-villus structures in vitro without a mesenchymal niche. Nature 459, 262–265. 10.1038/nature07935. - DOI - PubMed
    1. Darwich AS, Aslam U, Ashcroft DM, and Rostami-Hodjegan A (2014). Meta-analysis of the turnover of intestinal epithelia in preclinical animal species and humans. Drug Metab Dispos 42, 2016–2022. 10.1124/dmd.114.058404. - DOI - PubMed
    1. Hageman JH, Heinz MC, Kretzschmar K, van der Vaart J, Clevers H, and Snippert HJG (2020). Intestinal Regeneration: Regulation by the Microenvironment. Dev Cell 54, 435–446. 10.1016/j.devcel.2020.07.009. - DOI - PubMed
    1. Sprangers J, Zaalberg IC, and Maurice MM (2021). Organoid-based modeling of intestinal development, regeneration, and repair. Cell Death & Differentiation 28, 95–107. 10.1038/s41418-020-00665-z. - DOI - PMC - PubMed

Publication types