. 2024 Mar 22;10(12):eadk9884.
doi: 10.1126/sciadv.adk9884. Epub 2024 Mar 20.

Reactive astrocytes secrete the chaperone HSPB1 to mediate neuroprotection

Affiliations

Reactive astrocytes secrete the chaperone HSPB1 to mediate neuroprotection

Fangjia Yang et al. Sci Adv. .

Abstract

Molecular chaperones are protective in neurodegenerative diseases by preventing protein misfolding and aggregation, such as extracellular amyloid plaques and intracellular tau neurofibrillary tangles in Alzheimer's disease (AD). In addition, AD is characterized by an increase in astrocyte reactivity. The chaperone HSPB1 has been proposed as a marker for reactive astrocytes; however, its astrocytic functions in neurodegeneration remain to be elucidated. Here, we identify that HSPB1 is secreted from astrocytes to exert non-cell-autonomous protective functions. We show that in human AD brain, HSPB1 levels increase in astrocytes that cluster around amyloid plaques, as well as in the adjacent extracellular space. Moreover, in conditions that mimic an inflammatory reactive response, astrocytes increase HSPB1 secretion. Concomitantly, astrocytes and neurons can uptake astrocyte-secreted HSPB1, which is accompanied by an attenuation of the inflammatory response in reactive astrocytes and reduced pathological tau inclusions. Our findings highlight a protective mechanism in disease conditions that encompasses the secretion of a chaperone typically regarded as intracellular.


Figures

Fig. 1.
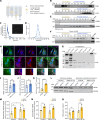
Fig. 1.. HSPB1 is found in astrocytes proximal to amyloid plaques and in their surrounding space.
(A) Representative images of temporal cortex from severe cases of AD (Braak V/VI) coimmunostained with HSPB1 and ALDHL1 (astrocytes), GFAP (reactive astrocytes), IBA1 (microglia), CAII (oligodendrocytes), and MAP2 (neurons). (B) Representative images of GFAP+ and HSPB1+ astrocytes clustering in the areas proximal to amyloid plaques (positive for 6E10 anti-Aβ). (C and D) Graphs show the mean fluorescence intensity of GFAP (C) and HSPB1 (D) in areas proximal or distal to the plaques. N = 5 Braak V/VI cases, with a minimum of 10 images per case per condition. (E) The percentage of HSPB1+ cells that were also GFAP+ was calculated in areas that are proximal or distal to the plaques. N = 5 Braak V/VI cases. (F) Summary of literature review of the existing proteomic studies of CSF from healthy individuals, showing the total proteins detected, the number of samples tested, and the sHSPs identified. (G) (From left to right) Representative image of astrocytes in distal or proximal areas to plaques and the area selected for analysis (comprising an area of 50-μm diameter around nuclei); merged GFAP and HSPB1; and HSPB1 immunoreactivity in selected area; a GFAP mask is applied to distinguish between intracellular (GFAP+) and extracellular (GFAP) space; and HSPB1 signal is shown after applying the GFAP mask, which shows the area in green used for quantification (non-masked HSPB1). (H) The mean fluorescence intensity of HSPB1 in the extracellular space (non-masked HSPB1) was calculated per astrocyte in distal or proximal regions to plaques. N = 5 Braak V/VI cases (>50 cells per case per condition). Data are shown as means ± SD. Paired Student’s t test (n = 5), *P < 0.05, ***P < 0.001.
Fig. 2.
Fig. 2.. HSPB1 secretion is increased in inflammatory reactive astrocytes.
(A) Levels of HSPB1 were detected by immunoblot in primary mouse astrocytes (GFAP) but not in neurons (β-III-tubulin) or microglia (IBA1). (B) Primary mouse astrocytes were treated with 50 nM scramble (control) or HSPB1 siRNA, and HSPB1 was detected in astrocyte lysates or in concentrated conditioned medium. Fresh culture medium (non–cell exposed) was used as a control to discard the presence of HSPB1 or unspecific binding in serum. (C) Mouse astrocytes were transfected with either an empty vector or a construct to express V5-hHSPB1, which was detected by Western blotting with a V5 antibody in either astrocyte lysates or concentrated conditioned medium. (D and E) HSPB1 was detected in iPSC-derived astrocyte total cell lysates and conditioned medium in two control lines: C53 (D) and C70 (E). (F to I) Primary mouse astrocytes were treated with TNFα (30 ng/ml) and IL-1α (3 ng/ml) for 24 hours. (F) HSPB1 in lysates or in concentrated medium was detected by Western blotting, and levels of HSPB1 in medium were quantified relative to intracellular HSPB1 (G) or to intracellular GAPDH (H); intracellular HSPB1 levels were quantified relative to GAPDH (I); and LDH release to the medium was determined as a readout of cellular toxicity (J). Data are shown as means ± SD and were analyzed by unpaired Student’s t test in a minimum of three biological replicates. ***P < 0.001; ns, not significant.
Fig. 3.
Fig. 3.. HSPB1 is not secreted within EVs.
(A) SEC was used to fractionate the medium and to separate large particles such as EVs from soluble free proteins. (B) Astrocyte-conditioned medium was fractionated by SEC, and fractions were immunoblotted for CD81 (EV marker) and LCN2 (secreted as free protein). (C) The concentration and size distribution of particles contained in fractions 7 to 9 were analyzed by NTA. (D) Total protein concentration was determined by NanoDrop spectrophotometer in fractions 1 to 36. (E) Conditioned medium from astrocytes treated with control or TNFα + IL-1α for 24 hours was fractionated by SEC and immunoblotted for HSPB1. (F) Astrocyte medium was treated with 1% Triton X-100 for 1 hour before SEC, followed by detection of CD81 and HSPB1. (G) Medium of astrocytes expressing V5-hHSPB1 was treated with increasing concentrations of proteinase K, and levels of HSPB1 and LCN2 and bands resulting from its degradation were detected by Western blotting. (H) HSPB1, LAMP1, and LC3 were detected by immunofluorescence in astrocytes treated with control or TNFα + IL-1α for 24 hours, and colocalization was determined as Pearson’s correlation coefficient for HSPB1-LC3 (I) and HSPB1-LAMP1 (J). (K to O) Astrocytes were treated with dimethyl sulfoxide (DMSO) (control) or 20 nM Baf-A1 for 24 hours: Levels of NAG were detected in the medium (K); HSPB1 was detected in lysates or concentrated medium after concomitant treatment with control or TNFα + IL-1α and Baf-A1 (L), and the levels of HSPB1 in medium (M) or the levels of intracellular HSPB1 (N) were quantified relative to GADPH in lysates; and LDH levels in medium relative to intracellular levels (O). Data are shown as means ± SD and analyzed by two-way ANOVA with Tukey’s multiple comparisons test [(M) to (O)] or unpaired Student’s t test [(I) to (K)] in a minimum of three biological replicates. *P < 0.05, **P < 0.01, ***P < 0.001.
Fig. 4.
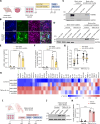
Fig. 4.. HSPB1 is internalized by astrocytes and neurons.
(A) Primary mouse astrocytes were treated for 24 hours either with conditioned medium from astrocytes transfected with V5-hHSPB1 or with rhHSPB1. Created with BioRender.com. (B) Anti-V5 and anti-human HSPB1 (hHSPB1) antibodies were used to detect the levels of V5-hHSPB1 in astrocyte lysates exposed to conditioned medium for 24 hours. (C) An anti-hHSPB1 antibody was used to detect the levels of human HSPB1 in astrocytes treated with the indicated concentrations of rhHSPB1 for 24 hours or with heat-inactivated (HI) rhHSPB1. (D) Confocal live imaging of astrocytes exposed to rhHSPB1 labeled with Oregon Green for 24 hours and stained with lysotracker. (E) Primary mouse neurons were treated with either conditioned medium from astrocytes transfected with V5-hHSPB1 and grown in Neurobasal medium or with rhHSPB1. Created with BioRender.com. (F) Anti-V5 and anti-hHSPB1 antibodies were used to detect the levels of V5-hHSPB1 in neuron lysates exposed to conditioned medium for 8 hours. (G) An anti-hHSPB1 antibody was used to detect the levels of human HSPB1 in neurons treated with the indicated concentrations of rhHSPB1, or heat-inactivated rhHSPB1, for 24 hours. Equivalent amounts of rhHSPB1 in control or upon heat inactivation were run in parallel to confirm its detection by Western blotting. Note that the background detected in neuron lysates at 0 ng/ml is unspecific since (i) neurons in culture do not express HSPB1, as we have shown in Fig. 2A, and (ii) human HSPB1 antibody does not recognize the mouse HSPB1 [as shown in (C), where astrocytes express high levels of murine HSPB1]. (H) Confocal live imaging of neurons exposed for 6 hours to rhHSPB1 labeled with Oregon Green and stained with lysotracker.
Fig. 5.
Fig. 5.. rhHSPB1 attenuates the astrocyte inflammatory reactive response.
(A) Primary astrocytes were pretreated with rhHSPB1 for 24 hours before treatment with either 0.1% BSA (vehicle) or rhHSPB1 (50 ng/ml) and either TNFα + IL-1α or control for further 24 hours. Created with BioRender.com. (B) LCN2, SerpinA3N, and iNOS were detected by Western blotting in astrocyte lysates, and levels were quantified relative to GADPH as a loading control (C to E). (F and G) LCN2 was detected in concentrated conditioned medium and quantified relative to intracellular GAPDH levels (G). (H) The concentration of nitrites in the astrocyte medium was measured as an indirect measure of NO using a Griess assay. (I) The levels of IL-6 in the astrocyte medium were determined by ELISA. (J and K) A cytokine array was used to determine levels of 38 cytokines in the medium in a membrane-based sandwich immunoassay. The average z scores for each of the 38 cytokines was represented in the graph (J) or shown individually for each cytokine in the heatmap (K), where cytokines are ranked from low to high fold change of TNFα + IL-1α/rhHSPB1 versus TNFα + IL-1α/vehicle. Cytokines with an asterisk showed significant increase (red) or decrease (green) in TNFα + IL-1α/rhHSPB1 versus TNFα + IL-1α/vehicle condition. Data are shown as means ± SD (N = 3). Two-way ANOVA with Tukey’s or Sidak’s multiple comparisons test [(C), (D), (E), (G), (H), and (J)] or unpaired Student’s t test (I). *P < 0.05, **P < 0.01, ***P < 0.001, ****P < 0.0001.
Fig. 6.
Fig. 6.. Astrocyte-secreted HSPB1 modulates the inflammatory response in organotypic brain slice cultures.
(A) Organotypic brain slices were prepared from postnatal mouse brain, transduced at 0 DIV with AAVs to express hHSPB1 in astrocytes under the GFAP promoter for 20 DIV followed by treatment with TNFα + IL-1α for 24 hours. Created with BioRender.com. (B) Transduction of slices with AAV-GFAP-BFP (AAV-GFAP) and AAV-GFAP-hHSPB1:BFP (AAV-GFAP-hHSPB1) shows astrocyte-specific (GFAP+) expression of BFP and hHSPB1 (note that HSPB1 antibody has some unspecific nuclear staining). (C) Western blotting to confirm expression of hHSPB1 and its secretion in brain slices. (D to F) Changes in LCN2 were quantified in lysates (E) and in conditioned medium (F) relative to intracellular GAPDH. (G and H). A cytokine array measured levels of 38 cytokines in the medium in a membrane-based sandwich immunoassay. The average z scores for each cytokine were represented in the graph (G) or shown individually in the heatmap (H), where cytokines are ranked from high to low fold change of control/AAV-GFAP versus TNFα + IL-1α/AAV-GFAP. Cytokines marked with a green asterisk were significantly decreased in TNFα + IL-1α/AAV-GFAP-hHSPB1 versus TNFα + IL-1α/AAV-GFAP conditions. (I) The hippocampus was separated and cultured for 19 days and then pretreated with rhHSPB1 (50 ng/ml) for 24 hours and with either control or TNFα + IL-1α and either vehicle (0.1% BSA) or rhHSPB1 (50 ng/ml) for further 24 hours. (J) Levels of LCN2 were detected by immunoblot in slice lysates and quantified relative to GAPDH (K). Data are shown as means ± SD. N = 5 [(E) and (F)], N = 3 [(G) and (H)], or N = 6 [(J) and (K)]. Two-way ANOVA with Tukey’s or Sidak’s multiple comparisons test, *P < 0.05, **P < 0.01, ***P < 0.001, ****P < 0.0001.
Fig. 7.
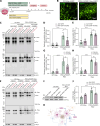
Fig. 7.. Extracellular hHSPB1 promotes neuronal health and prevents human mutant tau aggregation in primary mouse neurons.
(A) Primary mouse neurons were treated with rhHSPB1 (10 ng/ml) or vehicle (0.1% BSA) every 3 days from 3 DIV, fixed on 14 DIV, and stained for MAP2. (B to G) High-content confocal microscopy was used to determine changes in the number of segments (B), end points (C), primary branching points (D), secondary branching points (E), root points (F) per neuron, and the total length of all neurites for each neuron (G) (N = 6). (H) Neurons were treated with conditioned medium from control or TNFα + IL-1α–treated astrocytes at 10 and 12 DIV, together with rhHSPB1 (50 ng/ml) or vehicle (0.1% BSA), and the medium was collected at 13 DIV. In parallel, neurons were treated with equivalent concentrations of TNFα + IL-1α. Cellular toxicity was determined by measuring LDH levels in neuron-conditioned medium (N = 5). (I) Neurons were transduced at 6 DIV with AAVs to express WT-htau-EGFP or mutant P301L/S320F-htau-EGFP and treated with either vehicle (0.1% BSA) or rhHSPB1 (50 ng/ml) every 2 days and fixed at 12 DIV. Created with BioRender.com. (J) Representative images of neurons transduced with mutant P301L/S320F-htau-EGFP and treated with vehicle (0.1% BSA) or rhHSPB1 (50 ng/ml). (K) Graph shows the percentage of EGFP-positive neurons that show mutant htau aggregates. N = 6 with >1500 cells counted per experiment. (L and M) Total levels of tau were detected using an antibody that recognizes total tau, and the band corresponding to htau tagged to EGFP was quantified relative to β-actin. (N) Cellular toxicity was determined by measuring LDH levels in neuron-conditioned medium (N = 4). Data are shown as means ± SD. Paired Student’s t test [(B) to (G) and (K)]; two-way ANOVA with Tukey’s multiple comparisons test [(H), (M), and (N)], *P < 0.05, **P < 0.01.
Fig. 8.
Fig. 8.. Extracellular hHSPB1 reduces accumulation of sarkosyl-insoluble P301L/S320F-htau in organotypic brain slices.
(A) Organotypic brain slices were transduced with AAVs to express WT-htau-EGFP or mutant P301L/S320F-htau-EGFP and (i) simultaneously transduced with AAV-GFAP or AAV-GFAP-hHSPB1 or (ii) treated with either vehicle (0.1% BSA) or rhHSPB1 (50 ng/ml) from 14 DIV and then every 2 to 3 days up to 28 DIV. Created with BioRender.com. (B) Representative images of slices with AAV-WT-htau-EGFP or AAV-P301L/S320F-htau-EGFP. (C to E) Total lysates from AAV-GFAP-HSPB1 or control transduced slices were subjected to sarkosyl extraction to isolate the low-speed supernatant (total tau), high-speed supernatant (soluble tau), or sarkosyl-insoluble pellet (insoluble tau). Tau (D) or Ser396/Ser404 phosphorylated tau (PHF-1) (E) were quantified in the whole lane (between 15 and 250 kDa) to include both mouse (mtau) and htau and any modified tau, and quantified relative to β-actin or total tau, as indicated. (F to H) Lysates from brain slices treated with rhHSPB1 or vehicle were subjected to sarkosyl extraction, and levels of tau (G) or PHF-1 (H) were quantified as above. (I) Intracellular LCN2 was detected in lysates from slices transduced with AAV-WT-htau-EGFP or AAV-P301L/S320F-htau-EGFP and AAV-GFAP-HSPB1 or control at 0 DIV and collected at 28 DIV. Levels of LCN2 relative to ALDH1L1 are shown (J). Data are shown as means± SD. N = 6 [(D) and (E)], N = 5 [(G) and (H)], or N = 3 (J). Two-way ANOVA with Tukey’s multiple comparisons test [(D), (E), (G), (H), and (J)], *P < 0.05, **P < 0.01, ***P < 0.001, ****P < 0.0001. (K) Working model showing that reactive astrocytes that surround amyloid plaques or that are exposed to proinflammatory cytokines from activated microglia secrete HSPB1 into the extracellular space. Secreted HSPB1 can have autocrine functions by ameliorating the reactive inflammatory response in astrocytes, as well as paracrine functions by reducing tau inclusion pathology and promoting neuronal health in adjacent neurons. Created with BioRender.com.

References

    1. Perez-Nievas B. G., Serrano-Pozo A., Deciphering the astrocyte reaction in Alzheimer’s disease. Front. Aging Neurosci. 10, 114 (2018). - PMC - PubMed
    1. Escartin C., Galea E., Lakatos A., O’Callaghan J. P., Petzold G. C., Serrano-Pozo A., Steinhäuser C., Volterra A., Carmignoto G., Agarwal A., Allen N. J., Araque A., Barbeito L., Barzilai A., Bergles D. E., Bonvento G., Butt A. M., Chen W.-T., Cohen-Salmon M., Cunningham C., Deneen B., De Strooper B., Díaz-Castro B., Farina C., Freeman M., Gallo V., Goldman J. E., Goldman S. A., Götz M., Gutiérrez A., Haydon P. G., Heiland D. H., Hol E. M., Holt M. G., Iino M., Kastanenka K. V., Kettenmann H., Khakh B. S., Koizumi S., Lee C. J., Liddelow S. A., MacVicar B. A., Magistretti P., Messing A., Mishra A., Molofsky A. V., Murai K. K., Norris C. M., Okada S., Oliet S. H. R., Oliveira J. F., Panatier A., Parpura V., Pekna M., Pekny M., Pellerin L., Perea G., Pérez-Nievas B. G., Pfrieger F. W., Poskanzer K. E., Quintana F. J., Ransohoff R. M., Riquelme-Perez M., Robel S., Rose C. R., Rothstein J. D., Rouach N., Rowitch D. H., Semyanov A., Sirko S., Sontheimer H., Swanson R. A., Vitorica J., Wanner I.-B., Wood L. B., Wu J., Zheng B., Zimmer E. R., Zorec R., Sofroniew M. V., Verkhratsky A., Reactive astrocyte nomenclature, definitions, and future directions. Nat. Neurosci. 24, 312–325 (2021). - PMC - PubMed
    1. Liddelow S. A., Guttenplan K. A., Clarke L. E., Bennett F. C., Bohlen C. J., Schirmer L., Bennett M. L., Münch A. E., Chung W.-S., Peterson T. C., Wilton D. K., Frouin A., Napier B. A., Panicker N., Kumar M., Buckwalter M. S., Rowitch D. H., Dawson V. L., Dawson T. M., Stevens B., Barres B. A., Neurotoxic reactive astrocytes are induced by activated microglia. Nature 541, 481–487 (2017). - PMC - PubMed
    1. Das S., Li Z., Noori A., Hyman B. T., Serrano-Pozo A., Meta-analysis of mouse transcriptomic studies supports a context-dependent astrocyte reaction in acute CNS injury versus neurodegeneration. J. Neuroinflammation 17, 227 (2020). - PMC - PubMed
    1. Haslbeck M., Weinkauf S., Buchner J., Small heat shock proteins: Simplicity meets complexity. J. Biol. Chem. 294, 2121–2132 (2019). - PMC - PubMed

Publication types