. 2024 Mar 22;10(12):eadl4239.
doi: 10.1126/sciadv.adl4239. Epub 2024 Mar 20.

Gastrulation-stage gene expression in Nipbl+/- mouse embryos foreshadows the development of syndromic birth defects

Affiliations

Gastrulation-stage gene expression in Nipbl+/- mouse embryos foreshadows the development of syndromic birth defects

Stephenson Chea et al. Sci Adv. .

Abstract

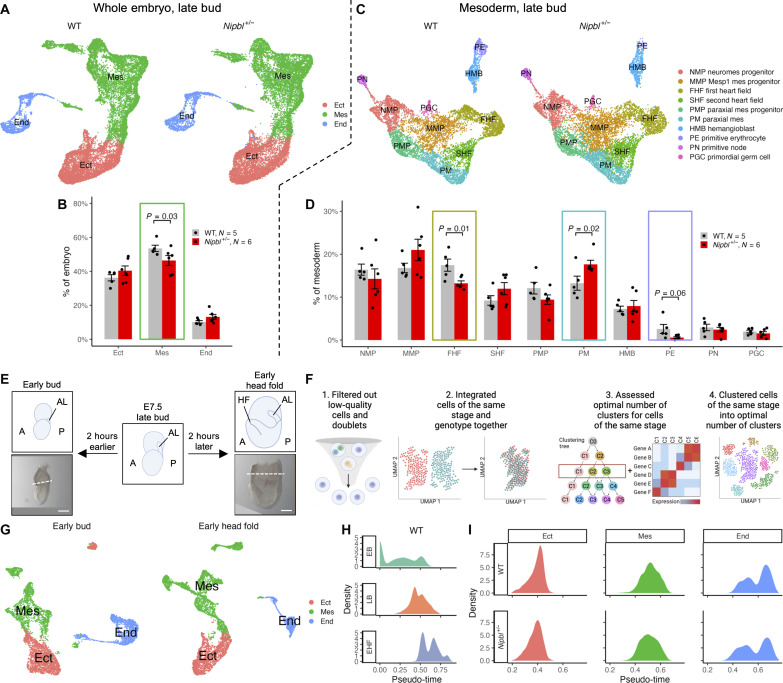
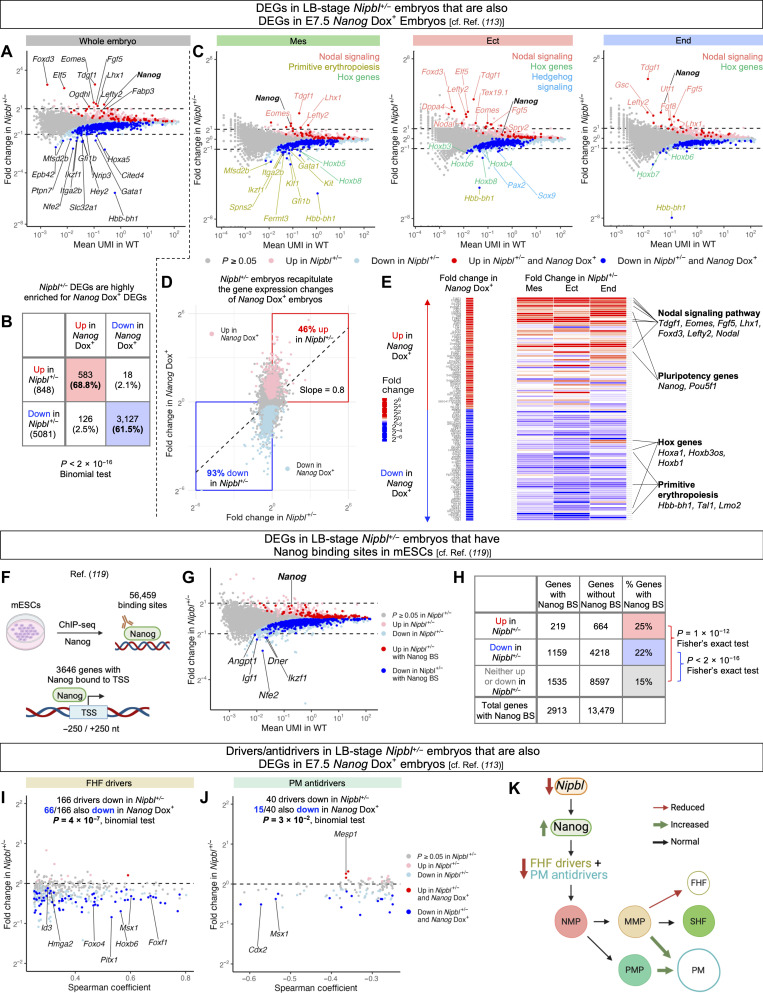
In animal models, Nipbl deficiency phenocopies gene expression changes and birth defects seen in Cornelia de Lange syndrome, the most common cause of which is Nipbl haploinsufficiency. Previous studies in Nipbl+/- mice suggested that heart development is abnormal as soon as cardiogenic tissue is formed. To investigate this, we performed single-cell RNA sequencing on wild-type and Nipbl+/- mouse embryos at gastrulation and early cardiac crescent stages. Nipbl+/- embryos had fewer mesoderm cells than wild-type and altered proportions of mesodermal cell subpopulations. These findings were associated with underexpression of genes implicated in driving specific mesodermal lineages. In addition, Nanog was found to be overexpressed in all germ layers, and many gene expression changes observed in Nipbl+/- embryos could be attributed to Nanog overexpression. These findings establish a link between Nipbl deficiency, Nanog overexpression, and gene expression dysregulation/lineage misallocation, which ultimately manifest as birth defects in Nipbl+/- animals and Cornelia de Lange syndrome.


Figures

Fig. 1.
Fig. 1.. Nipbl+/− mice do not lack any cell populations found in WT mice.
(A) Nipbl alleles used in this study. NipblFlox contains an inverted gene trap cassette encoding β-geo flanked by Cre recombinase target sites in intron 1 of Nipbl gene alleles (24). In this inverted orientation, there is no trapping of the Nipbl gene, and Nipbl is expressed normally. However, when this cassette is exposed to Cre recombinase, the gene trap cassette gets inverted producing the NipblFIN allele. In this orientation, trapping of the Nipbl gene occurs, and β-geo is expressed as a reporter of successful gene trapping. When NanogCre/+ mice are mated with NipblFlox/Flox mice, the resulting littermates are either entirely NipblFlox/+ or entirely NipblFIN/+, as NanogCre/+ mice carry a transgene that expresses Cre recombinase in the earliest cells of the developing embryo (26). (B) Lateral view of LB stage and anterior view of CC-stage embryos subjected to scRNA-seq. A, anterior; P, posterior; AL, allantois; L, left; R, right; HF, head fold; ML, midline. Dashed line represents where embryonic tissue was separated from extraembryonic tissue. Scale bars, 100 μm. (C) Workflow used to filter out low-quality cells and doublets, cluster WT cells into optimal number of clusters at each stage, and project Nipbl+/− cells onto WT clusters of the same stage. Uniform manifold approximation and projection (UMAP) of clusters in WT and Nipbl+/− embryos at (D) LB and (E) CC stages. UMAP of clusters in each Nipbl+/− embryo at (F) LB and (G) CC stages.
Fig. 2.
Fig. 2.. scRNA-seq captured cells from all germ layers, as well as progenitors of major tissues.
(A) UMAP of clusters assigned to germ layers in LB- and CC-stage embryos. (B) UMAP of germ layers in LB- and CC-stage embryos. Expression of genes marking germ layers of (C) LB- and (D) CC-stage embryos in UMAP. UMAP of cell populations in germ layers of (E) LB- and (F) CC-stage embryos. Heatmap of fold change in expression of the most differentially expressed transcription factor genes (lowest Q values from Mann-Whitney U test) (101) of cell populations from all other cell populations in germ layers of (G) LB- and (H) CC-stage embryos.
Fig. 3.
Fig. 3.. Nipbl+/− embryos exhibit changes in the sizes of mesodermal subpopulations that are not accompanied by changes in developmental timing.
(A) UMAP of germ layers in LB-stage WT and Nipbl+/− embryos. (B) Percentage of cells in germ layers from all cells in LB-stage WT and Nipbl+/− embryos. Error bars show SEM. P values from t test. (C) UMAP of cell populations in mesoderm of LB-stage WT and Nipbl+/− embryos. (D) Percentage of cells in mesodermal cell populations from all cells in LB-stage WT and Nipbl+/− embryos (bottom). Error bars show SEM. P values from t test. (E) Lateral view of WT EB- and EHF-stage embryos subjected to scRNA-seq. Dashed line represents where embryonic tissue was separated from extraembryonic tissue. Scale bars, 100 μm. (F) Workflow used to filter out low-quality cells and doublets and cluster cells at EB and EHF stages into optimal number of clusters. (G) UMAP of clusters assigned to germ layers in EB- and EHF-stage embryos. (H) Density of cells from WT EB-, LB-, and EHF-stage embryos along pseudo-time (calculated using URD). (I) Density of cells in germ layers of LB-stage WT and Nipbl+/− embryos along pseudo-time.
Fig. 4.
Fig. 4.. Nipbl+/− mice misdirect mesoderm cells into PM at the expense of the FHF.
(A) RNA velocities, calculated by scVelo of mesoderm cells from LB-stage WT and Nipbl+/− embryos in UMAP. (B) Cell lineage trajectories in mesoderm of LB-stage WT and Nipbl+/− embryos. Probability of mesoderm cells from LB-stage WT and Nipbl+/− embryos terminally transitioning (absorption probabilities calculated using CellRank) into (C) SHF, (E) FHF, or (G) PM fates in UMAP. Violin plot of probability of NMPs, MMPs, and PMPs from LB-stage WT and Nipbl+/− embryos terminally transitioning (absorption probabilities) into (D) SHF, (F) FHF, or (H) PM fates. Lines show means. P values from t test. (I) Schematic illustrating how mesoderm cells in Nipbl+/− embryos are misdirected into PM fate at the expense of FHF fate.
Fig. 5.
Fig. 5.. Nipbl+/− mice underexpress genes predicted to drive the transition of mesoderm cells into FHF.
UMAP of mesoderm cells in (A) FHF and (D) PM lineages of WT LB-stage embryos. Genes whose expression is positively correlated (drivers) or negatively correlated (antidrivers) with the transition (absorption probabilities from Fig. 3J) of mesoderm cells from WT LB-stage embryos into (B) FHF or (E) PM fates. Correlation coefficients calculated using Spearman’s rank correlation. Genes with correlation coefficient greater than 0.25 or less than −0.25 were considered drivers and antidrivers, respectively. Slope refers to change in gene expression along absorption probability. Overrepresentation score of MSigDB’s Hallmark gene sets among drivers and antidrivers of (C) FHF and (F) PM fates. (G) Venn diagram of genes shared between PM antidrivers and FHF drivers. (H) Overrepresentation score of MSigDB’s Hallmark gene sets among shared FHF drivers and PM antidrivers. (I) Expression of lineage branching signature as NMPs transition into FHF or PM fates. (J) Fold change in expression of genes in mesoderm cells of FHF lineage of LB-stage Nipbl+/− embryos differentially expressed (Q < 0.05, Mann-Whitney U test) from that of WT embryos along Spearman’s rank correlation coefficient from (B). Genes associated with EMT are labeled. (K) Overrepresentation score of MSigDB’s Hallmark gene sets among shared FHF drivers down-regulated in FHF lineage of Nipbl+/− mice. TFs, transcription factor.
Fig. 6.
Fig. 6.. Nipbl+/− mice show large changes in the expression of major developmental regulators in all germ layers.
(A) Number of differentially expressed genes (Q < 0.05, Mann-Whitney U test) in germ layers of LB-stage Nipbl+/− embryos showing small (≤2-fold) or large (>2-fold) changes in expression from that of WT embryos. (B) Normalized enrichment score of statistically significant (Q < 0.05, FGSEA) Hallmark genes sets in germ layers of LB-stage Nipbl+/− embryos from that of WT embryos. (C) Fold change in expression of Hallmark gene sets from Fig. 5B in germ layers of LB-stage Nipbl+/− embryos from that of WT embryos along their average expression in WT embryos. (D) Fold change in expression of DEGs (Q < 0.05, Mann-Whitney U test) in germ layers of LB-stage Nipbl+/− embryos showing large changes in expression (>2-fold) from that of WT embryos along their average expression in WT embryos.
Fig. 7.
Fig. 7.. Nipbl+/− mice overexpress Nanog during and after gastrulation.
(A) DEGs (greater than twofold up-regulated or down-regulated) between the germ layers of WT and Nipbl+/− embryos predicted by STRING to interact with each other. (B) Fold change in expression of DEGs (Q < 0.05, Mann-Whitney U test) in germ layers of LB-stage Nipbl+/− embryos showing large changes in expression (>2-fold) from that of WT embryos along their average expression in WT embryos that are predicted by STRING to interact with Nanog. (C) Expression of Nanog in mesodermal cell populations of LB-stage WT and Nipbl+/− embryos ordered from left (earlier) to right (later) by their RNA velocity positions in Fig. 4A. Error bars show SEM. (D) Expression of Nanog in WT and Nipbl+/− embryos from LB to CC stages. Error bars show SEM. P values from t test. (E) Expression of Pou5f1 in mesodermal cell populations of LB-stage WT and Nipbl+/− embryos ordered from left (earlier) to right (later) by their RNA velocity positions in Fig. 4A. Error bars show SEM. (F) Expression of Pou5f1 in WT and Nipbl+/− embryos from LB to CC stages. Error bars show SEM. P values from t test. (G) Monoclonal generation of NipblFlrt/+ (WT) and NipblFlex/+ (Nipbl+/−) ESCs. (H) Expression of Nipbl, Nanog, and Pou5f1 in WT and Nipbl+/− ESCs as measured by RT-qPCR and normalized to the housekeeping gene, Rpl4. Error bars show SEM. P values from t test.
Fig. 8.
Fig. 8.. LB-stage Nipbl+/− mice replicate the gene expression changes of Nanog overexpression.
(A) Fold change in expression of DEGs in LB-stage Nipbl+/− embryos (Q < 0.05, Mann-Whitney U test) that are also DEGs in E7.5 Nanog Dox+ embryos (Q < 0.05, t test) (113). (B) Percentage of DEGs in LB-stage Nipbl+/− embryos that are also DEGs in E7.5 Nanog Dox+ embryos (113). (C) Fold change in expression of DEGs in the germ layers of LB-stage Nipbl+/− embryos that are also DEGs in E7.5 Nanog Dox+ embryos (113). (D) Fold change in expression of genes in LB-stage Nipbl+/− embryos versus their fold change in E7.5 Nanog Dox+ embryos. DEGs in E7.5 Nanog Dox+ embryos (113) are colored pink and light blue. (E) Heatmap of the fold change in expression of DEGs from E7.5 Nanog Dox+ embryos (lowest Q values from t test) (113) in the germ layers of LB-stage Nipbl+/− embryos. (F) ChIP sequencing for Nanog in mESCs from (119) identified 3646 genes with one or more Nanog binding sites within ±250 nt of their TSSs. (G) Fold change in expression of DEGs in LB-stage Nipbl+/− embryos with one or more Nanog binding sites (BS) from (119). (H) Percentage of DEGs in LB-stage Nipbl+/− embryos with one or more Nanog binding sites from (119). Fold change in expression of DEGs in mesoderm cells of (I) FHF and (J) PM lineages of LB-stage Nipbl+/− embryos that are also DEGs in E7.5 Nanog Dox+ embryos (113). Transcription factor genes are labeled. (K) Reduction of Nipbl levels leads to the up-regulation of Nanog in LB-stage Nipbl+/− embryos and down-regulation of FHF drivers and PM antidrivers, resulting in the misallocation of mesoderm cells to PM at the expense of FHF.
Fig. 9.
Fig. 9.. Nipbl+/− mice show a delay in the expression of anterior Hox genes.
Expression of Hox genes in germ layers of WT and Nipbl+/− embryos at (A) LB and (B) CC stages. Expression of Hoxb genes in mesoderm (C) and ectoderm (D) of WT embryos from LB to CC stages ordered from left (5′) to right (3′) by their chromosomal position. Expression of Hoxb genes in mesoderm of WT embryos at (E) LB and (F) CC stages ordered from left (5′) to right (3′) by their chromosomal position.
Fig. 10.
Fig. 10.. Nipbl+/− mice show anteriorization of thoracic vertebrae with left-right asymmetry.
(A) Dorsal view of bone (Alizarin red) and cartilage (Alcian blue) stained rib cage of E18.5 WT and Nipbl+/− embryos. WT embryos only show 13 ribs. Nipbl+/− embryos show incomplete asymmetric growth of 14th rib. ss1 to ss5 refers to severity score in (B). 13, 13th thoracic vertebra; L1, first lumbar vertebra; C, cartilage; N, rib nub; R, whole rib. (B) Table categorizing range of incomplete asymmetric growth of 14th rib observed in E18.5 Nipbl+/− embryos and ranking them by their severity (low, ss1; high, ss5). (C) Table quantifying numbers of WT and Nipbl+/− embryos in which incomplete asymmetric growth of 14th rib was observed per severity score. P value from chi-square test.

Update of

References

    1. Centers for Disease Control and Prevention , Update on overall prevalence of major birth defects–Atlanta, Georgia, 1978–2005. MMWR Morb. Mortal. Wkly. Rep. 57, 1–5 (2008). - PubMed
    1. Mai C. T., Isenburg J. L., Canfield M. A., Meyer R. E., Correa A., Alverson C. J., Lupo P. J., Riehle-Colarusso T., Cho S. J., Aggarwal D., Kirby R. S., National Birth Defects Prevention Network , National population-based estimates for major birth defects, 2010-2014. Birth Defects Res 111, 1420–1435 (2019). - PMC - PubMed
    1. Sun R., Liu M., Lu L., Zheng Y., Zhang P., Congenital heart disease: Causes, diagnosis, symptoms, and treatments. Cell Biochem. Biophys. 72, 857–860 (2015). - PubMed
    1. Ely D. M., Driscoll A. K., Infant mortality in the United States, 2020: Data from the period linked birth/infant death file. Natl. Vital Stat. Rep. 71, 1–18 (2022). - PubMed
    1. Mannini L., Cucco F., Quarantotti V., Krantz I. D., Musio A., Mutation spectrum and genotype-phenotype correlation in Cornelia de Lange syndrome. Hum. Mutat. 34, 1589–1596 (2013). - PMC - PubMed

Publication types