. 2024 Mar 19;5(3):101469.
doi: 10.1016/j.xcrm.2024.101469.

DNAJB1-PRKACA fusion neoantigens elicit rare endogenous T cell responses that potentiate cell therapy for fibrolamellar carcinoma

Affiliations

DNAJB1-PRKACA fusion neoantigens elicit rare endogenous T cell responses that potentiate cell therapy for fibrolamellar carcinoma

Allison M Kirk et al. Cell Rep Med. .

Abstract

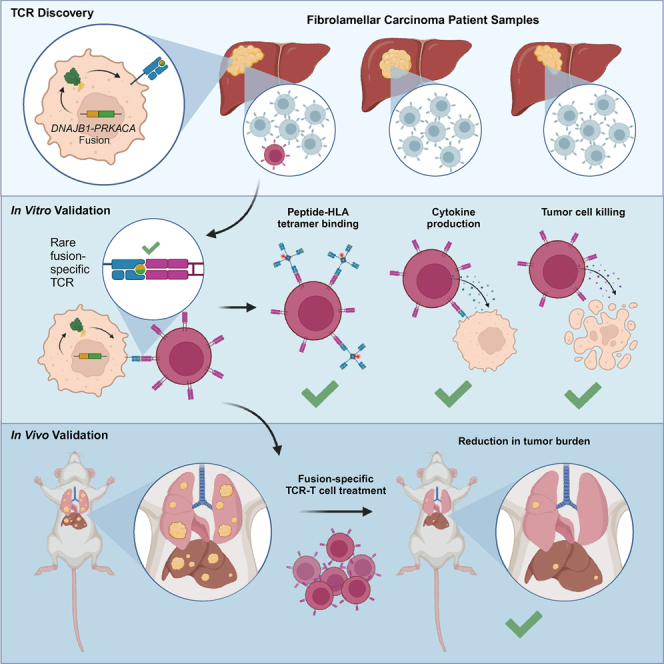
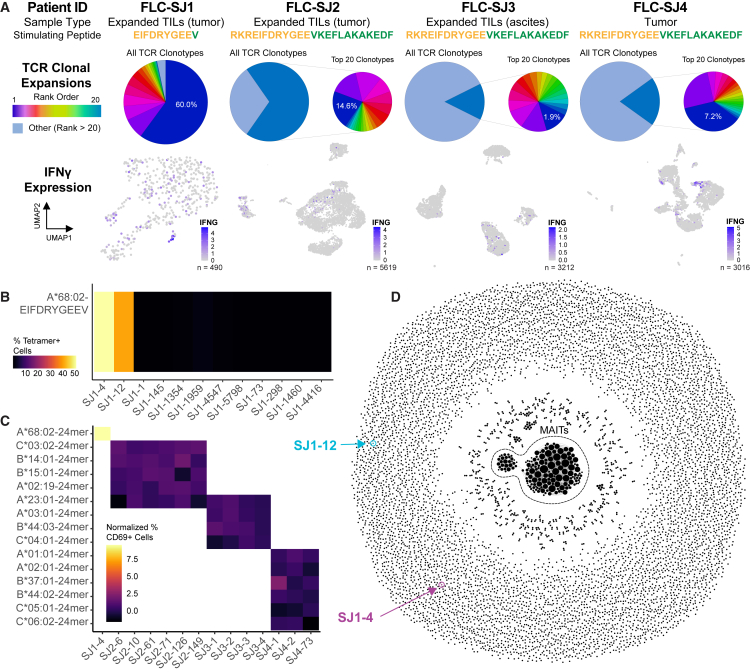
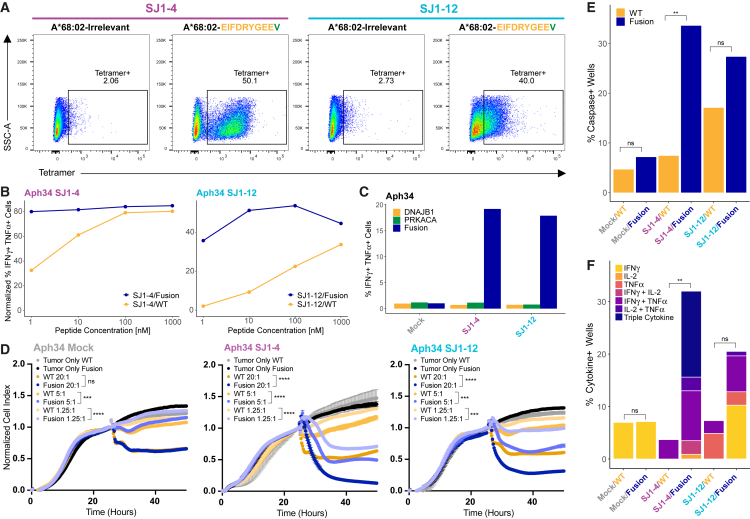
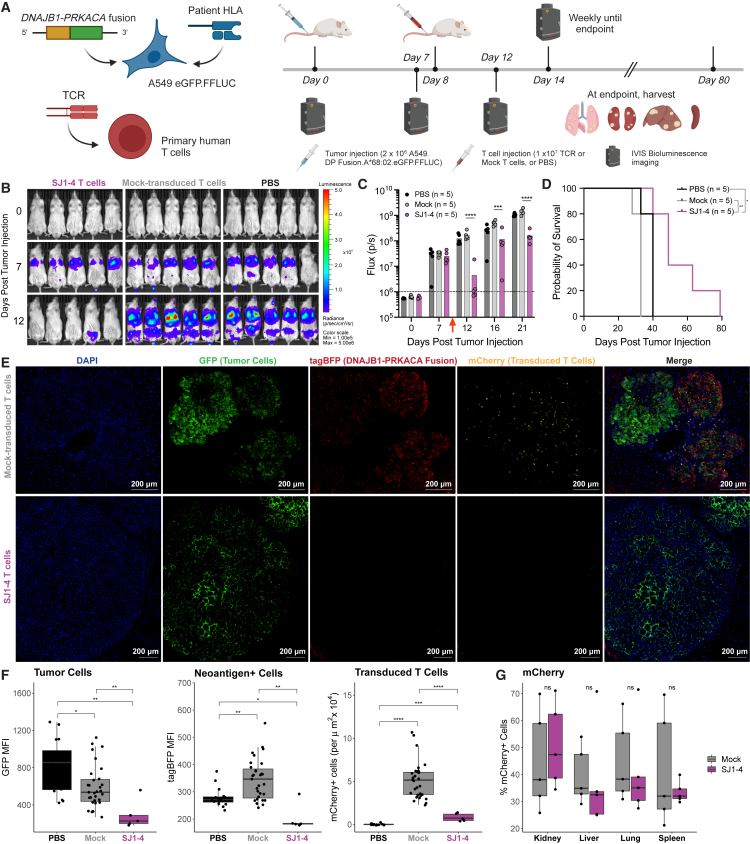
Fibrolamellar carcinoma (FLC) is a liver tumor with a high mortality burden and few treatment options. A promising therapeutic vulnerability in FLC is its driver mutation, a conserved DNAJB1-PRKACA gene fusion that could be an ideal target neoantigen for immunotherapy. In this study, we aim to define endogenous CD8 T cell responses to this fusion in FLC patients and evaluate fusion-specific T cell receptors (TCRs) for use in cellular immunotherapies. We observe that fusion-specific CD8 T cells are rare and that FLC patient TCR repertoires lack large clusters of related TCR sequences characteristic of potent antigen-specific responses, potentially explaining why endogenous immune responses are insufficient to clear FLC tumors. Nevertheless, we define two functional fusion-specific TCRs, one of which has strong anti-tumor activity in vivo. Together, our results provide insights into the fragmented nature of neoantigen-specific repertoires in humans and indicate routes for clinical development of successful immunotherapies for FLC.

Keywords: CD8 T cell; DNAJB1-PRKACA; T cell receptor; TCR repertoire; cell therapy; fibrolamellar carcinoma; gene fusion; immunotherapy; neoantigen.


Conflict of interest statement

Declaration of interests J.C.C., A.M.K., A.E.Z., S.E.S., and P.G.T. have a patent application for TCRs for treating FLC. J.C.C. has additional patent applications in the field of immunotherapy. A.W.P. is a member of the scientific advisory board (SAB) of Bioinformatics Solutions Inc. (Canada), shareholder and SAB member of Evaxion Biotech (Denmark), consultant for Grey Wolf Therapeutics (UK), and cofounder of Resseptor Therapeutics (Melbourne). S.G. is a co-inventor on patent applications in the fields of cell/gene therapy for cancer, consultant of TESSA Therapeutics, member of the Data and Safety Monitoring Board of Immatics, and SAB member of Be Biopharma and has received honoraria from Tidal, Catamaran Bio, and Sanofi within the last 2 years. S.E.S. is a cofounder, stockholder, and paid consultant for Gliknik Inc., serves on the SAB and holds stock options for Virion Inc., and receives royalties from the Mayo Clinic for licensed IP surrounding manipulation of the PD-1:PD-L1 pathway for cancer treatment. P.G.T. is on the SAB of Immunoscape and Shennon Bio, received personal fees and research support from Elevate Bio, and consulted for 10×, Illumina, Pfizer, Cytoagents, and JNJ.

Figures

None
Graphical abstract
Figure 1
Figure 1
T cell infiltration and sustained HLA expression in FLC tumors (A) Immunofluorescence of FLC-SJ5 tumor tissue. Blue, DAPI; red, CD3; green, CD8; white, CD68. Shown is a bar plot quantification of CD3+CD8+ T cells vs. CD3+CD8 T cells. (B) HLA expression levels from 24 FLC patients, classified by sample type. NML, tumor-adjacent non-malignant liver; LIV, primary or recurrent liver tumor; MET, metastatic tumor. Samples from patients with matched samples across types are connected by colored lines, coded by patient ID. A dotted red line shows median HLA expression for healthy liver tissue reported by the GTEx Portal. Wilcoxon rank-sum test; ns, padj > 0.05. (C) HLA expression levels from the patient cohort, plotted by patient and color-coded by sample location. (D) Correlation between HLA expression and the number of predicted fusion neoepitopes for the patient cohort. R indicates the Pearson correlation coefficient.
Figure 2
Figure 2
Fusion neoantigens bind to diverse HLAs and can be detected among eluted HLA-bound peptides (A) Frequency of class I HLAs expressed by 24 FLC patients. (B) Frequency of 16 class I HLA alleles predicted to bind fusion neoepitopes, as reported by AlleleFrequencies.net for US populations, separated by six major racial/ethnic groups. (C) Representative data from the biochemical HLA binding assay for fusion neoantigens predicted for HLA-A∗68:02. (D) Summary of biochemical binding assay results across all 16 HLAs. See also Figure S1C. (E) Number of fusion neoepitopes predicted for each patient in the cohort, color coded by results of the biochemical binding assay. (F) Fragmentation spectrum of the EIFDRYGEEV peptide eluted from the A∗68:02 K562 cell line. See also Figure S2.
Figure 3
Figure 3
Functional responses and TCRs directed against A∗68:02-EIFDRYGEEV among FLC patient TILs and PBMCs (A) Schematic for the experiments. Created using BioRender. (B) Intracellular cytokine staining for IFNγ and TNFα of FLC-SJ1 TILs stimulated with the indicated fusion peptides or control reagents. (C) UMAP plots highlighting expression of IFNG and SJ1-4 TCR in SJ1 TILs after stimulation with EIFDRYGEEV. (D) Differential expression of select genes between TILs expressing SJ1-4 TCR vs. all others in the dataset. See also Table S3. (E) A∗68:02-EIFDRYGEEV tetramer staining of SJ1 PBMCs after expansion (STAR Methods). (F) Frequency of TCR clonotypes among tetramer-positive cells from (E).
Figure 4
Figure 4
Rare endogenous CD8 T cell responses pose challenges to fusion-specific TCR identification in multiple FLC patients (A) Summary of experiments conducted using expanded TIL and tumor samples from four FLC patients (see also Table 1). Samples were stimulated by the indicated fusion peptide prior to single-cell gene expression and paired TCR sequencing. Pie charts represent TCR clonal expansions; expanded pie charts (where present) represent the top 20 most frequent clonotypes and indicate the overall frequency of the most frequent clone (dark blue). UMAP plots highlight expression of IFNG. FLC-SJ1, 490 cells; FLC-SJ2, 5,619 cells; FLC-SJ3, 3,212 cells; FLC-SJ4, 3,016 cells. (B) Frequency of A∗68:02-EIFDRYGEEV tetramer-positive Jurkat cells expressing SJ1 candidate fusion-specific TCRs. (C) Normalized frequency of CD69-positive Jurkat cells expressing candidate fusion-specific TCRs from all patients in (A) (see STAR Methods for calculation). (D) TCRdist network of 8,270 unique, paired TCRs from SJ1. Each node represents a unique TCR clonotype, and two nodes are connected by an edge when their TCRdist < 100; node size corresponds to node degree (number of neighbors). The large central cluster represents mucosal-associated invariant T (MAIT) cells. SJ1-4 and SJ1-12 TCRs are highlighted. See also Figures S4 and S5.
Figure 5
Figure 5
SJ1-4 and SJ1-12 TCRs are fusion specific, functional, and able to kill fusion-positive target cells in vitro (A) A∗68:02-EIFDRYGEEV tetramer staining of SJ1-4 and SJ1-12 TCRs reconstructed and expressed in TCR-null Jurkat cells. (B) Normalized frequency of IFNγ+TNFα+ cells among SJ1-4- or SJ1-12-transduced primary human T cells (donor Aph34) after stimulation with increasing doses of fusion (EIFDRYGEEV) or WT peptide (EIFDRYGEEG) (see STAR Methods for calculation). Data for each TCR were collected in separate single experiments, each using 3 PBMC donors. See also Figure S6D. (C) Frequency of IFNγ+TNFα+ cells among SJ1-4 or SJ1-12 primary human T cells after stimulation with aAPCs expressing DNAJB1-PRKACA fusion or WT transgenes. All data were collected in the same single experiment using 3 PBMC donors. See also Figure S6F. (D) xCelligence assay measuring SJ1-4 or SJ1-12 primary human T cell killing of fusion- or WT-expressing target cells. Target cells adhered for 24 h before addition of T cells at effector:target ratios of 20:1, 5:1, and 1.25:1 (mean ± SD across technical triplicates). Cell index was normalized to 1 at the time of T cell addition. Killing is indicated by a decrease in cell index as target cells die and lift from the plate. SJ1-12 and mock-transduced control data were collected in the same plate; SJ1-4 data were collected in a separate plate with an additional set of mock-transduced controls (comparable with those shown). A t test on normalized cell index values was performed at the final time point. ∗∗∗p < 0.001, ∗∗∗∗p < 0.0001; ns, p > 0.05. See also Figure S6G. (E) Frequency of cleaved caspase-3+ wells in the Berkeley Lights Lightning assay co-culturing a single SJ1-4 or SJ1-12 primary human T cell with a single fusion- or WT-expressing aAPC for 24 h. Data for SJ1-12 and mock-transduced controls were collected in the same experiment; data for SJ1-4 were collected in a separate experiment with an additional set of mock-transduced controls (comparable with those shown). Fisher’s exact test was performed on the proportion of caspase+ cells. ∗∗p < 0.01; ns, p >0 .0.05. See also Figure S6H. (F) Frequency of IFNγ, IL-2, and TNFα production during same Berkeley Lights Lightning assay. Fisher’s exact test was performed on proportions of cytokine+ cells (i.e., single, double, or triple cytokine+). ∗∗p < 0.01; ns, p >0 .0.05.
Figure 6
Figure 6
SJ1-4 T cells control growth of fusion-expressing tumors in vivo and drive fusion-negative recurrences (A) Schematic for in vivo experiments. Created using BioRender. (B) IVIS images of tumor burden in mice treated with SJ1-4 T cells, mock-transduced T cells, or PBS. (C) Tumor radiance measured by in vivo bioluminescence imaging for the first 21 days of study; n = 5 animals/group. A dashed line represents background bioluminescence (approximately 106 photons/second). A red arrow indicates the day of T cell administration. 2-way ANOVA on log-transformed radiance values; ∗∗∗ padj < 0.001, ∗∗∗∗ padj < 0.0001. (D) Survival curves for the duration of the study, n = 5 animals/group. Log rank test; ∗p < 0.05, ∗∗p < 0.01. (E) Representative immunofluorescence of tumors harvested at euthanasia from mice treated with mock-transduced or SJ1-4 T cells. Blue, DAPI; green, GFP (tumor cells); red, tagBFP (cells expressing DNAJB1-PRKACA fusion); yellow, mCherry (transduced T cells). (F) Quantification of GFP median fluorescence intensity (MFI) (left), tagBFP MFI (center), and number of mCherry+ T cells per μm2 × 104 (right). Wilcoxon rank-sum test; ∗ padj < 0.05, ∗∗ padj < 0.01, ∗∗∗ padj < 0.001, ∗∗∗∗ padj < 0.0001. (G) Frequency of mCherry+ CD8 T cells in kidneys, livers, lungs, and spleens harvested at euthanasia from mice treated with mock-transduced or SJ1-4 T cells. Wilcoxon rank-sum test; ns, p > 0.05. See also Figures S7B–S7I.

References

    1. Simon S.M. Fighting rare cancers: lessons from fibrolamellar hepatocellular carcinoma. Nat. Rev. Cancer. 2023;23:335–346. doi: 10.1038/s41568-023-00554-w. - DOI - PMC - PubMed
    1. O’Neill A.F., Church A.J., Perez-Atayde A.R., Shaikh R., Marcus K.J., Vakili K. Fibrolamellar carcinoma: An entity all its own. Curr. Probl. Cancer. 2021;45 doi: 10.1016/j.currproblcancer.2021.100770. - DOI - PubMed
    1. Dinh T.A., Utria A.F., Barry K.C., Ma R., Abou-Alfa G.K., Gordan J.D., Jaffee E.M., Scott J.D., Zucman-Rossi J., O’Neill A.F., et al. A framework for fibrolamellar carcinoma research and clinical trials. Nat. Rev. Gastroenterol. Hepatol. 2022;19:328–342. doi: 10.1038/s41575-022-00580-3. - DOI - PMC - PubMed
    1. El-Serag H.B., Davila J.A. Is fibrolamellar carcinoma different from hepatocellular carcinoma? A US population-based study. Hepatol. Baltim. Md. 2004;39:798–803. doi: 10.1002/hep.20096. - DOI - PubMed
    1. Eggert T., McGlynn K.A., Duffy A., Manns M.P., Greten T.F., Altekruse S.F. Fibrolamellar hepatocellular carcinoma in the USA, 2000-2010: A detailed report on frequency, treatment and outcome based on the Surveillance, Epidemiology, and End Results database. United Eur. Gastroenterol. J. 2013;1:351–357. doi: 10.1177/2050640613501507. - DOI - PMC - PubMed

MeSH terms

Substances

Supplementary concepts