. 2024 Mar 19;5(3):101471.
doi: 10.1016/j.xcrm.2024.101471.

Targeting of vulnerabilities of drug-tolerant persisters identified through functional genetics delays tumor relapse

Affiliations

Targeting of vulnerabilities of drug-tolerant persisters identified through functional genetics delays tumor relapse

Mengnuo Chen et al. Cell Rep Med. .

Abstract

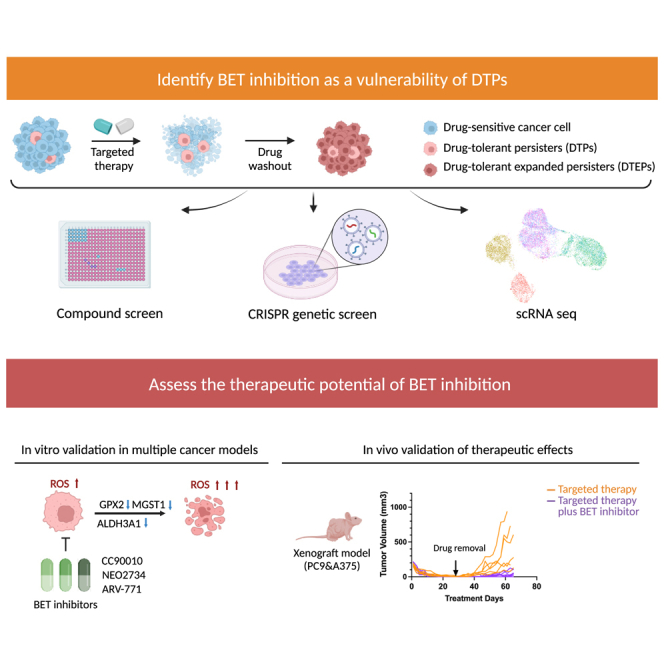
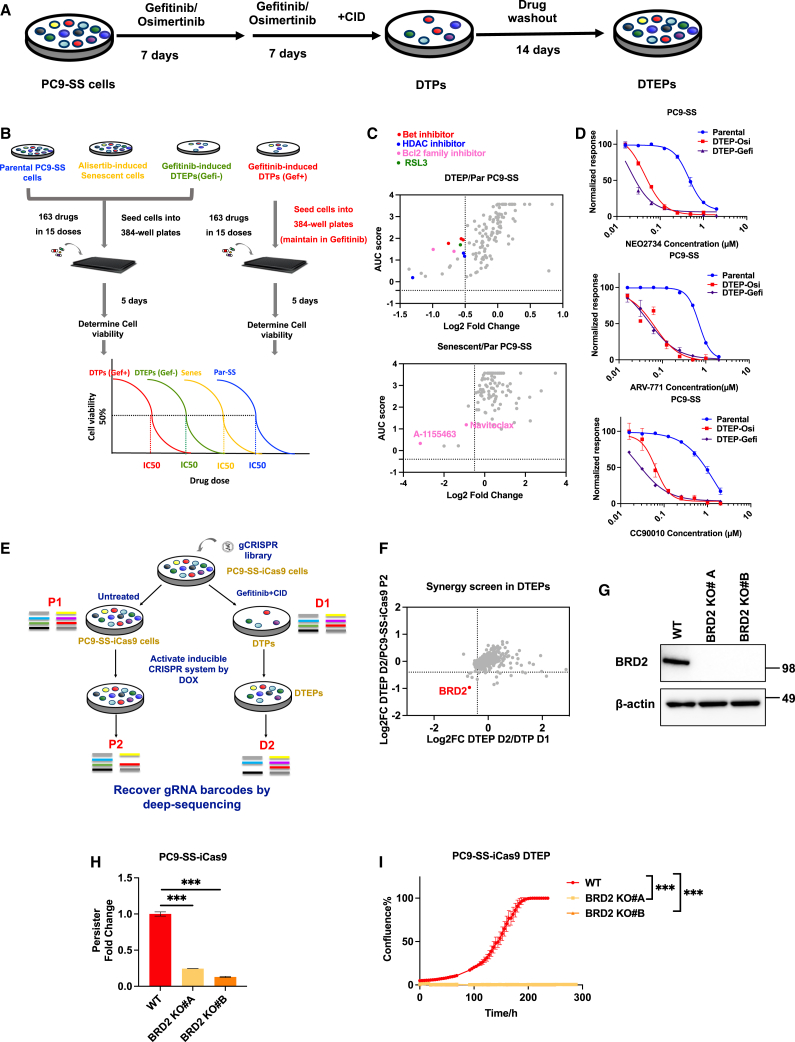
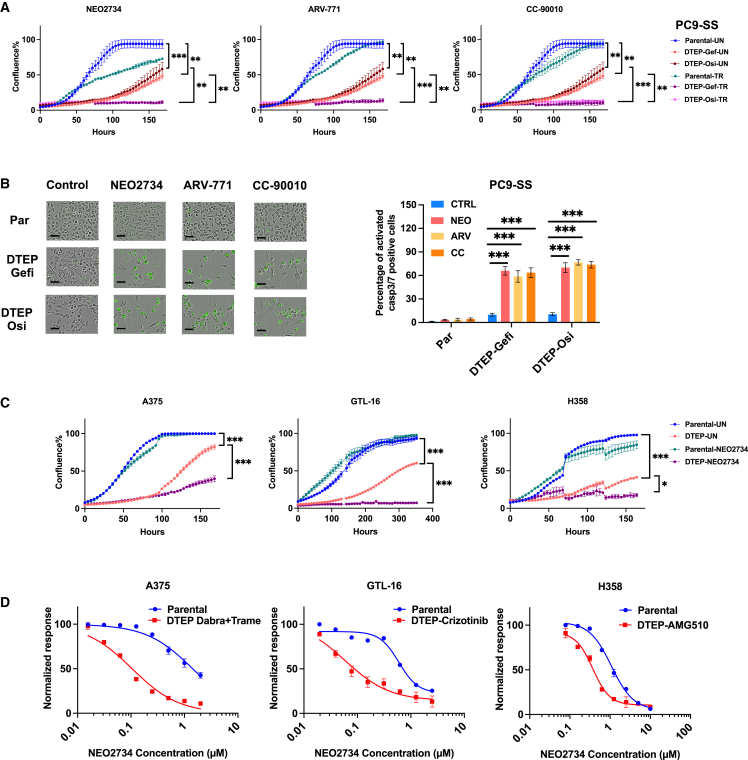
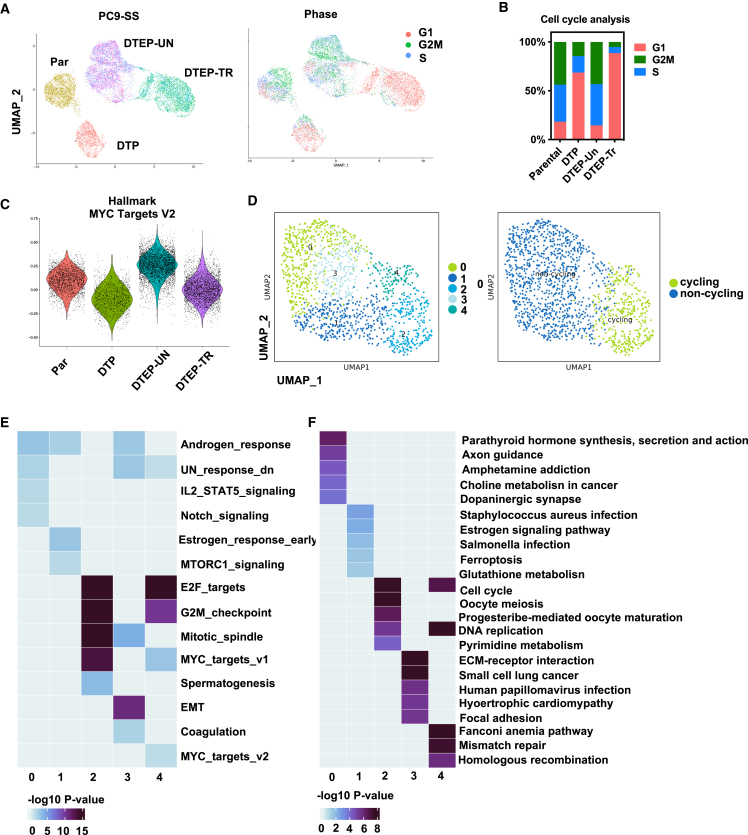
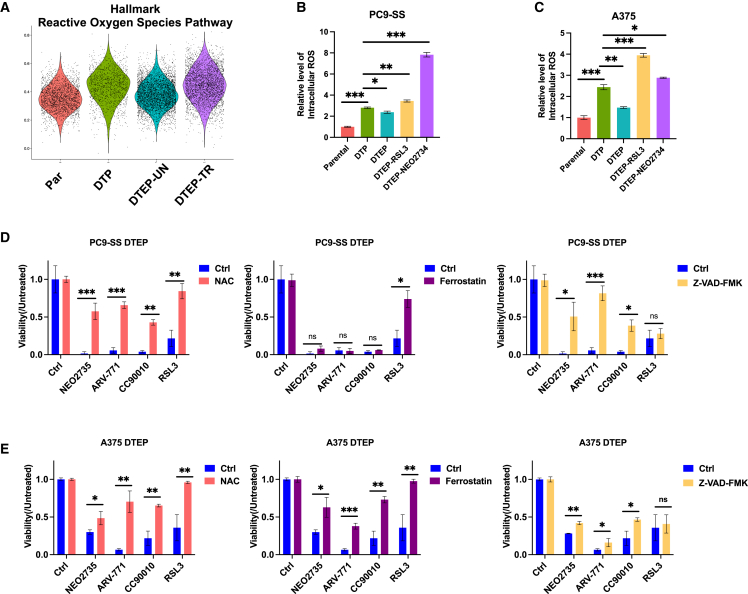
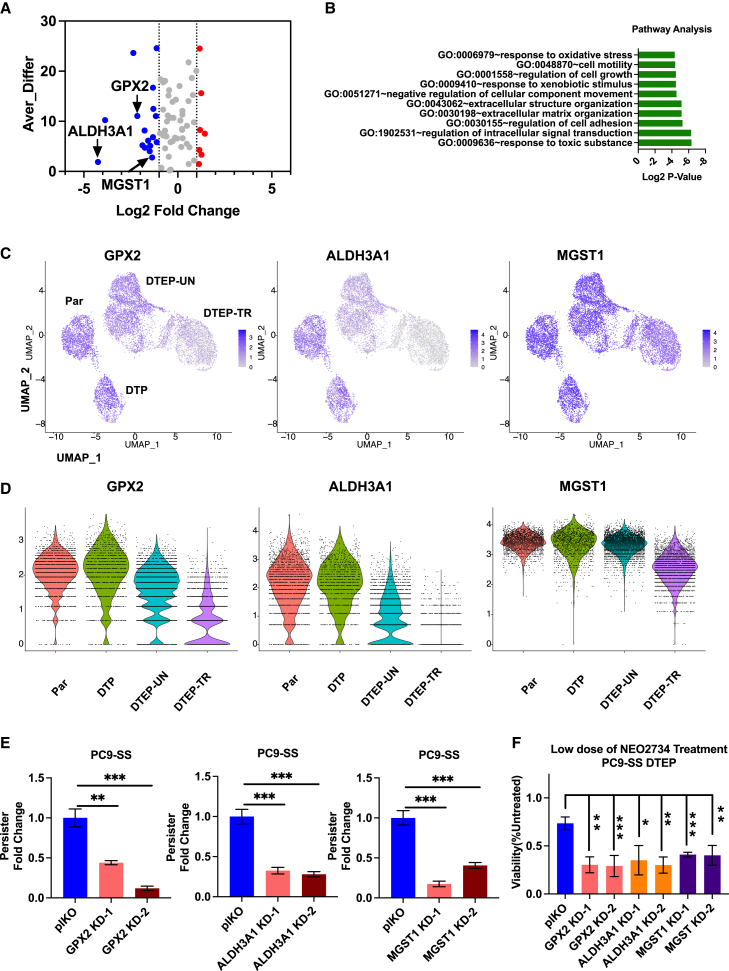
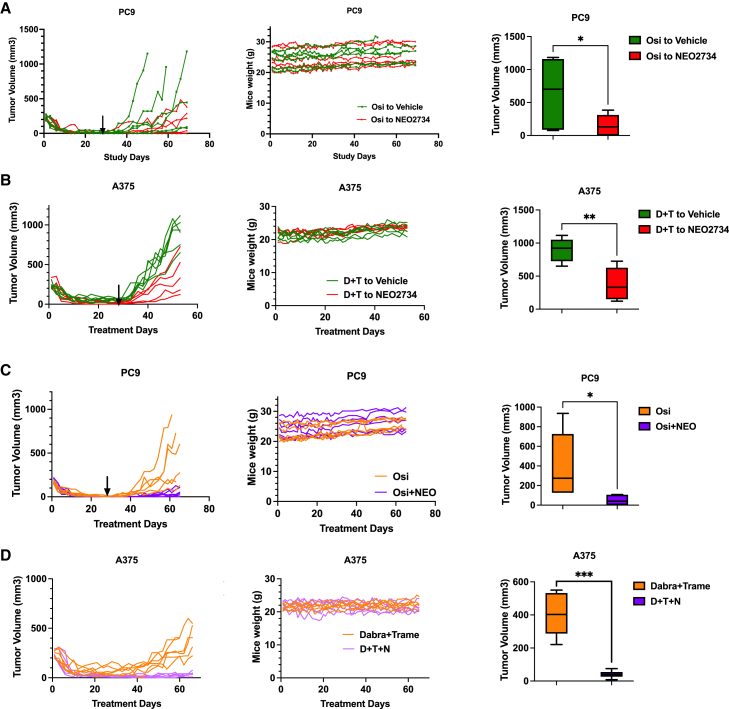
Drug-tolerant persisters (DTPs) are a rare subpopulation of cells within a tumor that can survive therapy through nongenetic adaptive mechanisms to develop relapse and repopulate the tumor following drug withdrawal. Using a cancer cell line with an engineered suicide switch to kill proliferating cells, we perform both genetic screens and compound screens to identify the inhibition of bromodomain and extraterminal domain (BET) proteins as a selective vulnerability of DTPs. BET inhibitors are especially detrimental to DTPs that have reentered the cell cycle (DTEPs) in a broad spectrum of cancer types. Mechanistically, BET inhibition induces lethal levels of ROS through the suppression of redox-regulating genes highly expressed in DTPs, including GPX2, ALDH3A1, and MGST1. In vivo BET inhibitor treatment delays tumor relapse in both melanoma and lung cancer. Our study suggests that combining standard of care therapy with BET inhibitors to eliminate residual persister cells is a promising therapeutic strategy.


Conflict of interest statement

Declaration of interests The authors declare no competing interests.

Figures

None
Graphical abstract
Figure 1
Figure 1
Compound screen and CRISPR-based persister screen identified BRD2 as a vulnerability of DTEPs (A) Schematic representation of DTP induction and generation of DTEPs in PC9-SS cells. (B) Schematic of small-molecule screen on parental, senescent, DTP, and DTEP cells. (C) Top hits were selected based on the therapeutic window of senescent (Senes)/DTEP vs. parental. The x axis represents log fold change of the AUC score (Senes/DTEP vs. parental). The y axis represents the AUC score of Senes/DTEP cells. (D) CellTiter blue quantification of relevant viability of parental cells or DTEPs (osimertinib and gefitinib induced) treated with BET inhibitors. (E) Schematic of CRISPR-based kinome-wide genetic screen on DTEPs (n = 3 for each arm). (F) Top hits were selected based on the fold depletion of sgRNAs DTEP vs. parental. Genes with 4 sgRNA dropped out were identified as hits. (G) Western blot of BRD2 and β-actin in PC9-SS-iCas9 wild-type (WT) and BRD2KO clones. (H) Relative fold change of persisters number based on cell counting obtained from WT and BRD2KO clones after 14 days of osimertinib exposure. (I) IncuCyte-based proliferation of DTEPs of WT and BRD2KO clones. Error bars in (D), (H), and (I) represent mean ± SD, n = 3 independent experiments. Statistical significance was calculated by 2-tailed Student’s t test (∗p ≤ 0.05; ∗∗p ≤ 0.01; ∗∗∗p ≤ 0.001).
Figure 2
Figure 2
BET inhibition selectively triggered apoptotic cell death in EGFR inhibition (EGFRi)-induced persisters in lung cancer and eliminated DTEPs in a broad spectrum of cancer types (A) IncuCyte-based proliferation of parental and DTEPs treated with BET inhibitors (n = 3). (B) Caspase-3/-7 staining images and quantification of parental PC9 cells and DTEPs treated with BET inhibitors or DMSO at 72 h. Black scale bar, 100 μm. (C) CellTiter blue quantification of relevant viability of parental cells or DTEPs (A375, GTL-16, and H358) treated with BET inhibitors. (D) IncuCyte-based proliferation of parental and DTEPs (A375, GTL-16, and H358) treated with NEO2734. Error bars in (A)–(D) represent mean ± SD, n = 3 independent experiments. Statistical significance was calculated by 2-tailed Student’s t test (∗p ≤ 0.05; ∗∗p ≤ 0.01; ∗∗∗p ≤ 0.001).
Figure 3
Figure 3
scRNA-seq uncovered distinct transcriptomic landscapes in parental, DTP, and DTEP cells (A) Uniform manifold approximation and projection (UMAP) representation of scRNA-seq on parental, DTP, DTEP-untreated (DTEP-UN), and DTEP-treated with NEO2734 (DTEP-TR). Cells are colored based on different treatment conditions (left). Cells are colored based on different cell-cycle stages (right). (For DTEP-UN and DTEP/TR, samples were collected at 24 h [T1] and 48 h [T2]. T1 and T2 were analyzed as duplicates). (B) Quantifications of cell-cycle phase for cells in parental, DTP, DTEP-UN, and DTEP-TR. (C) Comparison of Myc targets module scores on parental, DTP, DTEP-UN, and DTEP-TR. (D) UMAP presentations of 5 clusters identified within DTPs. (Left) UMAP representations of cycling and noncycling counterparts within DTPs. (Right) Cycling: G2; noncycling: G1 and S). (E and F) Heatmap summary of representative gene signatures (Hallmark [E] and KEGG [F]) for different clusters within the DTP subset. Color bar indicates −log10 p value.
Figure 4
Figure 4
scRNA-seq identified lethal levels of ROS in DTEPs after BET inhibition (A) Comparison of ROS pathway gene signature module scores on parental, DTP, DTEP-UN, and DTEP-TR. (B and C) Flow cytometry-based quantification of intracellular ROS level (mean fluorescent intensity) in on parental, DTP, DTEP-UN, and DTEP-TR in both PC9 (B) and A375 (C) cells. (Samples collected at 72 h, NEO2734: 0.25 μM). (D and E) Relative cell viability of DTEPs exposure to BET inhibitors with or without NAC, ferrostatin, and Z-VAD-FMK (NEO2734: 0.25 μM; NAC: 2.5 mM; ferrostatin: 2.5 μM; Z-VAD-FMK: 10 μM). Error bars in (B)–(E) represent mean ± SD, n = 3 independent experiments. Statistical significance was calculated by 2-tailed Student’s t test (ns, not significant; ∗p ≤ 0.05; ∗∗p ≤ 0.01; ∗∗∗p ≤ 0.001).
Figure 5
Figure 5
BET inhibition suppressed DTEPs through inhibiting antioxidative DTP markers, including GPX2, MGST1, and ALDH3A1 (A) Differentially expressed DTP markers in NEO2734 treated vs. untreated DTEPs. X axis: log2 fold change (DTEP-TR/DTEP-UN) based on bulk RNA-seq data; y axis: average difference calculated based on scRNA-seq data. Blue: downregulated; red: upregulated. (B) Gene Ontology term enrichment analysis of 17 DTP markers downregulated upon NEO2734 challenged in DTEPs identified in Figure 4A. (C) UMAP representation of GPX2, ALDH3A1, and MGST1 expressions in parental, DTP, DTEP-UN, and DTEP-TR. Color scale indicates the log2 counts per million per cell. (D) Violin plots for GPX2, ALDH3A1, and MGST1 normalized reads in individual cells in parental, DTP, DTEP-UN, and DTEP-TR. (E) Relative fold change of persisters number obtained from GPX2, ALDH3A1, and MGST1 knockdown cells after 14 days of osimertinib and CID exposure. pLKO empty vector-infected cells were used as a control. (F) Relative cell viability of DTEPs upon treatment with NEO2734 (0.05 μM). DTEPs were derived from pLKO, GPX2, ALDH3A1, and MGST1 knockdown cells. pLKO empty vector-infected cells were used as a control. Error bars in (E) and (F) represent mean ± SD, n = 3 independent experiments. Statistical significance was calculated by 2-tailed Student’s t test (∗p ≤ 0.05; ∗∗p ≤ 0.01; ∗∗∗p ≤ 0.001).
Figure 6
Figure 6
BET inhibitor suppressed DTEPs and delayed tumor relapse in vivo with a well-tolerated toxicity (A) Relative tumor volumes and mice weights in sequential treatment groups with either vehicle or NEO2734 in PC9 subcutaneous-bearing mice. Mice were switched to vehicle or NEO2734 treatment at day 28 (n = 6 for each group) (osimertinib, 10 mg/kg once daily, and NEO2734, 4 mg/kg, 5 days/week). (B) Relative tumor volumes and mice weights in sequential treatment groups with either vehicle or NEO2734 in A375 subcutaneous-bearing mice. Mice were switched to vehicle or NEO2734 treatment at day 28 (n = 6 for dabrafenib + trametinib to vehicle, n = 5 for dabrafenib + trametinib to NEO2734) (4 mg/kg NEO2734, 5 days/week; 30 mg/kg dabrafenib + 0.6 mg/kg trametinib daily). (C) Relative tumor volumes and weights for PC9-bearing mice receiving osimertinib monotherapy or osimertinib + NEO2734 combination therapy. Treatments were stopped at day 28 (n = 6 for each group) (osimertinib, 10 mg/kg once daily, and NEO2734, 4 mg/kg, 5 days/week). (D) Relative tumor volumes and weights for A375-bearing mice receiving combination treatment of dabrafenib (D) + trametinib (T) or triple treatment with NEO2734 (N). Mice were treated continuously (n = 6 for each group)) (4 mg/kg NEO2734, 5 days/week; 30 mg/kg dabrafenib + 0.6 mg/kg trametinib daily). Data are presented as mean ± SEM. Two-way ANOVA was applied for the in vivo study statistical analysis (∗p ≤ 0.05; ∗∗p ≤ 0.01; ∗∗∗p ≤ 0.001).

References

    1. Dhanyamraju P.K., Schell T.D., Amin S., Robertson G.P. Drug-Tolerant Persister Cells in Cancer Therapy Resistance. Cancer Res. 2022;82:2503–2514. doi: 10.1158/0008-5472.CAN-21-3844. - DOI - PMC - PubMed
    1. De Conti G., Dias M.H., Bernards R. Fighting Drug Resistance through the Targeting of Drug-Tolerant Persister Cells. Cancers. 2021;13 doi: 10.3390/cancers13051118. - DOI - PMC - PubMed
    1. Sharma S.V., Lee D.Y., Li B., Quinlan M.P., Takahashi F., Maheswaran S., McDermott U., Azizian N., Zou L., Fischbach M.A., et al. A chromatin-mediated reversible drug-tolerant state in cancer cell subpopulations. Cell. 2010;141:69–80. doi: 10.1016/j.cell.2010.02.027. - DOI - PMC - PubMed
    1. Oren Y., Tsabar M., Cuoco M.S., Amir-Zilberstein L., Cabanos H.F., Hütter J.C., Hu B., Thakore P.I., Tabaka M., Fulco C.P., et al. Cycling cancer persister cells arise from lineages with distinct programs. Nature. 2021;596:576–582. doi: 10.1038/s41586-021-03796-6. - DOI - PMC - PubMed
    1. Marsolier J., Prompsy P., Durand A., Lyne A.M., Landragin C., Trouchet A., Bento S.T., Eisele A., Foulon S., Baudre L., et al. H3K27me3 conditions chemotolerance in triple-negative breast cancer. Nat. Genet. 2022;54:459–468. doi: 10.1038/s41588-022-01047-6. - DOI - PMC - PubMed

MeSH terms